[blackcat] L2 SVE Stochastic RSI Level 2
Background
Sylvain Vervoort’ articles in the Aug issues on 2018,“The V-Trade, Part 6”.
Function
In “The V-Trade, Part 6: Technical Analysis—Divergence Indicators” in the August 2018 issue of STOCKS & COMMODITIES, author Sylvain Vervoort introduces a modified version of the stochastic RSI, an indicator that was first introduced by Tushar Chande and Stanley Kroll. That indicator applies a stochastic calculation to an RSI value rather than a simple value, and Vervoort’s update provides additional smoothing. Vervoort uses his new indicator primarily in the analysis of divergence.
Remarks
Tradingview official stoch RSI is added for comparison.
Feedbacks are appreciated.
Blackcat1402

[blackcat] L2 Fourier Series AnalysisLevel 2
Background
John Ehlers’ articles in the July issues on 2019,“Fourier Series Model Of The Market”.
Function
In “Fourier Series Model Of The Market” in this issue, author John Ehlers introduces a Fourier series indicator designed to help traders identify cycles in the market. According to the author, the approach based on five principles outlined by J.M. Hurst in his 1970 book allows the determinization of a security’s primary cycle period and gives a faithful picture of market activity.
Remarks
You have to adjust Entry_TH value for different time frames.
Feedbacks are appreciated.

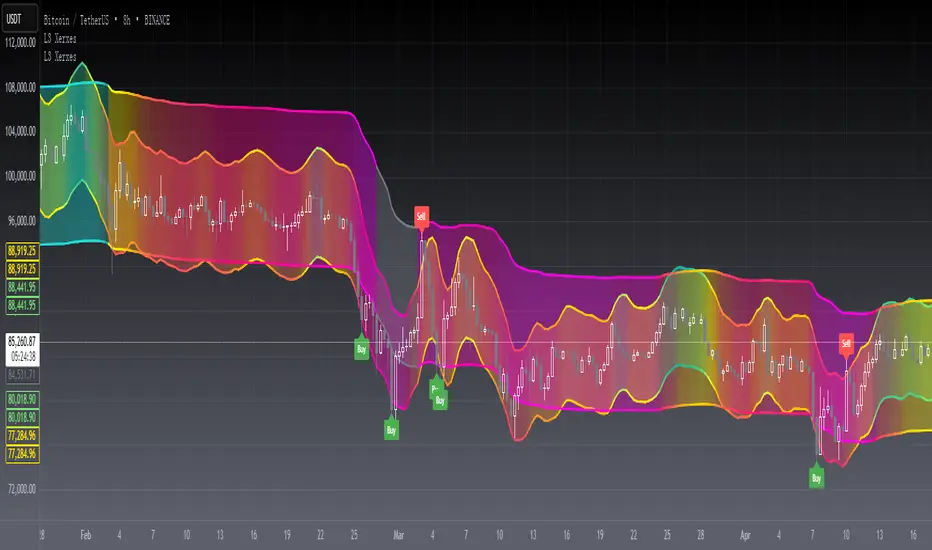
[blackcat] L3 Xerxes ChannelsLevel 3
Background
The stock price channel theory is a widely used and mature theory in western securities analysis. In the 1970s, American Xerxes first established this theory.
Function
In fact, it is contained by the short-term small channel and runs up and down in the long-term large channel. The basic trading strategy is that when the short-term small channel approaches the long-term large channel, it indicates a recent reversal of the trend. The trend reverses downwards as the upper edge approaches, capturing short-term selling points. The trend reverses upward as the lower edge approaches, capturing short-term buying points. Studying this method can successfully escape from the top and catch the bottom in every wave of the market and seek the maximum profit.
The long-term major channel reflects the long-term trend state of the stock, the trend has a certain inertia, and the extension time is long, reflecting the large cycle of the stock, which can grasp the overall trend of the stock, and is suitable for medium and long-term investment;
The short-term small channel reflects the short-term trend status of the stock, accommodates the ups and downs of the stock, effectively filters out the frequent vibrations in the stock trend, but retains the up and down fluctuations of the stock price in the large channel, reflecting the small cycle of the stock, suitable for medium short-term speculation;
The long-term large channel is upward, that is, the general trend is upward. At this time, when the short-term small channel touches or is close to the bottom of the long-term large channel, it indicates that the stock price is oversold and there is a possibility of a rebound. The short-term small channel has touched the top of the long-term large channel, indicating that the stock price has been overbought, and there will be a correction or consolidation in the form, and there is a trend of approaching the long-term large channel. It is more effective if the K-line trend and the short-term small channel trend also match well;
The long-term big channel goes up, and the short-term small channel touches the top of the long-term big channel. At this time, the stock is in the stage of strong elongation. It can be appropriate to wait and see. When it turns flat in the short-term or turns its head down, it is a good delivery point, but it will penetrate If the area is a risk area, you should pay close attention to the reversal signal and ship at any time;
The long-term large channel is downward, that is, the general trend is downward. At this time, the short-term small channel or the stock price peaks and the selling pressure increases, and there is a downward trend again. The bottoming pattern means that the buying pressure is increasing, and there is a requirement for slow decline adjustment or stop decline, and the price movement will tend to be close to the upper edge of the long-term large channel. Callbacks should be treated with caution, and buy only after confirming the reversal signal;
The long-term large channel is down, while the short-term small channel penetrates the bottom line of the long-term large channel downward. At this time, it is mostly a slump process, and there is a rebound requirement, but the decline process will continue. It is not appropriate to open a position immediately. There is an upward trend, and when the short-term small channel turns back up and crosses back, it is a better opportunity to open a position at a low level;
When the long-term large channel is flat horizontally for a long time, it is to consolidate the market, and the price fluctuates up and down along the channel. At this time, it is the stage of adjustment, opening and washing, indicating the emergence of the next round of market. Short-term speculators can sell on highs and buy on lows. If the short-term small channel strongly crosses the long-term large channel, and the long-term large channel turns upward, it indicates that a strong upward trend has begun. If the short-term small channel penetrates down the long-term large channel, and the long-term large channel turns downward, it indicates that the decline will continue.
In a large balanced market, buy when the stock price hits the lower rail of the large channel at the bottom of the swing, and sell when the stock price hits the upper rail of the large channel at the peak of the swing.
Remarks
Feedbacks are appreciated.
[Sextan] PINEv5 Sextans Backtest Framework V3.3Level: 5
Background
In order to celebrate the breakthrough of 4000 followers of my account, I decided to release the Sextan backtesting framework for free use to help more quantitative traders quickly evaluate any technical indicators.
The version released this time is based on the algorithm framework optimization of the old version, and integrates the new feature in Pine V5: Bar Magnifier. This new feature to make Sextan strategy backtesting even more accurate. FYI.
www.tradingview.com
Backtesting of technical indicators and strategies is the most common way to understand a quantitative strategy. However, the complicated configuration and adaptation work of backtesting many quantitative tools makes many traders who do not understand the code daunted. Moreover, although I have written a lot of strategies,
However, I am still not very satisfied with the backtest configuration and writing efficiency. Therefore, I have been thinking about how to build a backtesting framework that can quickly and easily evaluate the backtesting performance of any indicator with a "long/short entry" indicator, that is, a "simple backtesting tool for dummies". The performance requirements should be stable, and the operation should be simple and convenient. It is best to "copy", "paste", and "a few mouse clicks" to complete the quick backtest and evaluation of a new indicator.
Luckily, I recently realized that TradingView provides an "Indicator on Indicator" feature, which is the perfect foundation for doing "hot swap" backtesting. My basic idea is to use a two-layer design. The first layer is the technical indicator signal source that needs to be embedded, which is only used to provide buy and sell signals of custom strategies; the second layer is the trading system, which is used to receive the output signals of the first layer, and filter the signals according to the agreed specifications. , Take Profit, Stop Loss, draw buy and sell signals and cost lines, define and send custom buy and sell alert messages to mobile phones, social software or trading interfaces. In general, this two-layer design is a flexible combination of "fixed and flexiable", which can meet the needs of most traders to quickly evaluate the performance of a certain technical indicator. The first layer here is flexible. Users can insert their own strategy codes according to my template, and they can draw buy and sell signals and output them to the second layer. The second layer is fixed, and the overall framework is solidified to ensure the stability and unity of the trading system. It is convenient to compare different or similar strategies under the same conditions. Finally, all trading signals are drawn on the chart, and the output strategy returns. test report.
The main function:
The first layer: "{Sextan} Your Indicator Source", the script provides a template for personalized strategy input, and the signal and definition interfaces ensure full compatibility with the second layer. Backtesting is performed stably in the backtesting framework of the layer. The first layer of this script is also relatively simple: enter your script in the highlighted custom script area, and after ensuring the final buy and sell signals long = bool condition, short = bool condition, the design of the first layer is considered complete. Input it into the PINE script editor of TradingView, save it and add it to the chart, you can see the pulse sequence in yellow (buy) and purple (sell) on the sub-picture, corresponding to the main picture, you can subjectively judge that the quality of the trading point of the strategy is good Bad.
Pine v4 your indicator template:
Pine v5 your indicator template:
Pine v4 your MTF indicator template:
Pine v5 your MTF indicator template:
The second layer: "{Sextan} PINEv4 Sextans Backtest Framework". This script is the standardized trading system strategy execution and alarm, used to generate the final report of the strategy backtest and some key indicators that I have customized that I find useful, such as: winning rate , Odds, Winning Surface, Kelly Ratio, Take Profit and Stop Loss Thresholds, Trading Frequency, etc. are evaluated according to the Kelly formula. To use the second layer, first load it into the TrainingView chart, no markers will appear on the chart, since you have not specified any strategy source signals, click on the gear-shaped setting next to the "{Sextan} PINEv4 Sextans BTFW" header button, you can open the backtest settings, the first item is to select your custom strategy source. Because we have added the strategy source to the chart in the previous step, you can easily find an option "{Sextan} Your Indicator Source: Signal" at the bottom of the list, this is the strategy source input we need, select and confirm , you can see various markers on the main graph, and quickly generate a backtesting profit graph and a list of backtesting reports. You can generate files and download the backtesting reports locally. You can also click the gear on the backtest chart interface to customize some conditions of the backtest, including: initial capital amount, currency type, percentage of each order placed, amount of pyramid additions, commission fees, slippage, etc. configuration. Note: The configuration in the interface dialog overrides the same configuration implemented by the code in the backtest script.
How to output charts:
The first layer: "{Sextan} Your Indicator Source", the output of this script is the pulse value of yellow and purple, yellow +1 means buy, purple -1 means sell.
The second layer: PINEv4 Sextans Backtest Framework". The output of this script is a bit complicated. After all, it is the entire trading system with a lot of information:
1. Blue and red arrows. The blue upward arrow indicates long position, the red downward arrow indicates short position, and the horizontal bar at the end of the purple arrow indicates take profit or stop loss exit.
2. Red and green lines. This is the holding cost line of the strategy, green represents the cost of holding a long position, and red represents the cost of holding a short position. The cost line is a continuous solid line and the price action is relatively close.
3. Green and yellow long take profit and stop loss area and green and yellow long take profit and stop loss fork. Once a long position is held, there is a conditional order for take profit and stop loss. The green horizontal line is the long take profit ratio line, and the yellow is the long stop loss ratio line; the green cross indicates the long take profit price, and the yellow cross indicates the long position. Stop loss price. It's worth noting that the prongs and wires don't necessarily go together. Because of the optimization of the algorithm, for a strong market, the take profit will occur after breaking the take profit line, and the profit will not be taken until the price falls.
4. The purple and red short take profit and stop loss area and the purple red short stop loss fork. Once a short position is held, there will be a take profit and stop loss conditional order, the red is the short take profit ratio line, and the purple is the short stop loss ratio line; the red cross indicates the short take profit price, and the purple cross indicates the short stop loss price.
5. In addition to the above signs, there are also text and numbers indicating the profit and loss values of long and short positions. "L" means long; "S" means short; "XL" means close long; "XS" means close short.
TradingView Strategy Tester Panel:
The overview graph is an intuitive graph that plots the blue (gain) and red (loss) curves of all backtest periods together, and notes: the absolute value and percentage of net profit, the number of all closed positions, the winning percentage, the profit factor, The maximum trading loss, the absolute value and ratio of the average trading profit and loss, and the average number of K-lines held in all trades.
Another is the performance summary. This is to display all long and short statistical indicators of backtesting in the form of a list, such as: net profit, gross profit, Sharpe ratio, maximum position, commission, times of profit and loss, etc.
Finally, the transaction list is a table indexed by the transaction serial number, showing the signal direction, date and time, price, profit and loss, accumulated profit and loss, maximum transaction profit, transaction loss and other values.
Remarks
Free to use but closed source.

[blackcat] L1 Vitali Apirine Exponential Deviation BandsLevel 1
Background
Vitali Apirine’s articles in the July issues on 2019,“Exponential Deviation Bands”
Function
In “Exponential Deviation Bands” in this issue, author Vitali Apirine introduces a price band indicator based on exponential deviation rather than the more traditional standard deviation, such as is used in the well-known Bollinger Bands. As compared to standard deviation bands, the author’s exponential deviation bands apply more weight to recent data and generate fewer breakouts. Apirine describes using the bands as a tool to assist in identifying trends.
Remarks
Feedbacks are appreciated.

[blackcat] L2 Ehlers Pairs RotationLevel 2
Background
John Ehlers’ articles in the July issues on 2022,“Pairs Rotation With Ehlers Loops, Part 2”
Function
In part 1 of his article in the June 2022 issue (“Ehlers Loops”), John Ehlers uses a relationship of price and volume to determine if any predictive value can be obtained. His technique, called Ehlers Loops, aid in visualizing the performance of one datastream against another. In part 2 appearing in this issue (“Pairs Rotation With Ehlers Loops”), the author demonstrates Ehlers Loops in action with a pairs trading example. This pairs rotation strategy is aimed at minimizing drawdown while simultaneously maximizing return on capital.
Remarks
Feedbacks are appreciated.

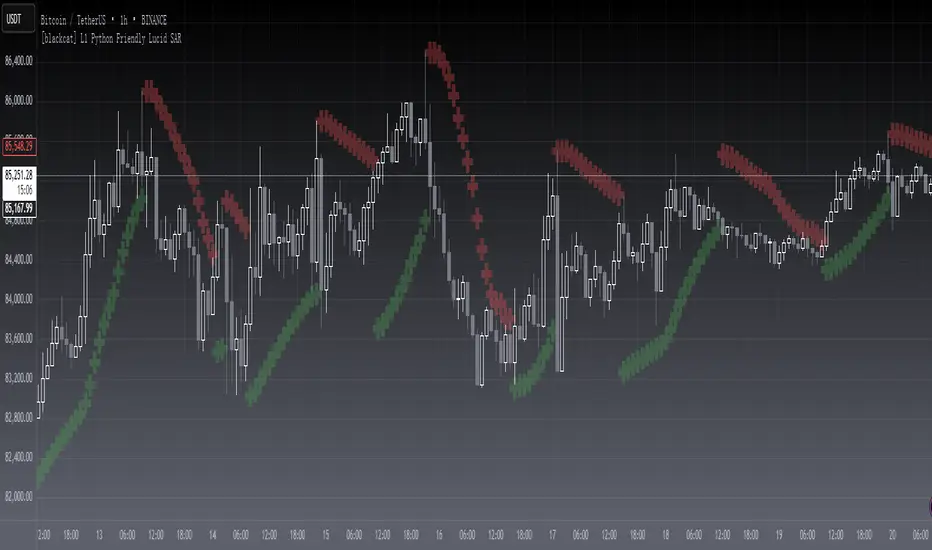
[blackcat] L1 Python Friendly Lucid SARLevel 1
Background
LUCID SAR is an interesting technical indicator. I'm having trouble converting this to Python code. So a "Python friendly" version was rewritten literally. Because some basic functions and structures have been replaced. The performance can be 100% consistent with LUCID SAR.
Function
Mr. Bowman wrote this script after having listened to Hyperwave with Sawcruhteez and Tyler Jenks of Lucid Mr. Bowmannvestments Strategies LLC on July 3, 2019. They felt that the existing built-in Parabolic SAR indicator was not doing its calculations properly, and they hoped that someone might help them correct this. So Mr. Bowman tried his hand at it,adding the rule regarding the SAR not advancing beyond the high (low) of the prior two candles during an uptrend (downtrend), but the core script is as it was.
I use large sized cross with red color for downtrend, with green color for uptrend, so that when I overlapped original work from Mr. Bowman, they can be 100% matched, which provided a validation process for this re-writing work. Enjoy!
Remarks
Feedbacks are appreciated.
Python version Lucid SAR performance discussion is desired.
[blackcat] L1 OBV-MFI ComboLevel 1
Background
As requested, this is a combo of OBV and MFI indicators
Function
On-balance volume (OBV) is a technical trading momentum indicator that uses volume flow to predict changes in stock price. Joseph Granville first developed the OBV metric in the 1963 book Granville's New Key to Stock Market Profits.
The Money Flow Index (MFI) is a technical oscillator that uses price and volume data for identifying overbought or oversold signals in an asset. It can also be used to spot divergences which warn of a trend change in price. The oscillator moves between 0 and 100.
The combo of them is still an oscillator.
Remarks
Feedbacks are appreciated.

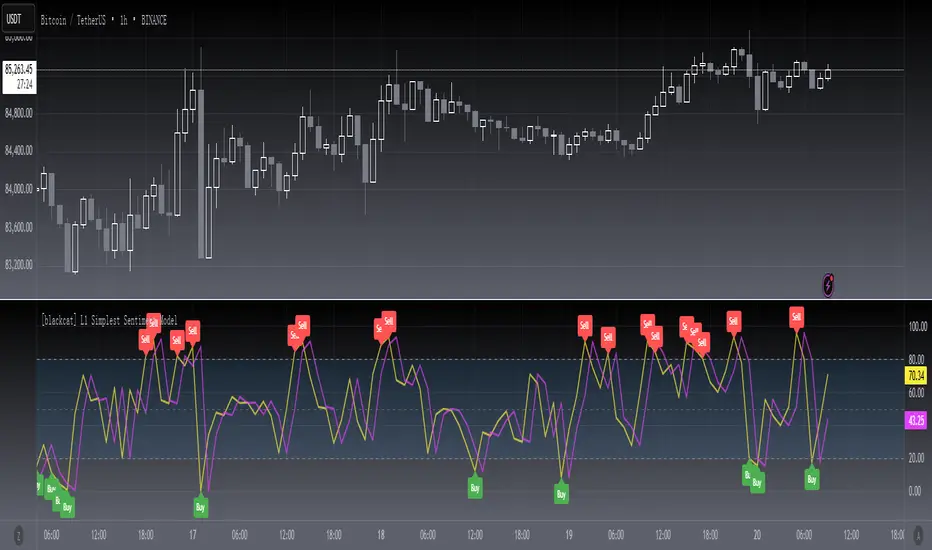
[blackcat] L1 Simplest Sentiment ModelLevel 1
Background
My market sentiment indicator system mainly includes collecting various statistical data and drawing. Again, it was fitted using the OHLC data. This belongs to the latter.
Function
Through a simple calculation, the ratio of high and low breakouts to the price range, we know the sentiment of funds. At the same time, a delay line is used as a trigger signal to judge the inflection point of emotions through the golden fork and the dead fork. Mood thresholds can be defined, such as 20 and 80. This is an oscillator model, but also the simplest indicator of sentiment.
Remarks
Feedbacks are appreciated.
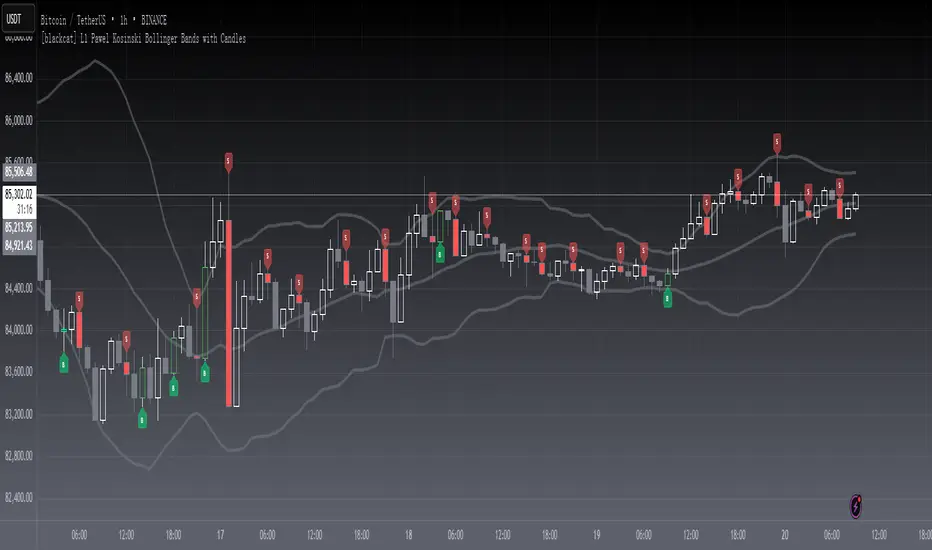
[blackcat] L1 Pawel Kosinski BB with CandlesLevel 1
Background
In Traders’ Tips of October 2019, the focus is Pawel Kosinski’s article : “Combining Bollinger Bands With Candlesticks”
Function
In “Combining Bollinger Bands With Candlesticks” in this issue, author Pawel Kosinski introduces us to a trading indicator that combines standard Bollinger Bands with the bullish engulfing candlestick pattern. Along the way we get a glimpse into the author’s process for trading strategy design and testing.
Remarks
Feedbacks are appreciated.
[blackcat] L3 Market Sentiment IndicatorLevel 3
Background
I've been thinking about trying out some technical indicators of market sentiment recently. Of course, this may not be limited to OHLC data, but requires more statistical data for analysis. However, I still wanted to try making a market sentiment indicator with OHLC. In this way, the difference between the two indicators can be compared later.
Function
This market sentiment indicator is functionally divided into two categories: the first is the sentiment line, which is a total of 3 lines. The first line is the yellow aggressive trader sentiment line, usually expressed as a 5-period moving average; the second line is the purple conservative trader interest line, which I used a slightly more complicated algorithm. The third line is the market sentiment line that takes the average of the first two. It is yellow when the market price is rising and purple when the price is falling.
The second type is the pressure line and the support line, a total of four, when they are support lines, the color is green; once they become resistance lines, the color will change from green to red, and show the current price of pressure or support.
Remarks
Feedbacks are appreciated.

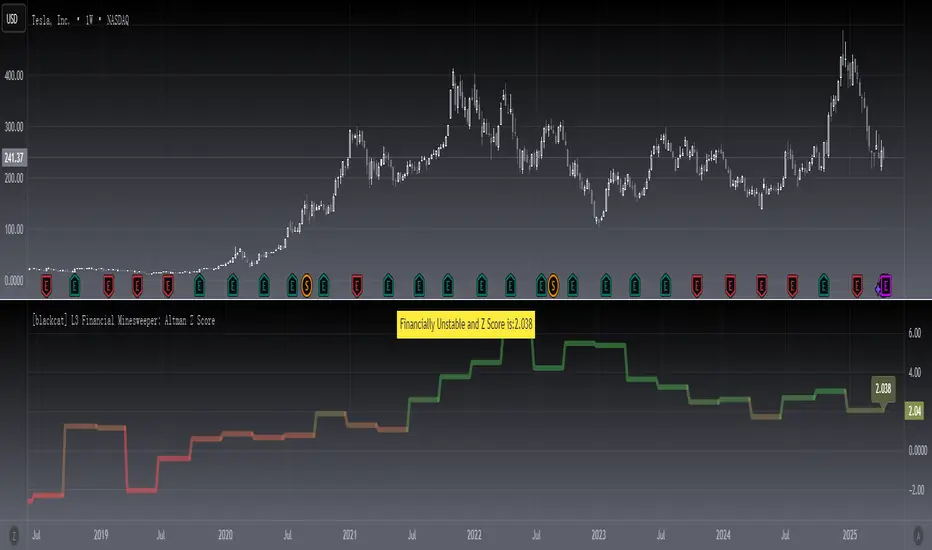
[blackcat] L3 Financial Minesweeper: Altman Z ScoreLevel: 3
Background
The Altman Z-score is the output of a credit-strength test that gauges a publicly traded manufacturing company's likelihood of bankruptcy. The Altman Z-score is a formula for determining whether a company, notably in the manufacturing space, is headed for bankruptcy.
Function
The possibility of financial failure or bankruptcy of the enterprise is analyzed and predicted through the comprehensive score. The lower the Z value, the more likely the enterprise will go bankrupt. By calculating the Z value of an enterprise for several consecutive years, we can find out whether the enterprise has signs of financial crisis. Generally speaking, when the Z value is greater than 2.675, it indicates that the financial situation of the enterprise is good, and the possibility of bankruptcy is small; When the value is less than 1.81, it indicates that the enterprise is in a potential bankruptcy crisis; when the Z value is between 1.81 and 2.675, it is called a "gray area, indicating that the financial situation of the enterprise is extremely unstable.
Remarks
STOCKs ONLY which require financial data.
X1~X5 coefficients can be customized for different stock markets.
Compared to TradingView official Altman Z-Score Indicator.
Feedbacks are appreciated.
[blackcat] L1 Vitali Apirine OBVMLevel 1
Background
Traders’ Tips of April 2020, the focus is Vitali Apirine’s article in the April issue, “On-Balance Volume Modified (OBVM)”.
Function
In “On-Balance Volume Modified (OBVM)” in this issue, author Vitali Apirine presents a new indicator called OBVM that is based on the classic on-balance volume indicator originally developed by Joe Granville. The author has smoothed the OBV calculation and has added a signal line to help the trader identify entry and exit points. Apirine also notes that the OBVM indicator is useful in helping to identify divergences.
Remarks
Feedbacks are appreciated.

[blackcat] L1 Vitali Apirine Compare Price Momentum OscillatorLevel 1
Background
Traders’ Tips of August 2020, the focus is Vitali Apirine’s article in the August issue, “The Compare Price Momentum Oscillator (CPMO)”.
Function
In his article in this issue, “The Compare Price Momentum Oscillator (CPMO),” author Vitali Apirine reintroduces us to the DecisionPoint PMO originally developed by Carl Swenlin and presents a new way to use it to compare the relative momentum of two different securities. Trading signals can be derived in a number of ways including momentum, signal line, and zero-line crossovers.
Remarks
This is a Level 1 free and open source indicator.
Feedbacks are appreciated.

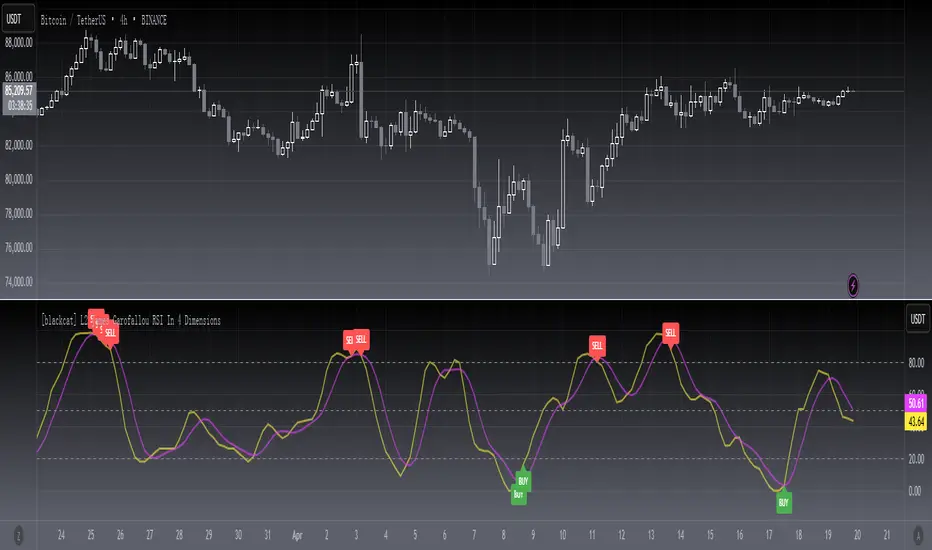
[blackcat] L2 James Garofallou RSI In 4 DimLevel 2
Background
Traders’ Tips of September 2020, the focus is James Garofallou’s article in the September issue, “Tracking Relative Strength In Four Dimensions”.
Function
In “Tracking Relative Strength In Four Dimensions” in this issue, author James Garofallou introduces us to a new method of measuring the relative strength of a security. This new technique creates a much broader reference than would be obtained by using a single security or index and combines several dimensions, as the author calls them, into a single rank value. This study compares a security to another in four dimensions, as explained in the article. James Garofallou presents a metric for a security’s strength relative to 11 major market sectors and over several time periods. All this is squeezed into a single value. The first step is the RS2. It normalizes the security to a market index, then calculates four moving averages and encodes their relations in a returned number. I just modified it by using most BTC-correlated instruments to reflect how BTC response to their performance.
Remarks
This is a Level 2 free and open source indicator.
Feedbacks are appreciated.
[blackcat] L2 FArden Thomas Voting With Multiple TimeframesLevel 2
Background
For Traders’ Tips of November 2020, the focus is F. Arden Thomas’ article in the August 2020 issue, “Voting With Multiple Timeframes”.
Function
F. Arden Thomas sums up the returns by a stochastic indicator in a voting process over seven different timeframes, and uses the resulting votes for trade signals. He shows us a new way of using the classic stochastic oscillator by combining many timeframes into a single value by voting. By using this voting process, buy and sell signals derived from many intervals become clearly visible on the chart. This is an interesting concept that can be applied to many common indicators such as the RSI or ADX, not just the stochastic.
Although the author creates a voting system by counting the number of times the indicator is in overbought/oversold range, I thought it would be interesting to create a composite indicator by averaging the stochastic value over multiple timeframes into a single indicator that moves along the standard scale.
Remarks
Maroon~ Red color bars for bullish market.
Teal~ Green color bars for bearish market.
This is a Level 2 free and open source indicator.
Feedbacks are appreciated.

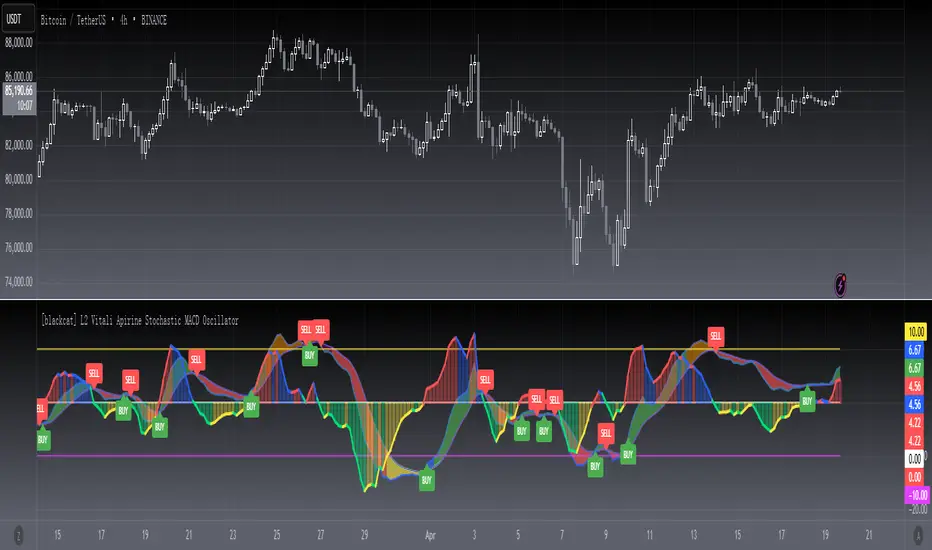
[blackcat] L2 Vitali Apirine Stochastic MACD OscillatorLevel 2
Background
Traders’ Tips of November 2019, the focus is Vitali Apirine’s article in the November issue, “The Stochastic MACD Oscillator”.
Function
In “The Stochastic MACD Oscillator” in this issue, author Vitali Apirine introduces a new indicator created by combining the stochastic oscillator and the MACD. He describes the new indicator as a momentum oscillator and explains that it allows the trader to define overbought and oversold levels similar to the classic stochastic but based on the MACD. The STMACD reflects the convergence and divergence of two moving averages relative to the high–low range over a set number of periods.
Remarks
This is a Level 2 free and open source indicator.
Feedbacks are appreciated.
[blackcat] L1 Richard Poster Trend PersistenceLevel 1
Background
In Traders’ Tips of February 2021, the focus is Richard Poster’s article in the February 2021 issue, “Trend Strength: Measuring The Duration Of A Trend”.
Function
In his article in this issue, Richard Poster outlines several common ways to evaluate the strength and duration of trends. Then he evaluates their sensitivity to volatility. Next, he steps up our game a bit by proposing an indicator that seeks to measure a trend’s persistence rate, or TPR for short. TPR turns out to be relatively insensitive to the influence of volatility.
Financial markets are not stationary; price curves can swing all the time between trending, mean-reverting, or entire randomness. Without a filter for detecting trend regime, any trend-following strategy will bite the dust sooner or later. In his article in this issue, Richard Poster offers a trend persistence indicator (TPR) for helping to avoid unprofitable market periods.The TPR indicator measures the steepness of a SMA (simple moving average) slope and counts the bars where the slope exceeds a threshold. The more steep bars, the more trending the market. Threshold, TPR period, and SMA period are the parameters of the TPR indicator.
Remarks
This is a Level 1 free and open source indicator.
Feedbacks are appreciated.

[blackcat] L1 Vitali Apirine MABWLevel 1
Background
Vitali Apirine’s articles in the July & August issues on 2021, “Moving Average Band Width”
Function
In “Moving Average Bands” (part 1, July 2021 issue) and “Moving Average Band Width” (part 2, August 2021 issue), author Vitali Apirine explains how moving average bands (MAB) can be used as a trend-following indicator by displaying the movement of a shorter-term moving average in relation to the movement of a longer-term moving average. The distance between the bands will widen as volatility increases and will narrow as volatility decreases. In part 2, the moving average band width (MABW) measures the percentage difference between the bands. Changes in this difference may indicate a forthcoming move or change in the trend.
Remarks
This is a Level 1 free and open source indicator.
Feedbacks are appreciated.

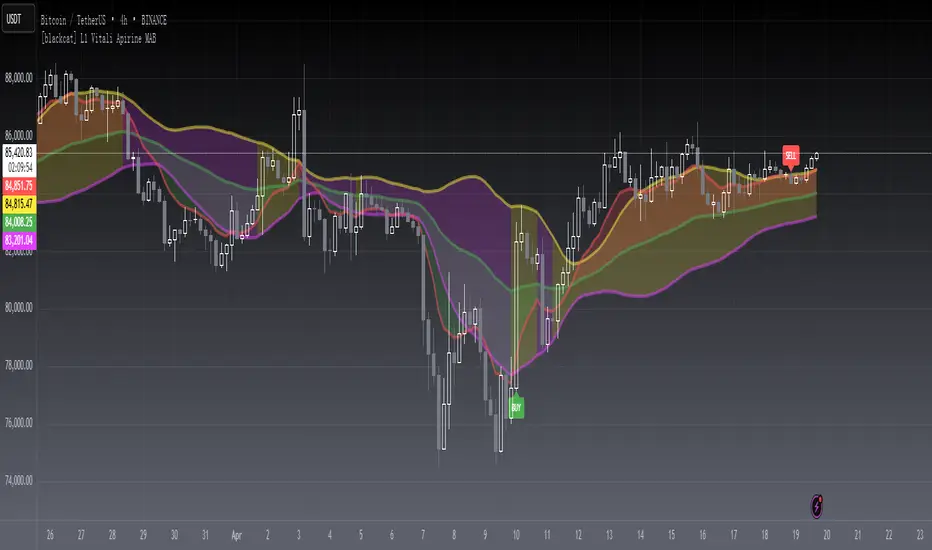
[blackcat] L1 Vitali Apirine MABLevel 1
Background
Vitali Apirine’s articles in the July & August issues on 2021, “Moving Average Bands”
Function
In “Moving Average Bands” (part 1, July 2021 issue) and “Moving Average Band Width” (part 2, August 2021 issue), author Vitali Apirine explains how moving average bands (MAB) can be used as a trend-following indicator by displaying the movement of a shorter-term moving average in relation to the movement of a longer-term moving average. The distance between the bands will widen as volatility increases and will narrow as volatility decreases.
Remarks
This is a Level 1 free and open source indicator.
Feedbacks are appreciated.
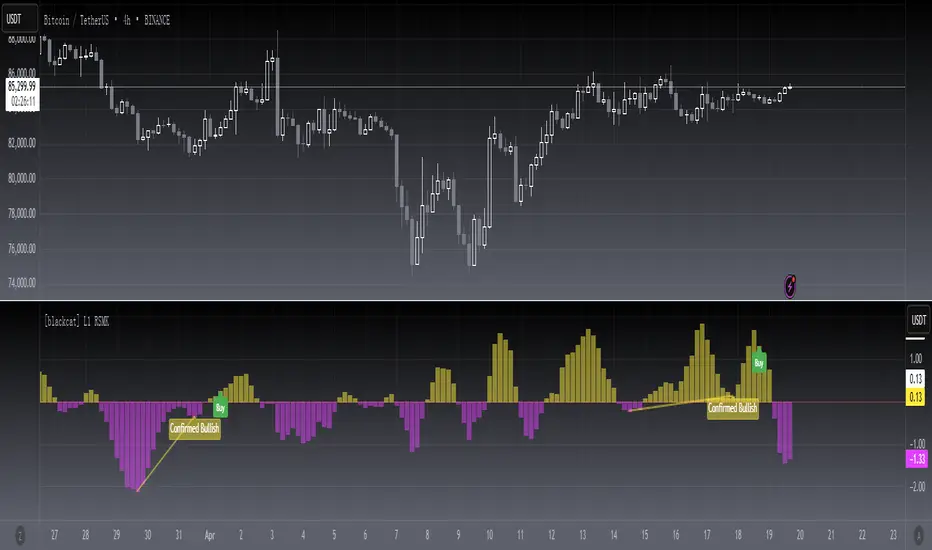
[blackcat] L1 RSMKLevel 1
Background
This is a modified version of indicator from Markos Katsanos’ article in the March issue, “Using Relative Strength To Outperform The Market”.
Function
In “Using Relative Strength To Outperform The Market” in this issue, author Markos Katsanos presents a trading system based on a new relative strength indicator he calls RSMK. The indicator improves on the traditional relative strength indicator by separating periods of strong or weak relative strength.
I found it helpful for divergence identification.
Remarks
This is a Level 1 free and open source indicator.
Feedbacks are appreciated.
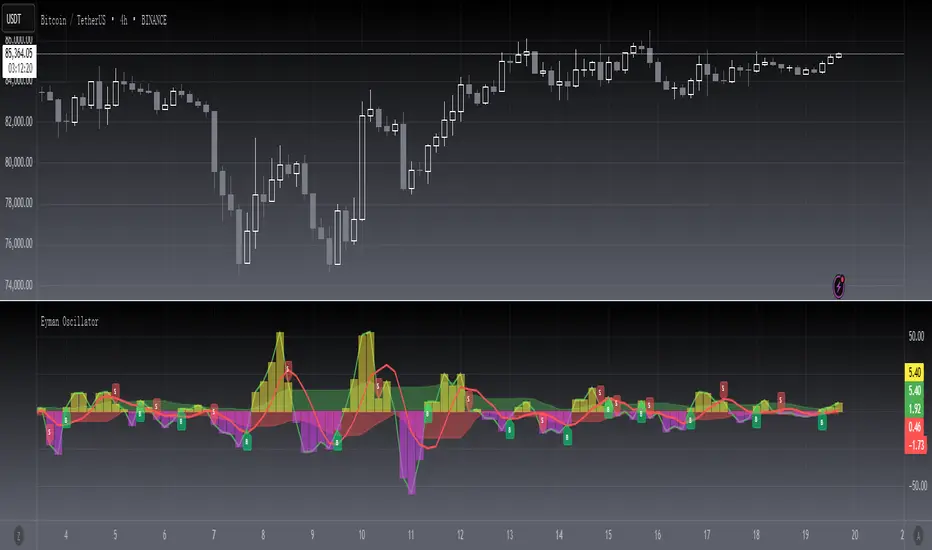
[blackcat] L2 Eyman OscillatorLevel 2
Background
Eyman Oscillator
Function
The Eyman oscillator is also an analytical indicator derived from the moving average principle, which reflects the deviation between the current price and the average price over a period of time. According to the principle of moving average, the price trend can be inferred from the value of OSC. If it is far from the average, it is likely to return to the average. OSC calculation formula: Take 10-day OSC as an example: OSC = closing price of the day - 10-day average price Parameter setting: The period of the OSC indicator is generally 10 days; the average number of days of the OSC indicator can be set, and the average line of the OSC indicator can also be displayed. OSC judgment method: Take the ten-day OSC as an example: 1. The oscillator takes 0 as the center line, the OSC is above the zero line, and the market is in a strong position; if the OSC is below the zero line, the market is in a weak position. 2. OSC crosses the zero line. When the line is up, the market is strengthening, which can be regarded as a buy signal. On the contrary, if OSC falls below the zero line and continues to go down, the market is weak, and you should pay attention to selling. The degree to which the OSC value is far away should be judged based on experience.
Remarks
This is a Level 2 free and open source indicator.
Feedbacks are appreciated.
[blackcat] L3 Faster MACDLevel 3
Background
I am seeking a way to make MACD faster
Function
By using stoch, but with MACD method, a faster MACD is made. short term faster kd is used for macd lines. long term kd is used for histogram, which can counteract the histogram grade gap caused by tradtional MACD.
Remarks
This is a Level 1 free and open source indicator.
Feedbacks are appreciated.
