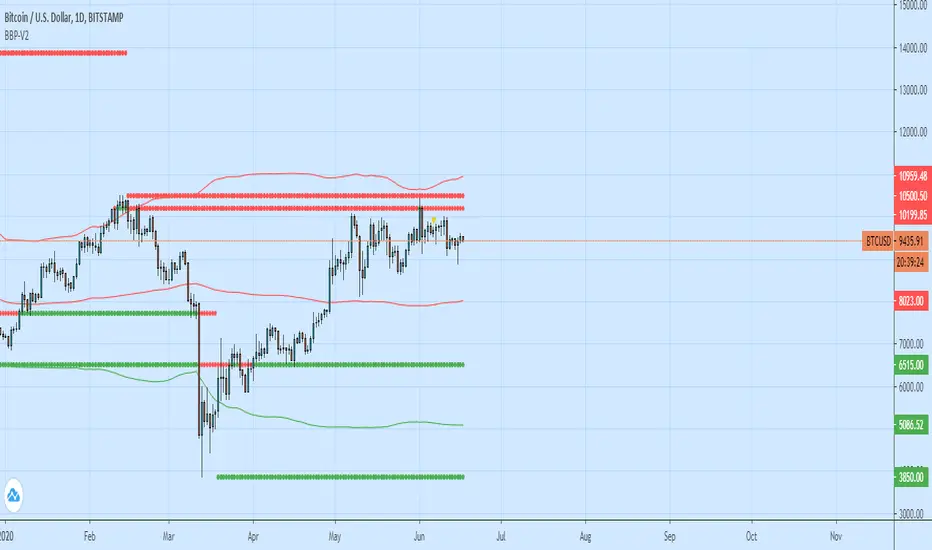
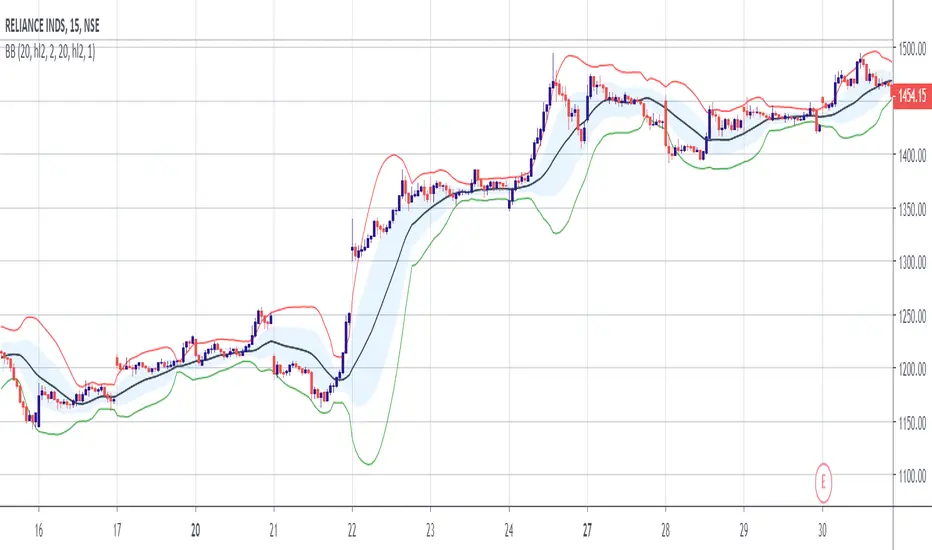
Bollinger Bands + Pivots - V2It drawes a higest or lowest pivot when price intersects with bollinger bands.Pine Script®指標由OnurSelcuk提供已更新 55335
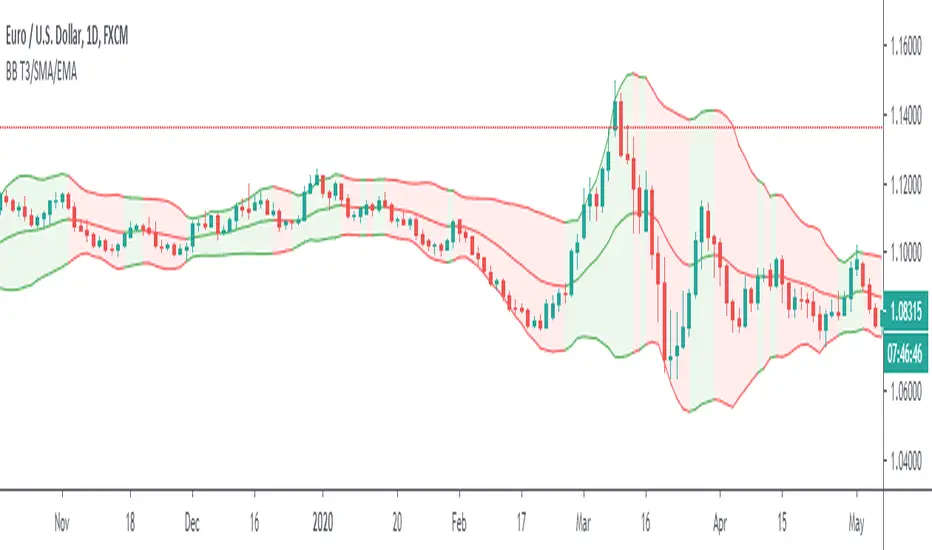
Bollinger Bands T3/SMA/EMAThis is Bollinger Bands script with an option to choose three different moving averages. The simple moving average is the original settings used by Mr Bollinger. Exponential is a popular choice as it adds more value to the recent price movements. T3 is a lot faster at adapting to the recent price. Compared to exponential, it gives even more value to the recent prices and furthermore, it is smoother. I use it to polish my True Range scripts. Another upgrade is the ability to have a different colour of the channel when the baseline moves up or down. Back to calculation? Is it better to use T3 with Bollinger? My opinion is that it depends on the trader. Both of them give you slightly different information and it is essential to look at the historical behaviour and answer for yourself. Will I use T3 calculation? Well, I built this script to find out if I want to. Have a great trade!Pine Script®指標由OrcChieftain提供232
Colored Directional Movement and Bollinger Band's Cloud by DGTThis study combines Bollinger Bands, one of the most popular technical analysis indicators on the market, and Directional Movement (DMI), which is another quite valuable technical analysis indicator. Bollinger Bands used in conjunction with Directional Movement (DMI) may help getting a better understanding of the ever changing landscape of the market and perform more advanced technical analysis Here are details of the concept applied 1- Plots Bollinger Band’s (BB) Cloud colored based on Bollinger Band Width (BBW) Indicator’s value Definition Bollinger Bands (created by John Bollinger ) are a way to measure volatility . As volatility increases, the wider the bands become and similarly as volatility decreases, the gap between bands narrows Bollinger Bands, in widely used approach, consist of a band of three lines. Likewise common usage In this study a band of five lines is implemented The line in the middle is a Simple Moving Average (SMA) set to a period of 20 bars (the most popular usage). The SMA then serves as a base for the Upper and Lower Bands. The Upper and Lower Bands are used as a way to measure volatility by observing the relationship between the Bands and price. the Upper and Lower Bands in this study are set to two and three standard deviations (widely used form is only two standard deviations) away from the SMA (The Middle Line), hence there are two Upper Bands and two Lower Bands. The background between two Upper Bands is filled with a green color and the background between two Lower Bands is filled with a red color. In this we have obtained Bollinger Band’s (BB) Clouds (Upper Cloud and Lower Cloud) Additionally the intensity of the color of the background is calculated with Bollinger Bands Width ( BBW ), which is a technical analysis indicator derived from the standard Bollinger Bands indicator. Bollinger Bands Width, quantitatively measures the width between the Upper and Lower Bands. In this study the intensity of the color of the background is increased if BBW value is greater than %25 What to look for Price Actions : Prices are almost always within the bands especially at this study the bands of three standard deviations away from the SMA. Price touching or breaking the BB Clouds could be considered as buying or selling opportunity. However this is not always the case, there are exceptions such as Walking the Bands. “Walking the Bands” can occur in either a strong uptrend or a strong downtrend. During a strong trend, there may be repeated instances of price touching or breaking through the BB Clouds. Each time that this occurs, it is not a signal, it is a result of the overall strength of the move. In this study in order to get a better understanding of the trend and add ability to perform some advanced technical analysis Directional Movement Indicator (DMI) is added to be used in conjunction with Bollinger Bands. Cycling Between Expansion and Contraction : One of the most well-known theories in regards to Bollinger Bands is that volatility typically fluctuates between periods of expansion (Bands Widening : surge in volatility and price breaks through the BB Cloud) and contraction (Bands Narrowing : low volatility and price is moving relatively sideways). Using Bollinger Bands in conjunction with Bollinger Bands Width may help identifying beginning of a new directional trend which can result in some nice buying or selling signals. Of course the trader should always use caution 2- Plots Colored Directional Movement Line Definition Directional Movement (DMI) (created by J. Welles Wilder ) is actually a collection of three separate indicators combined into one. Directional Movement consists of the Average Directional Index (ADX) , Plus Directional Indicator (+D I) and Minus Directional Indicator (-D I) . ADX's purposes is to define whether or not there is a trend present. It does not take direction into account at all. The other two indicators (+DI and -DI) are used to compliment the ADX. They serve the purpose of determining trend direction. By combining all three, a technical analyst has a way of determining and measuring a trend's strength as well as its direction. This study combines all three lines in a single colored shapes series plotted on the top of the price chart indicating the trend strength with different colors and its direction with triangle up and down shapes. What to look for Trend Strength : Analyzing trend strength is the most basic use for the DMI. Wilder believed that a DMI reading above 25 indicated a strong trend, while a reading below 20 indicated a weak or non-existent trend Crosses : DI Crossovers are the significant trading signal generated by the DMI With this study A Strong Trend is assumed when ADX >= 25 Bullish Trend is defined as (+D I > -DI ) and (ADX >= 25), which is plotted as green triangle up shape on top of the price chart Bearish Trend is defined as (+D I < -DI ) and (ADX >= 25), which is plotted as red triangle down shape on top of the price chart Week Trend is assumed when 17< ADX < 25, which is plotted as black triangles up or down shape, depending on +DI-DI values, on top of the price chart Non-Existent Trend is assumed when ADX < 17, which is plotted as yellow triangles up or down shape, depending on +DI-DI values, on top of the price chart Additionally intensity of the colors used in all cases above are defined by comparing ADX’s current value with its previous value Summary of the Study: Even more simplified and visually enhanced DMI drawing comparing to its classical usage (may require a bit practice to get used to it) As said previously, to get a better understanding of the trend and add ability to perform some advanced technical analysis Directional Movement Indicator (DMI) is used in conjunction with Bollinger Bands. PS: Analysis and tests are performed with high volatile Cryptocurrency Market Source of References : definitions provided herein are gathered from TradingView’s knowledgebase/library Disclaimer: The script is for informational and educational purposes only. Use of the script does not constitutes professional and/or financial advice. You alone the sole responsibility of evaluating the script output and risks associated with the use of the script. In exchange for using the script, you agree not to hold dgtrd tradingview user liable for any possible claim for damages arising from any decision you make based on use of the script Pine Script®指標由dgtrd提供已更新 1919971
GM 1 EMA + BBScript that contains the below EMA 5 26 50 Indicates when the 5x26 EMA occurs. BB 2Pine Script®指標由farokh_dubash提供1146
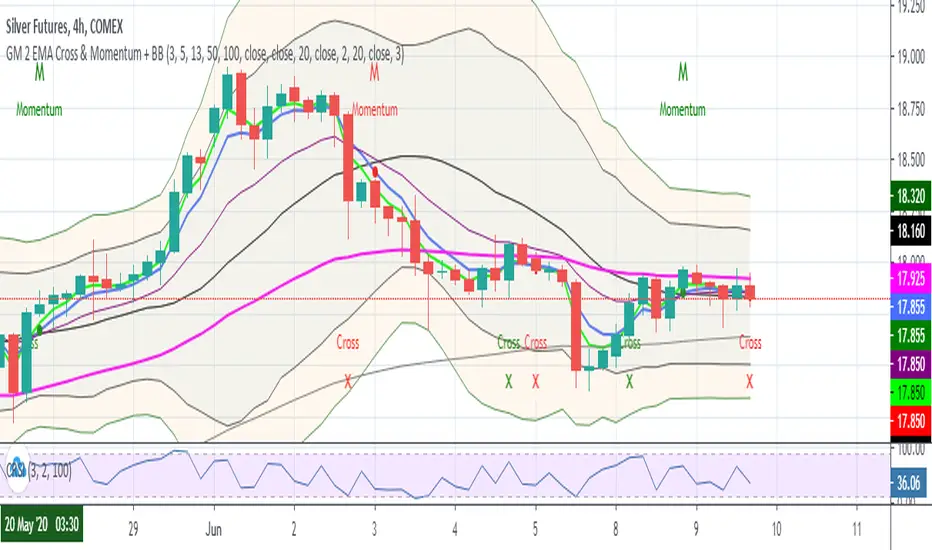
GM 2 EMA Cross + BBScript for seeing the below EMAs 3 5 13 50 100 This also plots a red cross when -ve crossover of 3 by 5 EMA & green cross when +ve crossover of 3 by 5 EMA Bollinger Bands 2 3Pine Script®指標由farokh_dubash提供已更新 42
MultiTimeFrame Shifting Bollinger BandsJust 3 Bollinger Bands with different adjustable timeframes plus shifting (left/right) capability and non-integer deviation values. I wrote this because I couldn't find the perfect BB indicator that matches my needs. Feel free to use it.Pine Script®指標由informanerd提供已更新 275
Triple MA + EMA + SMMA + BBCombined multiple scripts under one script. Great for Free account users. ;-) This script contains: Moving Average Exponential Moving Average Smoothed Moving Moving Average Bollinger BandsPine Script®指標由mdeniz提供128
Overlay_set by HallyIt is a set of overlay indicators that combine 5 simple moving averages, Bollinger band, and clouds of Ichimoku cloud. The reason I made this is because I want to make it easier to switch the display of the indicator when trading in a short time. For example, if you double-click SMA, the setting dialog for this indicator opens. Immediately check the check box of the Bollinger you want to add and close the dialog. You can quickly switch the display with this feeling and save the amount of mouse movement. x0xXx0xx0xXx0xx0xXx0xx0xXx0xx0xXx0xx0xXx0xx0xXx0xx0xX 単純移動平均線5本と、ボリンジャー・バンド、一目均衡表の雲を1つにまとめたオーバーレイ系のインジケーターのセットです。 これを作った理由は短い時間でのトレードの際にインジケーターの表示を切り替えるのを楽にしたいからです。 たとえば、SMAをダブルクリックすればこのインジケーターの設定ダイアログが開くのですぐに追加表示したいボリンジャーのチェックボックスにチェックしてダイアログを閉じる。 という感じで素早く表示を切り替えることが出来き、マウスの移動量を節約できます。Pine Script®指標由Hally5150提供已更新 46
Bollinger Bands Strategy - CohenIndicator based on the “Prince of NY” strategy developed by Rodrigo Cohen . It consists in the use of Bollinger Bands, combined with a coloring rule to indicate places of purchase and sale. An entry signal is given when a candle close outside the band, where, if the next one closes inside, there is the entrance, looking for the MA or the other band. Red candle - indicates a sell signal. Green candle - indicates a buy signal.Pine Script®指標由LucasZancheta提供22271
GM EMA BB {EMA(5-26-50) + BB(2-3)}A modified script that shows the EMA of 5, 26, 50 along with nested Bollinger Bands of 2 & 3 mult. Useful for Growth Module studentsPine Script®指標由farokh_dubash提供27
CBG Swing HighLow MAThis indicator will show the swing high and lows for the number of bars back. It's very easy to use and shows good support and resistance levels. I then took it a step further and added a moving average with all the standard types in my indicators: SMA EMA Weighted Hull Symmetrical Volume Weighted Wilder Linear Regression I then added Bollinger Bands to show the standard deviation from the midline. Finally, I added a simple bar coloring scheme: green if above the upper BB, Red if below and orange if in the middle. I am just testing this out so please use with caution. If anyone in the community wants to run some backtests, that would be great and we would all appreciate it. Of course you can keep it all simple and turn off all the moving averages and bollinger bands. Enjoy! :-)Pine Script®指標由GoldBands提供已更新 55240
Gap driven intraday trade (better in 15 Min chart)// Based on yesterday's High, Low, today's open, and Bollinger Band (20) in current minute chart, // Defined intraday Trading opportunity: Stop, Entry, T0, Target (S.E.T.T) // Back test in 60, 30, 15, 5 Min charts with SPY, QQQ, XOP, AAPL, TSLA, NVDA, UAL // In 60 and 30 min chart, the stop and target are too big. 5 min is too small. // 15 min Chart is the best time frame for this strategy; // ------------------------------------------------------------------------------- // There will be Four lines in this study: // 1. Entry Line, // 1.1 Green Color line to Buy, If today's open price above Yesterday's High, and current price below BB upper line. // 1.2 Red Color line to Short, if today's open price below Yesterday's Low, and current above BB Lower line. // // 2. Black line to show initial stop, one ATR in current min chart; // // 3. Blue Line (T0) to show where trader can move stop to make even, one ATR in current min chart; // // 4. Orange Line to show initial target, Three ATR in current min chart; // // Trading opportunity: // If Entry line is green color, Set stop buy order at today's Open; // Whenever price is below the green line, Prepare to buy; // // If Entry line is Red color, Set Stop short at today's Open; // Whenever price is above the red line, Prepare to short; // // Initial Stop: One ATR in min chart; // Initial T0: One ATR in min chart; // Initial Target: Three ATR in min chart; // Initial RRR: Reward Risk Ratio = 3:1; // // Maintain: Once the position moves to T0, Move stop to "Make even + Lunch (such as, Entry + $0.10)"; // Allow to move target bigger, such as, next demand/supply zone; // When near target or demand/supply zone or near Market close, move stop tightly; // // Close position: Limit order filled, or near Market Close, or trendline break; // // Key Step: Move stop to "Make even" after T0, Do not turn winner to loser; // Willing to "in and out" many times in one day, and trade the same direction, same price again and again. // // Basic trading platform requests: // To use this strategy, user needs to: // 1. Scan Stocks Before market open: // Prepare a watch list for top 10 ETF and Top 90 stocks which are most actively traded. // Stock might be limited by price range, Beta, optionable, ... // Before market open, Run a scan for these stocks, find which has GAP and inside BB; // create watch list for that day. // // 2. Attach OSO and OCO orders: // User needs to Send Entry, Stop (loss), and limit (target) orders at one time; // Order Send order ( OSO ): Entry order sends Stop order and limit order; // Order Cancel order ( OCO ): Stop order and limit order, when one is filled, it will cancel the other instantly; Pine Script®指標由PlanTradePlanMM提供33303
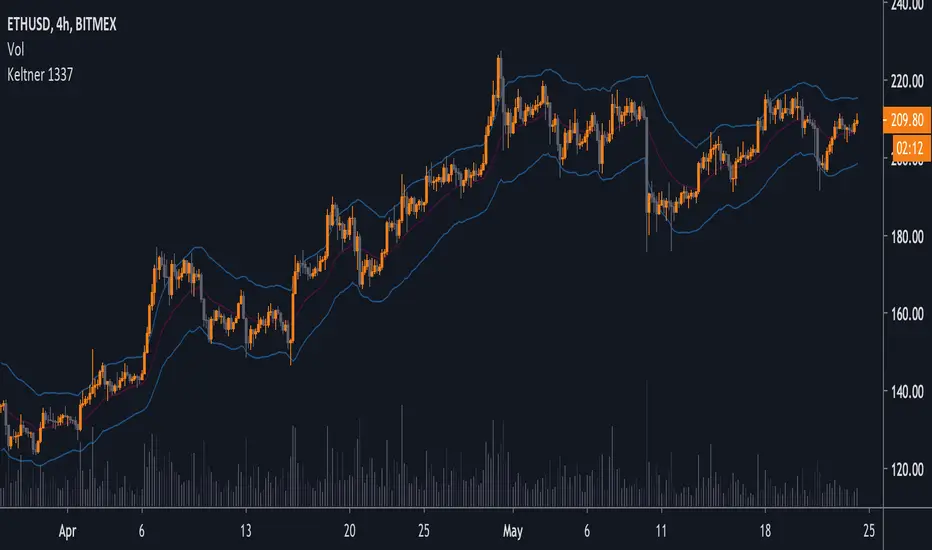
Keltner 1337This is a configurable Keltner Channel type indicator with an overridable ATR length.Pine Script®指標由JMOZ1337提供2256
(NKC) MTF Squeeze Pro MultiTimeframe Squeeze Momentum Pro Dots indicate squeeze Fills indicate momentum Pine Script®指標由nkcming提供55331
BB Monitor IndicatorThis is a basic volatile indicator based in the Bollinger Bands that show the explosive market moves (up/down).Pine Script®指標由cahebebe提供1169
EMA + BBThis is a combination of EMA and Bollinger Bands, easy to use.Pine Script®指標由cahebebe提供已更新 163
Double Bollinger Bands StrategyThe Strategy involves two Bollinger Bands (BB) at a go. One with Divergence of 1 and another 2. Strategy: When the price rides above the inner BB, buy, check if it rides above the second BB. Exit when price falls inside the Outer BB and enters the Inner BB. When the price rides below the inner BB, buy, check if it rides below the second BB. Exit when price rises inside the Outer BB and enters the Inner BB.Pine Script®指標由abhisekpl提供已更新 33149
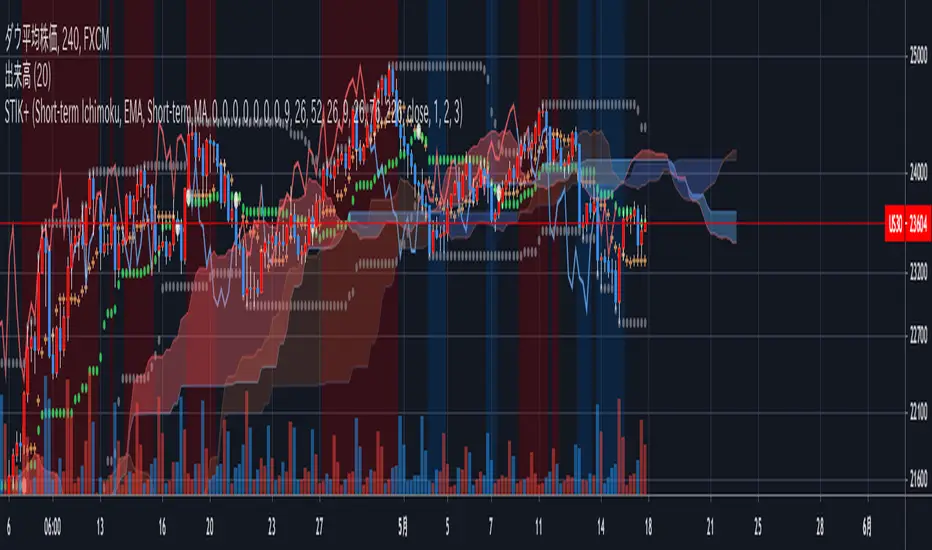
Short-Term Ichimoku Kinko-hyo+This Ichimoku Kinko-Hyo is an indicator which has been changed for short-term trading and, It has a “target price theory(one of three theory of Ichimoku Kinko-Hyo) function.” Also, In this indicator, It can be plotting the “Span model”, “Super Bollinger Bands” which has Invented by a Japanese currency dealer Toshihiko Masaki, And Moving Average. In addition, you can select setting only “clouds” and “Lagging span” or displaying Default Ichimoku Kinko-Hyo. This indicator is modified original Ichimoku Kinko-Hyo, but It made based on the true usage of Ichimoku Kinko-Hyo. For the evidence, I referred to the book supervised by Ichimoku-Sanjin the third generation. Describe below about features↓↓↓. - 2nd Cloud to check relation two Lead Lines and Lagging span. - Background-color for discovering “Three Roles Improvement (In Japanese: 三役好転)” and “Three Roles Reversal (In Japanese: 三役逆転)”. - Signal of Crossing Base Line and Conversion Line. - mode selection of Ichimoku Kinko Hyo. - Calculation feature for Target Price theory. - A switch to replace Base Line and Conversion Line with 3 Moving Average lines. - And others...Pine Script®指標由UnknownUnicorn4078706提供已更新 4496
JSE Top 40 Comparative Relative Strength RSI OscillatorThis code is the result of an idea by @MarcoOlivano. The question was that if putting the comparative relative strength as an RSI oscillator would help in understanding the relative strength of the stock to the overall market? As we both trade the JSE I have made the JSE:J200 or Top 40 the basis for comparison. This can be changed in the settings dropdown if you want to compare with the All Share Index (JSE:J201) or other markets such as the S&P. On the chart above I have included the Comparative Relative Strength as a reference together with the Comparative Relative Strength RSI. If you use the indicator or adapt it please let me know if it works for you, how you use it and if it has any value. Pine Script®指標由SteynTrade提供1173
Fancy Bollinger Bands [BigBitsIO]This script is for a Bollinger Band type indicator with as many features as I can possibly fit into a Bollinger Band type indicator. Features: - A single custom moving average serving as the middle band. - Standard MA inputs. - MA type. - MA period. - MA price. - MA resolution (time frame). - Visibility toggle. - MA Candle Type - Fancy MA inputs. - Toggle to show only candles included in the MA calculation ("Highlight inclusion") or display entire MA history. - Toggle to show a ghost trail when Highlight inclusion is toggled on. Displays a shaded version of past MA history before the inclusion period (as seen on snapshot). - Toggle to show forecast values for the MA. - Other inputs related to forecasting: - Forecast bias. (Neutral forecasts MA if the current price remains the same.) - Forecast period. - Forecast magnitude. - Toggle showing details on the screen - Toggle the visibility of the fill between the upper and lower bands. - Toggle to use ATR instead of the standard deviation to calculate the location of the upper and lower bands. - Custom input for the ATR period. A couple of quick notes. The label will only show up if toggled on, and will always show above the highest of either the candle high or upper band. The fill colors are based on the level of %B currently on the indicator. Higher levels are green, and brighter green, while lower levels are red and brighter red. The fill is lighter in shadow areas to reflect their status as not being included in the middle band calculation. *** DISCLAIMER: For educational and entertainment purposes only. Nothing in this content should be interpreted as financial advice or a recommendation to buy or sell any sort of security or investment including all types of crypto. DYOR, TYOB. ***Pine Script®指標由BigBitsIO提供已更新 1212713
JSE Top 40 Comparative Relative StrengthThis code adapts the code by vitvlkv to be appropriate for comparison of JSE stocks with the Top 40 index. It also includes moving averages and Bollinger Bands to identify extreme conditions. You can change the colours and deselect moving averages to make the plot less cluttered. You can also change the selection to compare the stock against to JSE:J201 if you want to compare it to the All Share Index. Pine Script®指標由SteynTrade提供已更新 45
Bollinger Channels / EMA and SMAThis is written as a system to replace the BB strategy. I think it will work well. It looks pretty stylish. Description / Usage: Adjust the length and multiplier based on your location with Bollinger Bands. The multiplier of 1 provides you with a basic channel with high and low-source EMA (or SMA). And with the 8-day exponential moving average, you can observe short entries and exits. I wish good luck to the friends who will use it. You can support and track new indicators. Bu, BB stratejisinin yerini alacak bir sistem olarak yazılmıştır. Oldukça şık görünüyor. Kullanım Bollinger Bantları ile bulunduğunuz yere göre uzunluk ve çarpanı ayarlayın. 1 çarpanı size yüksek ve düşük kaynaklı EMA (veya SMA) içeren temel bir kanal sağlar. Ve 8 günlük üstel hareketli ortalama ile kısa giriş ve çıkışları gözlemleyebilirsiniz. Kullanacak arkadaşlara bol kazançlar diliyorum. Yeni indikatör için destek olabilir ve takip edebilirsiniz. Pine Script®指標由Merchant_Captain_Jack提供22124
Mean Reversion w/ Bollinger BandsThis is a more advanced version of my original mean reversion script. It employs the famous Bollinger Bands. This robot will buy when price falls below the lower Bollinger Band, and sell when price moves above the upper Bollinger Band. I've only tested it on the S&P 500, though you could try it out on other assets to see the backtest performance. During the recent COVID-19 bear market drop, it produced several buy signals on the S&P which I followed, and made some nice gains so far. I still think this would make a better investing strategy (buy undervalued / sell over-valued), rather than a trading strategy. I use this robot for my long term portfolio.Pine Script®策略由UnknownUnicorn1373033提供1414961