Americana Crypto Retail FOMO IndexRetail FOMO Index
Overview
The Retail FOMO Index is a sentiment indicator designed to help identify when retail investors are piling into the crypto market — often a sign that the market may be approaching overheated conditions. Historically, periods of extreme retail enthusiasm have coincided with local and macro tops, making this a useful tool for gauging market temperature.
What It Measures
This indicator combines two real-time data sources to create a composite "FOMO score" scaled from 0 to 100:
Coinbase Premium (50% weight)
This measures the price difference between Bitcoin on Coinbase (USD) and Binance (USDT). When US retail investors are aggressively buying, Coinbase often trades at a premium to other exchanges. A rising premium suggests increased retail demand, while a negative premium can indicate selling pressure or reduced interest.
Coinbase Stock Volume (50% weight)
This tracks the trading volume of COIN (Coinbase's stock on NASDAQ) relative to its recent average. When retail interest in crypto surges, Coinbase stock volume tends to spike as both crypto traders and traditional investors react to market momentum. The indicator calculates a Z-score to identify when volume is unusually high or low compared to its norm.
Settings
The indicator includes adjustable parameters:
Weights: Adjust the balance between Coinbase Premium and COIN Volume if you find one component more relevant
Lookback Period: Controls how much historical data is used for normalization (default: 50 periods)
Smoothing: Reduces noise in the final output (default: 7 periods)
Threshold Levels: Customize the boundaries for each zone
Display Options: Toggle component lines and background fills on/off
Important Notes
The COIN volume data begins in April 2021 (Coinbase IPO), so the indicator does not have data prior to that date
The Coinbase Premium is calculated using BTC regardless of what asset chart you apply it to — BTC tends to be the leading indicator for broad retail sentiment
This indicator works best on daily, weekly, and monthly timeframes
This is a sentiment tool, not a trade signal — use it alongside your existing analysis to add context
廣量指標

Order Flow Pro - CVD - Alphaomega18═══════════════════════════════════════════════════════════════════════════════
ORDER FLOW CVD SIMPLE - TRADINGVIEW PUBLICATION
Created by Alphaomega18
═══════════════════════════════════════════════════════════════════════════════
📝 COMPLETE DESCRIPTION
═══════════════════════════════════════════════════════════════════════════════
🎯 FOLLOW INSTITUTIONAL TREND AT A GLANCE
Order Flow CVD is an ultra-simple and ultra-effective indicator that displays CVD (Cumulative Volume Delta) with a colored fill zone to instantly identify order flow trend.
No complexity, no clutter: just 2 lines and 1 colored zone to know if you should HOLD or EXIT your trade.
🔥 THE GOLDEN RULE OF TRADING
The secret of professional traders:
→ "Let your winners run, cut your losses"
But how do you know WHEN to hold and WHEN to exit?
**The answer: CVD (Cumulative Volume Delta)**
As long as institutional flow goes your way, HOLD the trade.
As soon as flow changes, EXIT.
This is exactly what this indicator does: it shows you the flow in real-time with ultra-clear visualization.
📊 HOW IT WORKS
🔷 **2 SIMPLE LINES**
**WHITE Line** = CVD (Cumulative Volume Delta)
→ Cumulative sum of volume delta
→ Rises when buying > selling
→ Falls when selling > buying
**YELLOW Line** = CVD Moving Average (20 periods default)
→ Smooths CVD to see trend
→ Filters noise
→ Reference for trend
🔷 **COLORED FILL ZONE**
🟢 **GREEN ZONE** = White CVD ABOVE yellow CVD
→ BULLISH trend
→ Institutions are BUYING
→ HOLD your LONG trades
→ Avoid SHORT
🔴 **RED ZONE** = White CVD BELOW yellow CVD
→ BEARISH trend
→ Institutions are SELLING
→ HOLD your SHORT trades
→ Avoid LONG
⚡ **CROSSOVER** = Zone changes color
→ Trend change
→ Exit or reverse position
→ Clear and sharp signal
🎯 USAGE RULES
📌 **RULE #1: HOLD A LONG TRADE**
You're in a LONG:
→ ✅ As long as ZONE IS GREEN → HOLD
→ ❌ As soon as ZONE TURNS RED → EXIT
Real example:
```
LONG entry: 16,500
Zone stays green for 2 hours
Price climbs to 16,650 (+150 points)
Zone turns red → EXIT
You pocket +150 points instead of giving back 50 points!
```
📌 **RULE #2: HOLD A SHORT TRADE**
You're in a SHORT:
→ ✅ As long as ZONE IS RED → HOLD
→ ❌ As soon as ZONE TURNS GREEN → EXIT
Real example:
```
SHORT entry: 16,500
Zone stays red for 1 hour
Price drops to 16,350 (-150 points)
Zone turns green → EXIT
You pocket +150 points!
```
📌 **RULE #3: DON'T ENTER COUNTER-TREND**
Green zone visible:
→ ❌ Do NOT enter SHORT
→ ✅ Look for LONG setups only
Red zone visible:
→ ❌ Do NOT enter LONG
→ ✅ Look for SHORT setups only
📌 **RULE #4: CROSSOVERS = CHANGE**
White CVD crosses yellow CVD:
→ Zone changes color
→ Institutional flow reverses
→ Exit or reverse position
💡 REAL USE CASES
📊 **CASE 1: MNQ Scalping 5min**
Setup:
→ Price breaks resistance
→ CVD zone is GREEN
→ You enter LONG
Management:
→ Price rises, pulls back, rises again
→ Zone STAYS GREEN → You hold
→ +30 points, +40 points, +50 points...
→ Zone turns RED → You exit at +52 points
Without CVD:
→ You would have exited at +15 points out of fear
→ You lose 37 points of gain!
📊 **CASE 2: ES Day Trading 15min**
Setup:
→ Price in range
→ CVD zone RED for 1 hour
→ Price touches top of range
→ You enter SHORT
Management:
→ Zone STAYS RED during decline
→ Price makes -20 points, -30 points, -40 points
→ Zone turns GREEN → You exit at +42 points
Without CVD:
→ You would have exited at +20 points (fear)
→ Or held too long and gave back gains
📊 **CASE 3: Avoid Losing Trade**
Perfect technical setup:
→ Triangle breakout
→ Supportive VWAP
→ FVG below
BUT... CVD zone is RED!
Decision:
→ You DON'T ENTER LONG
→ Price rises 10 points then collapses -30 points
→ Losing trade avoided thanks to CVD!
⚙️ CUSTOMIZABLE PARAMETERS
🔧 **CVD Moving Average Length** (default: 20)
→ Yellow moving average length
→ Shorter (10-15) = More reactive, more signals
→ Longer (30-50) = Smoother, fewer false signals
Recommendations by style:
• Scalping (1-5min): 10-15
• Day Trading (15min-1H): 20 (default)
• Swing Trading (4H-Daily): 30-50
🎨 **Show Fill Between CVD and MA** (On/Off)
→ Show/hide colored zone
→ OFF = Just 2 lines
→ ON = Lines + green/red zone
🎨 **Bullish Fill Color** (Customizable)
→ Bullish zone color
→ Default: Transparent green (80%)
→ Change to blue, cyan, or other
🎨 **Bearish Fill Color** (Customizable)
→ Bearish zone color
→ Default: Transparent red (80%)
→ Change to orange, pink, or other
💡 **Transparency Tip:**
→ 90% transparent = Very subtle
→ 80% transparent = Balanced (recommended)
→ 60% transparent = Well visible
→ 40% transparent = Very visible
📊 RECOMMENDED CONFIGURATIONS
**Scalping (1-5min) - Reactive**
```
CVD MA Length: 10
Show Fill: ✅ ON
Bullish Color: Green 70% transparent
Bearish Color: Red 70% transparent
```
**Day Trading (15min-1H) - Balanced** ⭐
```
CVD MA Length: 20
Show Fill: ✅ ON
Bullish Color: Green 80% transparent
Bearish Color: Red 80% transparent
```
**Swing Trading (4H-Daily) - Smooth**
```
CVD MA Length: 30
Show Fill: ✅ ON
Bullish Color: Green 85% transparent
Bearish Color: Red 85% transparent
```
**Minimalist - Lines only**
```
CVD MA Length: 20
Show Fill: ❌ OFF
(Just white and yellow, no zone)
```
💡 MARKETS AND TIMEFRAMES
✅ **ALL markets compatible:**
• Futures (ES, NQ, YM, RTY, MNQ, MES, etc.)
• Forex (EUR/USD, GBP/USD, USD/JPY, etc.)
• Crypto (BTC, ETH, altcoins)
• Stocks (Tesla, Apple, Nvidia, etc.)
• Indices (S&P 500, Nasdaq, Dow Jones)
✅ **All timeframes:**
• Scalping: 1min, 5min
• Day Trading: 15min, 30min, 1H ⭐ (optimal!)
• Swing Trading: 4H, Daily
Note: More reliable with real volume data
→ TradingView Premium recommended
🏆 UNIQUE ADVANTAGES
✅ **Ultimate simplicity**: 2 lines, 1 zone, 1 rule
✅ **Instant vision**: Green = hold LONG, Red = hold SHORT
✅ **Hold trades longer**: Maximize your gains
✅ **Avoid counter-trend**: Don't trade against flow
✅ **Customizable**: Colors and transparency of choice
✅ **Ultra-light**: Optimized code, no lag
✅ **No repaint**: Reliable signals
✅ **Works everywhere**: All markets, all TF
🎓 QUICK INTERPRETATION
**When zone is GREEN:**
→ Institutions buying
→ Bullish momentum
→ Hold LONG, avoid SHORT
→ Look for buy setups
**When zone is RED:**
→ Institutions selling
→ Bearish momentum
→ Hold SHORT, avoid LONG
→ Look for sell setups
**When zone CHANGES color:**
→ Institutional flow reverses
→ Trend changes
→ EXIT position
→ Or reverse if new setup
**White line volatile:**
→ White CVD zigzags a lot
→ Market indecisive or range
→ Wait for clear zone before trade
💪 TRADER PSYCHOLOGY
What THIS indicator solves:
❌ "I'm afraid, I exit too early" → Green/red zone says WHEN to exit
❌ "I hold my losses too long" → Zone changes = EXIT
❌ "I trade counter-trend" → Zone tells which direction to trade
❌ "I don't know if trend continues" → Green/red zone = answer
Result:
✅ You hold your gains longer
✅ You exit at right time
✅ You avoid counter-trend trades
✅ You trade with institutions
🔗 PERFECT COMPLEMENT
Use with:
• **Order Flow Signals** → Precise signals (💎▲🚀)
• **VWAP** → Institutional price levels
• **Fair Value Gaps** → Inefficiency zones
• **Market Profile** → POC/VPOC
**CVD Simple** tells you WHEN to hold/exit
**Technical analysis** tells you WHERE to enter
⚠️ DISCLAIMER
Technical indicators are decision support tools. No indicator guarantees profits. Always use:
• Appropriate risk management
• Stop loss on every trade
• Proper position sizing
• Demo account testing first
Order Flow CVD improves your trade management but doesn't replace a complete strategy.
🚀 INSTALLATION
1. Copy the Pine Script code
2. Open Pine Editor in TradingView
3. Paste the code
4. Click "Add to Chart"
5. Indicator displays in separate pane (below)
6. Configure colors to your preferences
7. Apply golden rule: Green = LONG, Red = SHORT!
💡 PRO TIP
**CVD Discipline:**
Create this mental rule:
→ "I NEVER exit a position until zone changes color"
This simple discipline will:
✅ Multiply your gains (you hold longer)
✅ Reduce your losses (you exit when flow changes)
✅ Eliminate emotional exits
✅ Align you with institutions
📞 CONTACT AND SUPPORT
Created by Alphaomega18
For questions, bugs or suggestions:
Find my other indicators:
• Order Flow Signals (precise signals on chart)
• Order Flow Dashboard (CVD oscillator + pressures)
• VWAP Multi-Timeframe Pro
• Fair Value Gap Detector

Breakout PRO (B:Pro)Breakout PRO (B:Pro) is an invite-only, multi-filter breakout and trend suite for discretionary trading on any symbol and timeframe. It combines a custom EMA cloud, volatility and momentum filters, higher-timeframe bias, and signal quality scoring into a single framework, so there is no need to stack multiple separate indicators.
Core concept
The script builds a three-layer EMA cloud around price. The relative position of fast, mid, and slow EMAs, plus an ATR-based outer padding, defines:
Bull regime: EMAs bullishly stacked, cloud acting as dynamic support
Bear regime: EMAs bearishly stacked, cloud acting as dynamic resistance
Neutral regime: mixed or crossing EMAs, cloud fades to a neutral color
The cloud defines both the primary trend context and the breakout zones (cloud upper / cloud lower).
A higher-timeframe 200 EMA (user-defined timeframe) adds a long-term directional bias on top.
Support, resistance and structure
Last confirmed swing high and swing low are detected via pivot logic and drawn as dotted support / resistance lines.
These levels are invalidated with a small ATR buffer once price clearly breaks through.
Optional long-term EMA targets (T1 and T2, default 233 and 377) are plotted as future target lines, which can act as potential mean-reversion or trend-continuation objectives.
Filters used in entries
Long and short breakout signals are only shown when multiple, independent conditions align. Each filter can be turned on or off:
Volume: current volume vs volume SMA
MACD: line direction and histogram momentum
RSI: classic OB/OS behavior with sentiment-adjusted thresholds
Stoch RSI: K vs D direction inside valid zones
Bollinger Bands + Keltner Channels: squeeze state and BB breakouts
VWAP: price relative to intraday VWAP
ADX: minimum trend strength threshold
OBV & Ichimoku: optional extra trend confirmation layers
A dedicated Market Sentiment input (Standard, Bullish, Bearish, Consolidation) shifts RSI bands, ADX threshold, and volume requirements so the same logic adapts to different market conditions.
Signals and exits
Entry logic
Long signal: bullish EMA stack, breakout above the last pivot resistance and above the upper cloud, with all enabled long filters confirming.
Short signal: mirrored conditions below the last support pivot and below the lower cloud, with all enabled short filters confirming.
The script internally tracks trade state:
Sets an ATR-based stop level at entry, with mode-dependent ATR multipliers (Short / Mid / Long).
Applies an optional maximum trade duration (different per trade mode).
Plots exit markers when:
the ATR stop is hit
the cloud / EMA structure flips against the trade
MACD or RSI move against the position
or the time limit for the trade is exceeded
Additional icons highlight:
Strong breakouts / breakdowns with large ATR range and high volume
Squeeze releases after low-volatility phases
EMA cross events
Continuation and potential reversal zones around the cloud
Optional RSI divergence arrows based on a separate, mode-tuned RSI.
Quality and safety scoring
Every entry is evaluated on two simple scales (1–3):
Safety score (1–3): driven mainly by volume confirmation, ADX trend strength, distance from the cloud / structure, and overall trend alignment.
Quality score (1–3): reflects BB and MACD confirmation, RSI position, rough reward-to-risk context, and alignment with the selected Market Sentiment.
You can:
Show compact S/Q labels directly next to entry and exit signals.
Use the fixed signal history panel in the bottom-left corner to see the last 5 trade events (opens, closes, crosses, continuation) with their safety and quality scores.
Inputs and layout options
Key configurable inputs include:
Trade Mode: Short (e.g., 30m), Mid (e.g., 4h), Long (e.g., 1D+). This adjusts all core lengths (EMAs, ATR, divergence RSI).
Market Sentiment: Standard, Bullish, Bearish, Consolidation (dynamically retunes filters).
Per-filter toggles for Volume, MACD, RSI, Stoch RSI, BB, Ichimoku, ADX, OBV, VWAP, and HTF levels.
Panel size: Desktop, Phone, or None for the signal history panel.
Side labels: Desktop (full text labels on the price scale) or Phone (compact labels) for better chart space on smaller screens.
Usage notes
Breakout PRO is a technical analysis tool, not an automated trading system or financial advice.
Signals are calculated on closed data without intentional repainting, but values on the current bar can still evolve until the bar closes. Use this indicator as a structured way to read trend, breakout, and confluence – and combine it with your own trade plan, risk management, and testing.

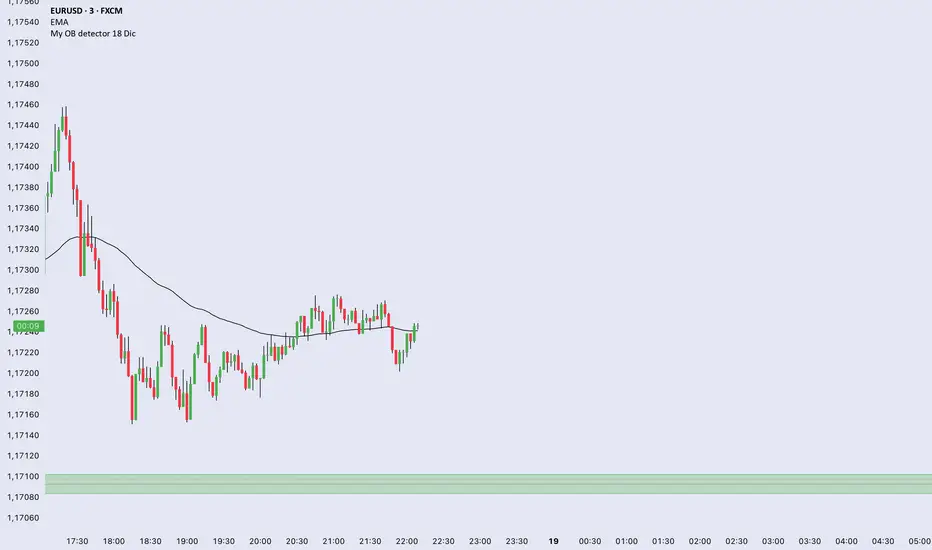
My OB detector 18 DicProfessional Order Block indicator optimized for M3 timeframe. It features automatic 50% entry detection, a strict 1:1 risk-to-reward ratio, and a 10-pip minimum profit filter. Strictly follows the Madrid session hours for Euro and US sessions.
TuxAlgo Plus a SMC and Trap Toolkit V0.98r1 by McTogaThe “TuxAlgo Plus” script is a powerful, standalone, conceptual open-source project and self-sufficient “smart money toolkit” with automatic trap detection (SMT), liquidity grabs, FVG confluence, and complete bot setup signals for TV charts in the “H1 to H6” time frame and daily charts.
The script is used to improve SMC/trap analyses, i.e., the structure and visualization logic for TradingView charts have been expanded in the “TuxAlgo++” project in line with Smart Money Concepts (SMC) and Smart Money Traps (SMT).
The SMT block (“Smart Money Traps”) supplements classic smart money concepts with:
1. Detection of bull traps (short setups) and bear traps (long setups)
2. Display of trap boxes in the chart (liquidity grab areas)
3. A bot setup box (table) with ready-made entry/SL/TP levels:
as well as age in bars & days and “Valid until ~X d” (remaining term)
SMT / bot setup only run on the following timeframes:
- H1, H2, H3, H4, H6 This means that traps, labels, and the bot setup box are only displayed on these timeframes
Trap definition “Bull Trap (Short Setup)”:
- Valid swing high
- Swing trend bullish
- High (Wick) pierces above the swing high (Liquidity Grab)
- Close falls back below the swing high (false breakout)
-> Result: Short setup (bull trap), marked in orange
Trap definition “Bear Trap (long setup)”:
- Valid swing low
- Swing trend bearish
- Low (wick) pierces below the swing low (liquidity grab)
- Close rises above the swing low again (false breakout)
-> Result: Long setup (bear trap), marked in blue
Entry / SL / TP calculation
A price range is taken for each trap:
Bull trap (short):
- Range =
- Entry = point within this range:
Entry = hiBT - (hiBT - loBT) * TrapEntryRatio (0..1)
-> 0.0 = at the Wick extreme, 0.5 = middle, 1.0 = at the Swing level
- SL = Wick extreme (upper edge of the trap)
- Risk = |Entry - SL|
- TP1 = Entry - R1 * Risk
- TP2 = Entry - R2 * Risk
Bear Trap (Long):
- Range =
- Entry analogous within the range according to TrapEntryRatio
- SL = wick bottom (lower edge of the trap)
- Risk = |Entry - SL|
- TP1 = Entry + R1 * Risk
- TP2 = Entry + R2 * Risk
R1 / R2 correspond to the inputs:
- botRR1Input = TP1 Risk/Reward (e.g., 1.5R)
- botRR2Input = TP2 Risk/Reward (e.g., 3.0R)
Age & Validity
Each trap stores:
- lastTrapBarIndex -> last bar of the trap
- Age in bars -> bar_index - lastTrapBarIndex
- Age in days (~d) -> AgeBars * BarDurationInDays (depending on TF)
Input: trapMaxAgeBars determines how long a trap is valid.
The bot setup box is only displayed if:
- a trap is present,
- AgeBars <= trapMaxAgeBars,
- SMT + Box + SMC timeframe are active.
Color logic (color blind friendly):
- Blue (accentBlue) = fresh traps (Age <= 1/3 MaxAge)
- Orange (accentOrange) = medium age
- Violet (accentPurple) = old, but still within MaxAge
- Gray (accentGray) = expired (> MaxAge)
The box also shows “Valid until ~X d” as the remaining term.
Day/Night Mode & Colors
- chart.bg_color is used to detect dark or light mode.
- Text/background colors adjust (light/dark).
- Accent colors (blue/orange/purple/gray) are suitable for red/green color blindness.
- Trap labels in the chart:
- Bull trap label = orange (short setup)
- Bear trap label = blue (long setup)
- Text color depends on chart mode (dark/light)
Typical workflow (example):
1. Select a suitable symbol & SMC timeframe (e.g., H4 or H6).
2. Wait for a bull trap (short) or bear trap (long).
3. Read in the bot setup box:
- Direction (long/short)
- Entry, SL, TP1, TP2
- Age & “Valid until ~X d”
4. These values can be used as a template for manual trading or external bot/order systems.
5. Position size & leverage must always be calculated separately in your own risk management
(e.g., 2% rule). This script does not calculate position sizes.

Sniper V53 - Forex Reactive + DashboardRSI + OBV calculation on 4 time frames for trend changes.
The indicator warns of possible trend changes; use additional confirmations for areas of interest.

Indian Market Trend
# Indian Market Trend
## **Know The Trend BEFORE It Happens - Institutional-Grade Market Intelligence**
### **🎯 Why This Indicator is Different:**
Most indicators tell you what **already happened**. This institutional-grade tool tells you what's **about to happen** by analyzing the **synchronized behavior of 40 major Indian stocks** in real-time.
***
## **📊 THREE POWERFUL ANALYSIS TABLES**
### **1️⃣ CORRELATION ANALYSIS TABLE**
- **Real-time correlation** of 40 NSE stocks with your chart symbol
- **Implied Trend Calculation** - The secret sauce that shows market direction BEFORE price confirms
- **Positive Implied Trend** = Stocks moving UP together (Bullish Confirmation)
- **Negative Implied Trend** = Stocks moving DOWN together (Bearish Warning)
- Fully customizable: Choose which stocks to analyze and table position
### **2️⃣ MARKET REGIME ANALYSIS TABLE**
Institutional-grade regime detection across **4 major market conditions:**
- **🟢 GOLDILOCKS REGIME** - Perfect growth environment (Risk-On)
- **🟡 REFLATION REGIME** - Economic recovery phase (High Beta Rally)
- **🔴 INFLATION REGIME** - Defensive rotation (Protect Capital)
- **🔵 DEFLATION REGIME** - Risk-off environment (Safe Havens)
**Each regime shows:**
- Top 5 performing equity style factors
- Bottom 5 underperforming factors
- Probability score for each regime
- **RISK ON/RISK OFF** status with real-time calculation
### **3️⃣ TOP/BOTTOM PERFORMERS TABLE**
- **Real-time ranking** of best and worst performing stocks
- Adjustable display (5-20 stocks)
- Shows relative strength vs market average
- Perfect for stock selection and sector rotation
***
## **🚀 THE EDGE: IMPLIED CORRELATION INDICATOR**
### **This is where the magic happens:**
The **Implied Correlation Plot** combines:
1. **Correlation Strength** - How stocks move together
2. **KAMA Trend Analysis** - Institutional adaptive moving average
3. **Directional Bias** - Market sentiment calculation
### **How to Read It:**
✅ **POSITIVE VALUES (Green Bars)**
- Stocks are moving UP in sync
- Strong bullish momentum
- High confidence in uptrend continuation
- **ACTION: Stay long, add on dips**
❌ **NEGATIVE VALUES (Red Bars)**
- Stocks are moving DOWN together
- Strong bearish pressure
- High confidence in downtrend continuation
- **ACTION: Reduce exposure, wait for reversal**
⚪ **NEAR ZERO (Gray Bars)**
- Market is confused/consolidating
- Low directional conviction
- Wait for clarity
- **ACTION: No new positions, tight stops**
### **The Institutional Advantage:**
When you see **strong green bars forming** → Market is building bullish pressure **BEFORE** your main chart shows a clear breakout!
When you see **strong red bars forming** → Market is building bearish pressure **BEFORE** your main chart breaks down!
**This is your early warning system!** 🎯
***
## **🎛️ FULLY CUSTOMIZABLE**
### **Table Controls:**
- ✅ Enable/Disable each table independently
- 📍 Position tables anywhere (Top/Middle/Bottom × Left/Center/Right)
- 📏 Adjustable text size for all displays
- 🎨 Clean, professional interface
### **Stock Selection:**
- **40 Pre-loaded NSE stocks** (Nifty 50 constituents)
- Fully editable - Replace ANY stock with your preferred symbols
- Works with NSE, BSE, or any exchange
- Perfect for sectoral analysis
### **Technical Parameters:**
- **Correlation Length** (Default: 14 days)
- **ROC Period** (Default: 14 days)
- **KAMA Settings** (Fast: 7, Slow: 19, ER: 8)
- **Display Options** (Number of stocks in each table)
***
## **📈 TRADING APPLICATIONS**
### **For Day Traders:**
- Early trend detection before price confirms
- Market regime identification for strategy selection
- Real-time sector rotation signals
### **For Swing Traders:**
- Multi-day trend confirmation
- Risk-on/Risk-off regime detection
- Top performer identification for swing entries
### **For Position Traders:**
- Long-term market regime analysis
- Portfolio rotation based on market conditions
- Macro trend confirmation
### **For Portfolio Managers:**
- Institutional-grade market regime framework
- 40-stock basket analysis
- Systematic rotation signals
***
## **🏆 KEY FEATURES**
✅ **40 Major Indian Stocks** - Comprehensive market coverage
✅ **3 Analysis Tables** - Correlation, Regime, Performance
✅ **Implied Correlation Plot** - Leading trend indicator
✅ **KAMA Trend Engine** - Adaptive institutional algorithm
✅ **Regime Detection** - Goldilocks/Reflation/Inflation/Deflation
✅ **Fully Customizable** - Every parameter adjustable
✅ **No Repainting** - Signals are final and reliable
✅ **Clean Interface** - Professional institutional design
✅ **Multi-Timeframe** - Works on Daily charts (recommended)
***
## **⚡ QUICK START GUIDE**
1. **Add indicator to Daily chart** of NSE:NIFTY or any Indian stock
2. **Enable all 3 tables** from "Table Controls" section (default: ON)
3. **Watch Implied Correlation plot** in indicator window:
- Green bars = Bullish strength building
- Red bars = Bearish pressure building
- Gray bars = Wait for clarity
4. **Check Market Regime Table** - Which regime has highest probability?
5. **Scan Top Performers Table** - Find strongest stocks for entries
6. **Cross-reference with your price action** - Confirm with chart patterns
***
## **🎓 INSTITUTIONAL METHODOLOGY**
This indicator uses the same frameworks employed by:
- Hedge funds for market regime detection
- Proprietary trading desks for correlation analysis
- Risk management teams for portfolio positioning
- Quantitative analysts for systematic signals
**The Normalized KAMA Oscillator** by IkkeOmar provides institutional-grade trend detection with adaptive smoothing that responds to market efficiency.
**The Implied Correlation Framework** measures market synchronization - when stocks move together with conviction, trends are more reliable and persistent.
***
## **💡 PRO TIPS**
1. **Best Results:** Use on Daily timeframe for most reliable signals
2. **Strong Signals:** Implied Correlation > 0.15 or < -0.15 = High conviction
3. **Regime Changes:** Watch for probability shifts between regimes
4. **Divergences:** If top performers weaken while index rises = Warning signal
5. **Confirmation:** Wait for 2-3 consecutive bars in same direction for stronger confidence
***
## **⚠️ RISK DISCLAIMER**
This indicator is a **decision support tool**, not financial advice. Always:
- Use proper risk management
- Combine with your own analysis
- Test on demo/paper trading first
- Never risk more than you can afford to lose
- Past performance doesn't guarantee future results
***
## **📞 SUPPORT & UPDATES**
- Regular updates with market condition changes
- Community feedback incorporated
- Bug fixes and optimizations
- Documentation and video tutorials (coming soon)
***
## **🌟 WHY TRADERS LOVE THIS INDICATOR**
✅ **"Finally see the market BEFORE it moves!"**
✅ **"Three tables give complete market picture"**
✅ **"Regime detection is game-changing"**
✅ **"Professional institutional tool for retail traders"**
✅ **"Clean, customizable, reliable"**
***
## **📊 INDICATOR SPECIFICATIONS**
- **Type:** Oscillator / Market Analysis
- **Overlay:** No (Separate pane)
- **Inputs:** 40 stock symbols + multiple parameters
- **Outputs:** 3 tables + 1 plot line
- **Repainting:** No
- **Alerts:** Compatible (can be added)
- **Multi-timeframe:** Yes (Daily recommended)
***
## **🎯 START TRADING WITH CONFIDENCE**
**Know the trend BEFORE the crowd!**
The market doesn't move in straight lines - it moves in **synchronized waves**. When you can measure that synchronization across 40 major stocks, you have an **institutional edge** that retail traders never see.
**Install now and experience the difference!** 🚀
***
**Tags:** #Indian #NSE #Nifty50 #Correlation #MarketRegime #TrendAnalysis #Institutional #KAMA #Performance #TopPerformers #RiskOn #RiskOff #Goldilocks #Reflation #ImpliedCorrelation
***
**Version:** 1.0
**Last Updated:** December 2025
**Compatible:** TradingView Pine Script v6
***
Feel free to ask questions in the comments! I actively respond to user feedback and continuously improve this indicator based on community needs.
**Happy Trading! 📈🎯**
***


Trading Levels [DEMAK]Trading Levels is a price-level indicator designed to project structured reference levels on the chart based on a mathematical model anchored to the opening price of a selected period.
The indicator automatically detects the start of a new daily, weekly, or monthly session and establishes a central reference level. From this reference point, multiple upper and lower price levels are generated using internal mathematical rules. These levels remain fixed throughout the active period and update only when a new period begins.
What the indicator displays
A primary reference level based on the opening price of the selected period.
A symmetrical upper and lower price range derived from that reference.
Optional internal subdivisions within the range, creating a structured price framework.
All levels extend forward in time until the next period begins.
Purpose and interpretation
The projected levels are intended to act as objective price references, helping traders:
Identify potential reaction zones.
Visualize price structure within the current period.
Maintain consistent context across intraday price movements.
The indicator does not attempt to predict direction. Instead, it provides static, mathematically derived levels that allow traders to interpret price behavior and make decisions using their own methodology.
Customization
Users can adjust:
The reference period (daily, weekly, or monthly).
The number of internal subdivisions.
Visual properties such as colors and line thickness.
This tool is designed for traders who prefer clean, rule-based price levels that remain stable during the session and update systematically with each new period.

Power Law of Diminishing Returns for BTC:USDTThis is a script to see if the Law of Diminshining Returns is applicable to BTC/USD

NQ vs ES-RTY-YM DivergenceNQ vs ES-RTY-YM Divergence Indicator: Complete Guide
What This Indicator Does
This indicator measures the relative performance of Nasdaq futures (NQ) compared to a composite average of other major US index futures (ES/S&P 500, RTY/Russell 2000, and YM/Dow Jones). It normalizes price data to create a clear comparison between tech-heavy Nasdaq and the broader market, helping identify sector rotation, relative strength, and potential trading opportunities.
How It Works
The indicator performs these calculations:
Data Collection: Retrieves closing prices for NQ, ES, RTY, and YM futures
Composite Creation: Averages ES, RTY, and YM to create a "broader market" composite
Normalization: Applies min-max scaling to both NQ and the composite over a lookback period (default: 20 bars)
This transforms values to a range between 0 and 1
Formula: normalized_value = (current_price - lowest_low) / (highest_high - lowest_low)
Divergence Calculation: Subtracts the normalized composite from normalized NQ
Formula: divergence = nq_normalized - composite_normalized
Result ranges from -1.0 (extreme NQ underperformance) to +1.0 (extreme NQ outperformance)
Visual Elements
The indicator displays:
Blue line: Normalized NQ performance (0-1 range)
Orange line: Normalized composite performance (0-1 range)
Histogram:
Green bars: Positive divergence (NQ outperforming composite)
Red bars: Negative divergence (NQ underperforming composite)
Zero line: Neutral reference point
Overbought/oversold lines: Customizable thresholds (default ±0.1)
Information table: Current divergence value (only in non-MTF version)
Interpreting the Indicator
Divergence Value s
Positive values (0 to +1): NQ outperforming the composite
The higher the value, the stronger the relative outperformance
Negative values (0 to -1): NQ underperforming the composite
The lower the value, the stronger the relative underperformance
Zero: Equal normalized performance between NQ and composite
Significant Levels
Crossing above bullish threshold (default +0.1): Significant tech sector strength
Crossing below bearish threshold (default -0.1): Significant tech sector weakness
Extreme readings (near ±0.3 or beyond): Potentially overextended moves that might reverse
Practical Applications
Market Analysis
Sector rotation identification: Detect shifts between tech and other sectors
Market regime analysis: Tech leadership often indicates risk-on conditions
Divergence warnings: When price trends differ from relative strength trends
Trading Approaches
Momentum trading: Enter NQ positions when divergence shows increasing strength
Mean reversion: Consider counter-trend positions at extreme readings
Confirmation tool: Use alongside price patterns and other indicators
Relative performance trading: Guide allocation between tech and broader market exposure
Customization Options
The indicator offers several parameters:
Normalization Window: Controls the lookback period for min-max calculations
Shorter (5-10): More responsive, noisier
Longer (20-50): Smoother, slower to respond
Overbought/Oversold Levels: Customize based on your threshold preferences
Tighter levels (±0.05): More frequent signals
Wider levels (±0.2): Only the most extreme divergences
Alert Thresholds: Set when you want to be notified of significant changes
These determine when alert conditions trigger
Display Options: Customize colors and visual elements
Key Considerations
The indicator normalizes data within a rolling window, so extreme readings are relative to recent history, not absolute
Works best on futures markets with liquid contracts to ensure accurate relative performance measurement
Most effective when used to complement price action analysis rather than in isolation
The zero line represents equal normalized performance, not equal price performance (due to the normalization process)
By tracking this specialized form of relative performance, the indicator provides insights into market dynamics that aren't obvious from price action alone, helping traders identify potential shifts in market leadership between technology and other sectors.

Mystic Scales Dual Energy PRO [Destiny Quant]Mystic Scales Dual Energy PRO - Destiny Quant | 【天機衡】雙向能量
English Description
Balancing Momentum and Structure. Mystic Scales Dual Energy PRO utilizes a unique split-axis design to evaluate the balance between Market Momentum (WE2) and Market Health (WH1/WH2). It ensures you only execute trades when momentum is supported by a healthy market structure.
Custom Thresholds: Fully adjustable Entry/Exit score triggers with built-in hysteresis logic to prevent whipsaws.
Structural Health: Monitors DMI flows and Volume Ratios (VR) across Daily, Weekly, and Monthly timeframes.
Strategic Confluence: The perfect companion for the Celestial Mirror to confirm high-conviction entries.
中文說明
權衡動能與結構的平衡之衡 【天機衡】雙向能量 PRO 採用獨特的雙軸分離設計,同時權衡 「市場動能 (WE2)」 與 「市場健康度 (WH1/WH2)」。它確保您只在市場結構健康的前提下發動動能交易。
自訂門檻觸發:具備可調式進場/出場分數門檻,並內建遲滯邏輯 (Hysteresis) 有效過濾頻繁洗盤。
結構健康偵測:即時監控日、週、月線級別的 DMI 流向與成交量比率 (VR)。
策略共振:作為【天機鏡】的最佳拍檔,用來確認高勝率的共振進場時機。
🚀 Get Access / 獲取授權 This is an Invite-only script. To unlock the Celestial Mirror, please:
Visit the link in my profile.
Send a direct message for subscription details.
本指標為 僅限邀請 (Invite-only)。欲獲取授權,請:
點擊我個人主頁的連結(官網/商店)。
透過 TradingView 私訊聯繫我了解訂閱詳情。

Celestial Mirror AI Score PRO - Destiny QuantCelestial Mirror AI Score PRO - Destiny Quant | 【天機鏡】AI 評分系統
English Description
The Strategic Brain of Quantitative Trading. The Celestial Mirror AI Score PRO is a multi-factor weighting engine designed by Destiny Quant Lab. It acts as a digital "Mirror," revealing the hidden truth of market quality. By integrating over 10+ quantitative factors, including the proprietary Zanger Explosion Algorithm, it provides a real-time AI Score (0-99).
Institutional Detection: Uses advanced VSA logic to track "Smart Money" footprints.
Dual Engine: Switch between "Factor Analysis" (Swing) and "Explosion" (Momentum) modes.
Quant Dashboard: Real-time monitoring of momentum, volume structure, and pivot hierarchy.
中文說明
量化交易的策略大腦 【天機鏡】AI 評分系統 PRO 是由 天機量化實驗室 開發的多因子加權引擎。它如同數位之鏡,照見市場體質的虛實。本指標結合了 10 多項量化因子與獨家 Zanger 爆發演算法,將複雜盤面轉化為 0-99 的即時評分。
機構追蹤:透過進階量價分析 (VSA) 偵測大戶資金流向。
雙模式引擎:提供適合波段的「因子分析」與捕捉飆股噴發的「爆發預測」模式。
天機數據面板:即時監測動能、量能與樞軸位置,讓數據一目了然。
🚀 Get Access / 獲取授權 This is an Invite-only script. To unlock the Celestial Mirror, please:
Visit the link in my profile.
Send a direct message for subscription details.
本指標為 僅限邀請 (Invite-only)。欲獲取授權,請:
點擊我個人主頁的連結(官網/商店)。
透過 TradingView 私訊聯繫我了解訂閱詳情。

Test此指標為測試階段
最近手法改變,高點出現率後移,
此指標為爆量後跌破12ema才放空,
由於操盤手還是可以騙線,故時間設定為10:00之後成功率比較大
This indicator is in the testing phase.
Recently, the method has changed, and the occurrence rate of high points has shifted later.
This indicator only calls for shorting after a surge in volume followed by a drop below the 12-day moving average (EMA).
Because traders can still create false signals, setting the time after 10:00 AM increases the success rate.
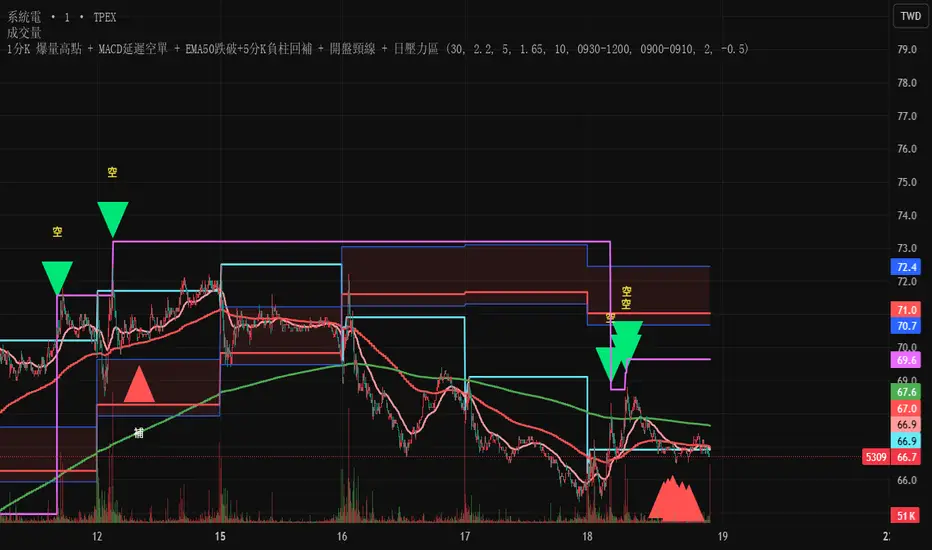
EMA12/50 如果放空後趨勢由背景紅轉綠可以考慮常抱
抱到背景再次翻紅而比較不被雜訊洗掉
現階段指標合併在一起會出BUG
If the trend changes from red to green after shorting, consider holding for a longer period.
Hold until the background turns red again to avoid being washed out by noise.
Currently, merging them together will cause bugs.

Minervini Scanner [MarketSmith RS] (up to 40 tickers)"Find the Leaders. Ignore the Laggards."
This dashboard is a complete Trend & Momentum Command Center designed to replicate the manual screening process of top growth traders like Mark Minervini and William O'Neil. It scans up to 40 tickers simultaneously to identify "Stage 2" super-performance candidates while filtering out broken trends and "zombie" stocks.
Core Features
1. The "Trend Template" Engine The scanner automatically checks every ticker against 7 strict trend criteria to verify a healthy Stage 2 Uptrend:
Price > 150-Day & 200-Day Moving Averages.
150-Day MA > 200-Day MA.
200-Day MA is Trending Up (at least 1 month).
50-Day MA > 150-Day & 200-Day MAs.
Price > 50-Day MA (Momentum Check).
Price > 25% above 52-Week Low.
Price within 25% of 52-Week High.
2. Institutional RS Rating (0-99) Unlike standard "Relative Strength" indicators that just compare price to SPY, this script uses the IBD/MarketSmith Methodology:
Weighted Performance: It calculates a composite score based on price performance over the last 12 months, with a heavy 40% weight on the most recent quarter.
Percentile Proxy: It maps this weighted score to a 1-99 rating scale using fixed constants derived from historical market leader data.
90-99 (Blue): Market Leaders (Top 10%).
80-89 (Green): Institutional Candidates.
< 70 (Red): Laggards.
How to Read the Dashboard
STAGE 2 (Lime Green): The "Holy Grail" signal. The stock meets 7/7 trend criteria. It is fundamentally sound and ready for a setup (like a VCP).
SETTING UP (Yellow): Score 5/7 or 6/7. The trend is developing but not perfect (e.g., 200MA might still be flat). Watch for improvements.
AVOID (Maroon): Broken trend. Moving averages are stacked downward. Do not trade long.
RS Rating: Look for the "Power Combo": A STAGE 2 trend status combined with an RS Rating of 80+. This indicates the stock is not only going up but is outperforming the vast majority of the market.
Settings & Customization
40-Ticker Watchlist: Monitor your entire focus list in one panel.
Adjustable Constants: You can fine-tune the RS Rating thresholds (p99, p90) to adapt to Bull or Bear market volatility.
MA Type: Switch between SMA (Simple) and EMA (Exponential) moving averages.
Disclaimer: This tool provides technical analysis data, not financial advice. Always manage risk.

Liquidity Structure Screener [Z-Score Sniper] "Stop guessing where value is. Start seeing the structure."
This indicator is an institutional-grade screener designed to visualize Liquidity Structure across up to 30 tickers simultaneously. It moves beyond standard support and resistance by using Auto-Anchored VWAPs and Volume Nodes to identify exactly where "Smart Money" is defending, trapped, or exhausted.
Core Concepts
This screener builds a dynamic "Liquidity Geometry" for every ticker on your watchlist based on the last 60 days (adjustable) of price action:
The "Whale" Level: Automatically detects the single highest-volume day in the lookback period and anchors a VWAP from that exact candle. This is the "Line in the Sand" for the market's biggest participant.
Market Structure Anchors:
Shorts (High Anchor): VWAP anchored from the highest high. Represents the average entry of short sellers (Resistance).
Longs (Low Anchor): VWAP anchored from the lowest low. Represents the average entry of buyers (Support).
Z-Score Sniper: Calculates how far price has stretched from the Short Anchor using ATR-normalized Standard Deviations. This detects extreme "rubber band" extensions for mean reversion plays.
How to Read the Signals
The screener processes this complex data into a simple SIGNAL column with actionable color-coded states:
🔵 DEFENSE LONG (The Fortress): Price is in the "Whale Zone" or "Squeeze" AND holding near the Long Anchor support (within 5% buffer). This indicates relative strength and active institutional defense.
🟢 BUY RETEST: Price has broken out above the Short Anchor (Resistance) and is dipping back to retest it. A classic "Resistance-to-Support Flip" entry.
🟠 COIL (The Pinch): Volatility is dead. Price is trapped tightly between the Whale Level and the Short Anchor (< 0.5% distance). A massive expansion move is imminent.
🟣 OVERSOLD: Price is in a breakdown but has stretched to an extreme statistical deviation (Z-Score < -3.0σ). Sellers are exhausted, signaling a potential "Dead Cat Bounce" or reversal.
🔴 AVOID: Structure is broken (below Long Anchor) with no statistical exhaustion. The floor is gone—do not catch the falling knife.
Key Features
30-Ticker Watchlist: Monitor your entire portfolio in one panel.
Smart Deduplication: Automatically cleans duplicate tickers from your inputs.
Customizable Lookback: Adjust the "Anchor Memory" to fit your trading style (Swing vs. Position).
Visual Heatmap: Color-coded zones for instant readability of market health.
Disclaimer: This tool provides structural analysis, not financial advice. Always use proper risk management.

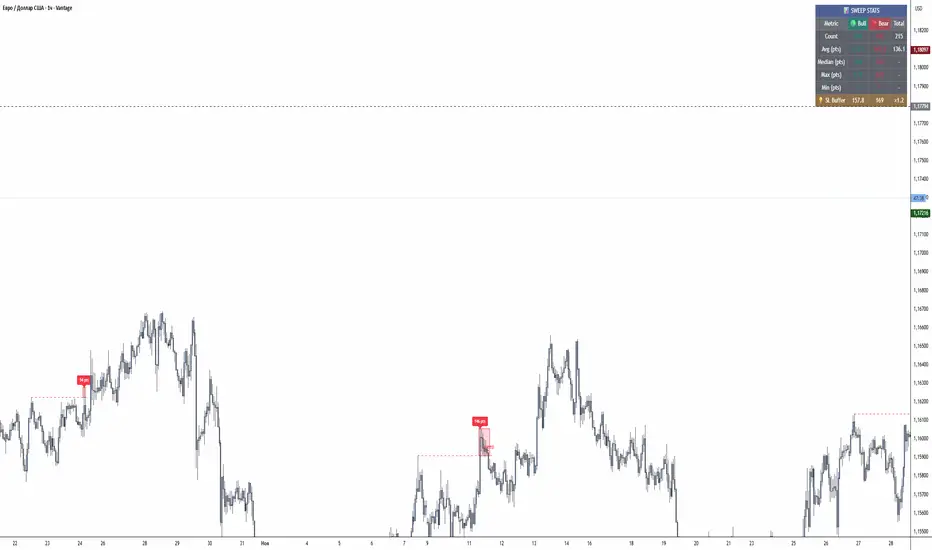
Sweep AnalyzerA comprehensive liquidity sweep detection indicator that identifies false breakouts (sweeps) of swing highs and lows, measures their depth, and provides statistical analysis to help optimize stop-loss placement.
🎯 Overview
This indicator is designed for traders who use Smart Money Concepts (SMC), ICT methodology, or price action strategies. It automatically detects when price “sweeps” (falsely breaks) key swing levels and returns back, which often indicates liquidity grabs by institutional traders.
The unique feature of this indicator is its ability to measure the depth of each sweep in points/pips and calculate statistics, helping you understand how far price typically goes beyond levels before reversing. This data is invaluable for setting optimal stop-loss distances.
⚙️ Features & Settings Explained
Settings Group
Cooldown Period (bars) — Minimum number of bars between sweep signals. Prevents multiple signals in the same area. Default: 10
Show Statistics Table — Toggle the statistics panel on/off
Table Position — Choose corner placement: Top Left, Top Right, Bottom Left, Bottom Right
Table Size — Small, Normal, or Large text size for the table
Pivot Settings
Pivot Left Bars — Number of bars to the left required to confirm a swing point. Higher values identify more significant levels. Default: 20
Pivot Right Bars — Number of bars to the right required to confirm a swing point. Default: 20
How it works: A swing high is confirmed when the high is higher than all bars within the left AND right lookback period. Same logic applies for swing lows (lowest of the range).
Sweep Detection
Sweep Lookback (bars ) — How far back to look for valid swing levels to sweep. Default: 100
Strict Mode (original logic) — When enabled, uses the original SFP (Swing Failure Pattern) detection which requires specific candle patterns. When disabled, uses enhanced detection that tracks multi-bar sweeps.
Enhanced Mode (Strict Mode OFF):
→ Detects sweeps that develop over multiple bars
→ Price can stay beyond the level for several candles
→ Tracks the deepest point reached during the sweep
→ More flexible and catches more setups
Strict Mode (ON):
→ Classic SFP detection
→ Requires price to sweep and close back in one move
→ More conservative, fewer but higher-quality signals
Sweep Filters
Max Bars in Sweep — Maximum bars price can stay beyond the level. If exceeded, it’s considered a breakout, not a sweep. Default: 10
Max Sweep Depth (ATR multiplier) — Maximum sweep depth as ATR multiple. Sweeps deeper than this are filtered out as breakouts. Default: 3.0
ATR Length — Period for ATR calculation used in filters. Default: 14
If price goes too deep beyond a level or stays there too long, it’s likely a real breakout, not a liquidity sweep. These filters prevent false signals during trending markets.
Sweep Confirmation
Confirmation Bars — How many consecutive bars price must close back beyond the level to confirm the sweep. Default: 2
Min Return Depth (ATR mult) — Minimum distance price must return beyond the level (as ATR multiple) to count as valid return. Default: 0.3
📊 Statistics Table
The table displays real-time statistics for all detected sweeps:
Count — Total number of sweeps detected (Bull/Bear/Total)
Avg (pts) — Average sweep depth in points. This is the key metric for SL placement
Median (pts) — Median sweep depth, useful when you have outliers
Max (pts) — Deepest sweep recorded
Min (pts) — Shallowest sweep recorded
SL Buffer — Suggested stop-loss distance (Average × 1.2)
⚠️ Important Notes
Point Calculation: The indicator automatically detects instrument type. For Forex with 5 decimals it displays in pipettes (multiply by 0.1 for pips). For Forex with 4 decimals it displays in pips. For other instruments it displays in points.
Historical Data: Statistics are calculated from all visible chart data. Scroll left to include more history for better averages.
Timeframe Matters: Sweep characteristics vary by timeframe. Run the indicator separately on each TF you trade.
Not Financial Advice: This indicator is a tool for analysis. Always combine with other confluence factors and proper risk management.
🔔 Alerts
Two alert conditions are available:
→ Bullish Sweep: Triggers when a bullish sweep is confirmed
→ Bearish Sweep: Triggers when a bearish sweep is confirmed
Set up alerts via TradingView’s alert menu for real-time notifications.
💡 Pro Tips
→ Start with defaults and adjust based on your instrument/timeframe
→ Increase Pivot bars (25-30) for higher timeframes to catch more significant levels
→ Decrease Max Bars in Sweep (5-7) for scalping to filter slow moves
→ Use Strict Mode if you want fewer but more reliable signals
→ Compare median vs average — if very different, you have outliers affecting your SL calculation
--------------------------------------------------------------------------------
Комплексный индикатор для определения свипов ликвидности (ложных пробоев) свинг-хаев и свинг-лоу. Измеряет глубину каждого свипа и предоставляет статистический анализ для оптимизации размещения стоп-лоссов.
🎯 Обзор
Индикатор разработан для трейдеров, использующих концепции Smart Money (SMC), методологию ICT или стратегии Price Action. Он автоматически определяет моменты, когда цена “свипает” (ложно пробивает) ключевые свинг-уровни и возвращается обратно, что часто указывает на сбор ликвидности институциональными игроками.
Уникальная особенность индикатора — измерение глубины каждого свипа в пунктах/пипсах и расчёт статистики. Это помогает понять, как далеко цена обычно заходит за уровень перед разворотом. Эти данные бесценны для установки оптимального расстояния стоп-лосса.
⚙️ Описание функций и настроек
Основные настройки (Settings)
Strict Mode — Включает строгий режим с оригинальной логикой SFP. При выключении используется расширенное определение многобаровых свипов.
Cooldown Period (bars) — Минимальное количество баров между сигналами свипа. Предотвращает множественные сигналы в одной области. По умолчанию: 10
Show Statistics Table — Включить/выключить панель статистики
Table Position — Выбор угла размещения: Top Left, Top Right, Bottom Left, Bottom Right
Table Size — Размер текста таблицы: Small, Normal, Large
Настройки пивотов (Pivot Settings)
Pivot Left Bars — Количество баров слева, необходимое для подтверждения свинг-точки. Большие значения определяют более значимые уровни. По умолчанию: 20
Pivot Right Bars — Количество баров справа, необходимое для подтверждения свинг-точки. По умолчанию: 20
Как работает: Свинг-хай подтверждается, когда максимум свечи выше всех баров в пределах левого И правого периода просмотра. Та же логика применяется для свинг-лоу (минимум диапазона).
Определение свипа (Sweep Detection)
Sweep Lookback (bars) — Как далеко назад искать валидные свинг-уровни для свипа. По умолчанию: 100
Расширенный режим (Strict Mode ВЫКЛ):
→ Определяет свипы, развивающиеся на нескольких барах
→ Цена может оставаться за уровнем несколько свечей
→ Отслеживает самую глубокую точку во время свипа
→ Более гибкий, ловит больше сетапов
Строгий режим (Strict Mode ВКЛ):
→ Классическое определение SFP
→ Требует свип и закрытие обратно за один бар
→ Более консервативный, меньше но более качественных сигналов
Фильтры свипа (Sweep Filters)
Max Bars in Sweep — Максимальное количество баров, которое цена может находиться за уровнем. При превышении считается пробоем, а не свипом. По умолчанию: 10
Max Sweep Depth (ATR multiplier) — Максимальная глубина свипа как множитель ATR. Свипы глубже этого значения фильтруются как пробои. По умолчанию: 3.0
ATR Length — Период для расчёта ATR, используемого в фильтрах. По умолчанию: 14
Если цена заходит слишком глубоко за уровень или остаётся там слишком долго, это скорее всего реальный пробой, а не свип ликвидности. Эти фильтры предотвращают ложные сигналы на трендовых рынках.
Подтверждение свипа (Sweep Confirmation)
Confirmation Bars — Сколько баров подряд цена должна закрываться обратно за уровнем для подтверждения свипа. По умолчанию: 2
Min Return Depth (ATR mult) — Минимальное расстояние, на которое цена должна вернуться за уровень (как множитель ATR), чтобы считаться валидным возвратом. По умолчанию: 0.3
📊 Таблица статистики
Таблица отображает статистику в реальном времени для всех обнаруженных свипов:
Count — Общее количество свипов (Bull/Bear/Total)
Avg (pts) — Средняя глубина свипа в пунктах. Ключевая метрика для размещения SL
Median (pts) — Медианная глубина свипа, полезна при наличии выбросов (аномальное значение, сильно отличающееся от остальных.)
Max (pts) — Самый глубокий свип
Min (pts) — Самый мелкий свип
SL Buffer — Рекомендуемое расстояние стоп-лосса (Среднее × 1.2)
⚠️ Важные замечания
Расчёт пунктов: Индикатор автоматически определяет тип инструмента. Для Forex с 5 знаками отображает в пипетках (умножьте на 0.1 для пипсов). Для Forex с 4 знаками отображает в пипсах. Для других инструментов отображает в пунктах.
Исторические данные : Статистика рассчитывается по всем видимым данным графика. Прокрутите влево, чтобы включить больше истории для лучших средних значений.
Таймфрейм важен: Характеристики свипов различаются на разных таймфреймах. Запускайте индикатор отдельно на каждом ТФ, который торгуете.
Не является финансовой рекомендацией: Этот индикатор — инструмент для анализа. Всегда комбинируйте с другими факторами подтверждения и правильным управлением рисками.
🔔 Алерты
Доступны два условия для алертов:
→ Bullish Sweep: Срабатывает при подтверждении бычьего свипа
→ Bearish Sweep: Срабатывает при подтверждении медвежьего свипа
💡 Советы
→ Начните с настроек по умолчанию и корректируйте под ваш инструмент/таймфрейм
→ Увеличьте Pivot bars (25-30) для старших таймфреймов, чтобы ловить более значимые уровни
→ Уменьшите Max Bars in Sweep (5-7) для скальпинга, чтобы фильтровать медленные движения
→ Используйте Strict Mode если хотите меньше, но более надёжных сигналов
→ Сравнивайте медиану и среднее — если сильно отличаются, у вас есть выбросы, влияющие на расчёт SL
MR.Mix Market Context
MR.Mix هو نظام تحليل سياقي مبني على الجلسات، تم تطويره لدعم منهجية تداول خاصة تحمل نفس الاسم (MR.Mix).
لا يُعد هذا المؤشر دمجًا لمؤشرات مستقلة، بل إطارًا تحليليًا واحدًا يتم فيه تنسيق عدة مكوّنات داخلية للعمل معًا وفق منطق موحّد يعتمد على بنية الجلسات، سلوك السعر، واستجابة الزخم.
يعمل المؤشر كأداة تحليلية مساعدة للاستراتيجية، حيث يركّز على قراءة سياق السوق وتأكيد الحالات التي تعتمد عليها المنهجية، دون توليد إشارات تداول مباشرة أو وعود أداء.
الوظائف الرئيسية:
• تحديد افتتاح جلسة نيويورك ورسم مستويات مرجعية مشتقة من الجلسة
• تصور نطاق ما قبل الافتتاح مع تتبع القمم والقيعان بشكل تراكمي
• عرض هياكل RSI والفوليوم مدمجة داخل الشارت ومقاسة نسبةً إلى النطاق السعري الظاهر
• متوسط متحرك EMA مع خيارات تنعيم تكيفية ونطاقات تذبذب اختيارية
• جميع العناصر البصرية تُعرض بناءً على شروط سياقية وليست مرسومة بشكل ثابت
تمت حماية كود المؤشر لاعتماده على تنسيق داخلي خاص بين توقيت الجلسات، التحجيم التكيفي، ومنطق العرض الشرطي، وهو تصميم لا يمكن إعادة إنتاجه بدقة باستخدام مؤشرات Pine المفتوحة دون كشف البنية الداخلية.
شرح العناصر على الرسم البياني:
• الخطوط الأفقية تمثل مستويات مرجعية مشتقة من الجلسات
• الخطوط العمودية تشير إلى انتقالات الجلسات
• المناطق المظللة توضح نطاقات ما قبل الافتتاح
• صناديق RSI والفوليوم المدمجة تعكس الزخم والمشاركة ضمن النطاق السعري الظاهر فقط
────────────────────────────────
MR.Mix is a session-based market context system developed to support a proprietary trading methodology under the same name (MR.Mix).
This script is not a compilation of standalone indicators. It is a unified analytical framework where multiple internal components are coordinated to operate under a single logic focused on session structure, price behavior, and momentum response.
The indicator functions as a supportive analytical tool for the methodology by providing market context and condition confirmation, without generating direct trading signals or performance claims.
Key features:
• New York session open detection with session-derived reference levels
• Pre-market range visualization with cumulative high/low tracking
• Embedded RSI and Volume structures rendered directly on the price chart and scaled relative to the visible price range
• EMA with optional adaptive smoothing and volatility bands
• All visual elements are condition-driven and context-aware rather than continuously plotted
The script is protected because it relies on proprietary coordination between session timing, adaptive scaling, and conditional rendering logic that cannot be accurately replicated using standard open-source Pine indicators without exposing internal structure.
Chart elements:
• Horizontal lines represent session-derived reference prices
• Vertical lines mark session transitions
• Shaded areas define pre-market price boundaries
• Embedded RSI and Volume boxes reflect momentum and participation within the visible range only

MR.MixMarket Context
MR.Mix هو نظام تحليل سياقي مبني على الجلسات، تم تطويره لدعم منهجية تداول خاصة تحمل نفس الاسم (MR.Mix).
لا يُعد هذا المؤشر دمجًا لمؤشرات مستقلة، بل إطارًا تحليليًا واحدًا يتم فيه تنسيق عدة مكوّنات داخلية للعمل معًا وفق منطق موحّد يعتمد على بنية الجلسات، سلوك السعر، واستجابة الزخم.
يعمل المؤشر كأداة تحليلية مساعدة للاستراتيجية، حيث يركّز على قراءة سياق السوق وتأكيد الحالات التي تعتمد عليها المنهجية، دون توليد إشارات تداول مباشرة أو وعود أداء.
الوظائف الرئيسية:
• تحديد افتتاح جلسة نيويورك ورسم مستويات مرجعية مشتقة من الجلسة
• تصور نطاق ما قبل الافتتاح مع تتبع القمم والقيعان بشكل تراكمي
• عرض هياكل RSI والفوليوم مدمجة داخل الشارت ومقاسة نسبةً إلى النطاق السعري الظاهر
• متوسط متحرك EMA مع خيارات تنعيم تكيفية ونطاقات تذبذب اختيارية
• جميع العناصر البصرية تُعرض بناءً على شروط سياقية وليست مرسومة بشكل ثابت
تمت حماية كود المؤشر لاعتماده على تنسيق داخلي خاص بين توقيت الجلسات، التحجيم التكيفي، ومنطق العرض الشرطي، وهو تصميم لا يمكن إعادة إنتاجه بدقة باستخدام مؤشرات Pine المفتوحة دون كشف البنية الداخلية.
شرح العناصر على الرسم البياني:
• الخطوط الأفقية تمثل مستويات مرجعية مشتقة من الجلسات
• الخطوط العمودية تشير إلى انتقالات الجلسات
• المناطق المظللة توضح نطاقات ما قبل الافتتاح
• صناديق RSI والفوليوم المدمجة تعكس الزخم والمشاركة ضمن النطاق السعري الظاهر فقط
────────────────────────────────
MR.Mix is a session-based market context system developed to support a proprietary trading methodology under the same name (MR.Mix).
This script is not a compilation of standalone indicators. It is a unified analytical framework where multiple internal components are coordinated to operate under a single logic focused on session structure, price behavior, and momentum response.
The indicator functions as a supportive analytical tool for the methodology by providing market context and condition confirmation, without generating direct trading signals or performance claims.
Key features:
• New York session open detection with session-derived reference levels
• Pre-market range visualization with cumulative high/low tracking
• Embedded RSI and Volume structures rendered directly on the price chart and scaled relative to the visible price range
• EMA with optional adaptive smoothing and volatility bands
• All visual elements are condition-driven and context-aware rather than continuously plotted
The script is protected because it relies on proprietary coordination between session timing, adaptive scaling, and conditional rendering logic that cannot be accurately replicated using standard open-source Pine indicators without exposing internal structure.
Chart elements:
• Horizontal lines represent session-derived reference prices
• Vertical lines mark session transitions
• Shaded areas define pre-market price boundaries
• Embedded RSI and Volume boxes reflect momentum and participation within the visible range only

SIDD EMA RSI Supertrend Signal Table🔥 SIDD EMA RSI SuperTrend Multi-Timeframe Signal Table
**SIDD EMA RSI SuperTrend Signal Table** is a **clean, powerful multi-timeframe trend confirmation dashboard** designed for traders who want **clarity, confluence, and speed** — all in one glance.
This indicator **does NOT repaint** and uses **industry-standard trend logic** combining **EMA structure, RSI momentum, and SuperTrend direction** across **6 different timeframes**.
---
## 🧠 Core Logic Behind the Indicator
This script works on **three independent trend engines**, displayed together in a compact table:
### ✅ 1️⃣ EMA Trend (Structure Based)
* Uses **EMA 50 vs EMA 200**
* **Bullish** → EMA 50 above EMA 200
* **Bearish** → EMA 50 below EMA 200
* Captures **primary market structure**
### ✅ 2️⃣ RSI Trend (Momentum Based)
* RSI Length: **14**
* **Bullish** → RSI > **55**
* **Bearish** → RSI ≤ **55**
* Helps confirm **trend strength & momentum**
### ✅ 3️⃣ SuperTrend (Price Action Based)
* ATR Length: **10**
* Factor: **3.0**
* Clearly defines **trend direction & trailing bias**
* Excellent for **entry & exit alignment**
---
## ⏱️ Multi-Timeframe Coverage
The table analyzes trends across **6 configurable timeframes**:
* Intraday → **5m, 15m, 1H**
* Swing → **4H, Daily**
* Positional → **Weekly**
Each timeframe shows:
* 📈 EMA Trend
* 📊 RSI Trend
* 🔁 SuperTrend Direction
Color-coded for instant readability:
* 🟢 Bullish
* 🔴 Bearish
* ⚪ Neutral
---
## 🎯 How to Use This Indicator
✔ **Trend Trading**
Trade only when **EMA + RSI + SuperTrend align** across higher & lower timeframes.
✔ **Intraday Confirmation**
Use higher TF (1H / 4H) bias and take entries on lower TF.
✔ **Avoid Chop & False Signals**
If signals are mixed → market is likely **sideways or risky**.
✔ **Swing & Positional Trades**
Daily + Weekly alignment gives **high-probability setups**.
---
## ⚙️ Customization Options
* Adjustable **timeframes**
* Table **position** (Top/Bottom – Left/Right)
* Table **size** (Extra Small / Small / Normal)
* Custom **colors, borders & text**
* Optimized for **minimal chart clutter**
---
## ⚠️ Disclaimer
This indicator is a **trend confirmation & decision-support tool**.
Always combine with **price action, support/resistance, and proper risk management**.

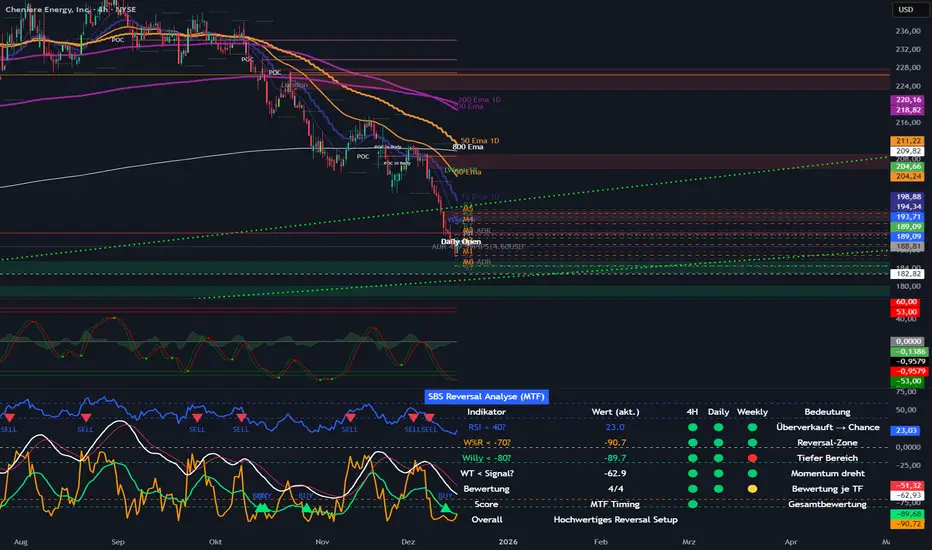
SBS Reversal Engine MTFSBS Reversal Engine (MTF) is a professional multi-timeframe indicator designed to identify high-quality reversal zones across stocks, crypto, and indices.
It combines RSI, Williams %R, a smoothed Williams oscillator ("Willy"), and a proprietary WaveTrend momentum filter to evaluate market conditions across 4H, Daily, and Weekly timeframes.
A visual traffic-light system provides a clear overview of oversold conditions, momentum shifts, and multi-timeframe alignment.
The integrated MTF Score System helps traders focus on high-quality setups where market structure, context, and timing align.
This indicator is an analytical tool and does not constitute financial advice.
© Step Buy Step 2025 – All rights reserved
All-in-One Momentum Composite The Four Components (and Why They're Chosen)
RSI (Relative Strength Index) – Classic overbought/oversold oscillator (14-period default). Measures speed and change of price movements.
Stochastic (%D line) – Smoothened momentum indicator that compares closing price to the price range over a period. Excellent at spotting reversals in ranging markets.
WaveTrend – Very popular in crypto and forex communities (originally by LazyBear). It’s essentially a momentum oscillator based on overbought/oversold channels, similar to a faster, smoother RSI/Stochastic hybrid. Known for early divergence signals and clean crossovers.
MACD Histogram – Captures momentum changes and trend strength via the difference between fast and slow EMAs. The histogram shows acceleration/deceleration.
