Mag 8 ± VWAP AlertI have been following Mag 7 plus Avgo for directional indicators for overall market. This is a chart that displays those over or under vwap and alerts can be added, ie 4 of 8 are under vwap, etc. Pine Script®指標由Jones516提供5
Combined JADEVO-ATR VIX AdaptiveCombined JADEVO-ATR VIX Adaptive is a next-generation volatility-aware trading engine that merges the precision of the JADEVO framework with the adaptive power of ATR and VIX-based volatility modeling. Built for scalpers, intraday traders, and advanced algorithmic systems, this tool dynamically adjusts its sensitivity, key levels, and trade signals based on real-time market expansion and contraction. By combining ATR-driven structure mapping, VIX-influenced volatility filters, and the JADEVO decision core, this indicator identifies high-probability zones, adaptive entry signals, and intelligent profit-taking levels—while filtering out low-quality chop that destroys most scalping systems.Pine Script®指標由Just_Trades_13提供21
Quantum Market Analyzer X7Quantum Market Analyzer X7 - Complete Study Guide Table of Contents 1. Overview 2. Indicator Components 3. Signal Interpretation 4. Live Market Analysis Guide 5. Best Practices 6. Limitations and Considerations 7. Risk Disclaimer ________________________________________ Overview The Quantum Market Analyzer X7 is a comprehensive multi-timeframe technical analysis indicator that combines traditional and modern analytical methods. It aggregates signals from multiple technical indicators across seven key analysis categories to provide traders with a consolidated view of market sentiment and potential trading opportunities. Key Features: • Multi-Indicator Analysis: Combines 20+ technical indicators • Real-Time Dashboard: Professional interface with customizable display • Signal Aggregation: Weighted scoring system for overall market sentiment • Advanced Analytics: Includes Order Block detection, Supertrend, and Volume analysis • Visual Progress Indicators: Easy-to-read progress bars for signal strength ________________________________________ Indicator Components 1. Oscillators Section Purpose: Identifies overbought/oversold conditions and momentum changes Included Indicators: • RSI (14): Relative Strength Index - momentum oscillator • Stochastic (14): Compares closing price to price range • CCI (20): Commodity Channel Index - cycle identification • Williams %R (14): Momentum indicator similar to Stochastic • MACD (12,26,9): Moving Average Convergence Divergence • Momentum (10): Rate of price change • ROC (9): Rate of Change • Bollinger Bands (20,2): Volatility-based indicator Signal Interpretation: • Strong Buy (6+ points): Multiple oscillators indicate oversold conditions • Buy (2-5 points): Moderate bullish momentum • Neutral (-1 to 1 points): Balanced conditions • Sell (-2 to -5 points): Moderate bearish momentum • Strong Sell (-6+ points): Multiple oscillators indicate overbought conditions 2. Moving Averages Section Purpose: Determines trend direction and strength Included Indicators: • SMA: 10, 20, 50, 100, 200 periods • EMA: 10, 20, 50 periods Signal Logic: • Price >2% above MA = Strong Buy (+2) • Price above MA = Buy (+1) • Price below MA = Sell (-1) • Price >2% below MA = Strong Sell (-2) Signal Interpretation: • Strong Buy (6+ points): Price well above multiple MAs, strong uptrend • Buy (2-5 points): Price above most MAs, bullish trend • Neutral (-1 to 1 points): Mixed MA signals, consolidation • Sell (-2 to -5 points): Price below most MAs, bearish trend • Strong Sell (-6+ points): Price well below multiple MAs, strong downtrend 3. Order Block Analysis Purpose: Identifies institutional support/resistance levels and breakouts How It Works: • Detects historical levels where large orders were placed • Monitors price behavior around these levels • Identifies breakouts from established order blocks Signal Types: • BULLISH BRK (+2): Breakout above resistance order block • BEARISH BRK (-2): Breakdown below support order block • ABOVE SUP (+1): Price holding above support • BELOW RES (-1): Price rejected at resistance • NEUTRAL (0): No significant order block interaction 4. Supertrend Analysis Purpose: Trend following indicator based on Average True Range Parameters: • ATR Period: 10 (default) • ATR Multiplier: 6.0 (default) Signal Types: • BULLISH (+2): Price above Supertrend line • BEARISH (-2): Price below Supertrend line • NEUTRAL (0): Transition period 5. Trendline/Channel Analysis Purpose: Identifies trend channels and breakout patterns Components: • Dynamic trendline calculation using pivot points • Channel width based on historical volatility • Breakout detection algorithm Signal Types: • UPPER BRK (+2): Breakout above upper channel • LOWER BRK (-2): Breakdown below lower channel • ABOVE MID (+1): Price above channel midline • BELOW MID (-1): Price below channel midline 6. Volume Analysis Purpose: Confirms price movements with volume data Components: • Volume spikes detection • On Balance Volume (OBV) • Volume Price Trend (VPT) • Money Flow Index (MFI) • Accumulation/Distribution Line Signal Calculation: Multiple volume indicators are combined to determine institutional activity and confirm price movements. ________________________________________ Signal Interpretation Overall Summary Signals The indicator aggregates all component signals into an overall market sentiment: Signal Score Range Interpretation Action STRONG BUY 10+ Overwhelming bullish consensus Consider long positions BUY 4-9 Moderate to strong bullish bias Look for long opportunities NEUTRAL -3 to 3 Mixed signals, consolidation Wait for clearer direction SELL -4 to -9 Moderate to strong bearish bias Look for short opportunities STRONG SELL -10+ Overwhelming bearish consensus Consider short positions Progress Bar Interpretation • Filled bars indicate signal strength • Green bars: Bullish signals • Red bars: Bearish signals • More filled bars = stronger conviction ________________________________________ Live Market Analysis Guide Step 1: Initial Assessment 1. Check Overall Summary: Start with the main signal 2. Verify with Component Analysis: Ensure signals align 3. Look for Divergences: Identify conflicting signals Step 2: Timeframe Analysis 1. Set Appropriate Timeframe: Use 1H for intraday, 4H/1D for swing trading 2. Multi-Timeframe Confirmation: Check higher timeframes for trend context 3. Entry Timing: Use lower timeframes for precise entry points Step 3: Signal Confirmation Process. For Buy Signals: 1. Oscillators: Look for oversold conditions (RSI <30, Stoch <20) 2. Moving Averages: Price should be above key MAs 3. Order Blocks: Confirm bounce from support levels 4. Volume: Check for accumulation patterns 5. Supertrend: Ensure bullish trend alignment. For Sell Signals: 1. Oscillators: Look for overbought conditions (RSI >70, Stoch >80) 2. Moving Averages: Price should be below key MAs 3. Order Blocks: Confirm rejection at resistance levels 4. Volume: Check for distribution patterns 5. Supertrend: Ensure bearish trend alignment. Step 4: Risk Management Integration 1. Signal Strength Assessment: Stronger signals = larger position size 2. Stop Loss Placement: Use Order Block levels for stops 3. Take Profit Targets: Based on channel analysis and resistance levels 4. Position Sizing: Adjust based on signal confidence ________________________________________ Best Practices Entry Strategies 1. High Conviction Entries: Wait for STRONG BUY/SELL signals 2. Confluence Trading: Look for multiple components aligning 3. Breakout Trading: Use Order Block and Trendline breakouts 4. Trend Following: Align with Supertrend direction. Risk Management 1. Never Risk More Than 2% Per Trade: Regardless of signal strength 2. Use Stop Losses: Place at invalidation levels 3. Scale Positions: Stronger signals warrant larger (but still controlled) positions 4. Diversification: Don't rely solely on one indicator. Market Conditions 1. Trending Markets: Focus on Supertrend and MA signals 2. Range-Bound Markets: Emphasize Oscillator and Order Block signals 3. High Volatility: Reduce position sizes, widen stops 4. Low Volume: Be cautious of breakout signals. Common Mistakes to Avoid 1. Signal Chasing: Don't enter after signals have already moved significantly 2. Ignoring Context: Consider overall market conditions 3. Overtrading: Wait for high-quality setups 4. Poor Risk Management: Always use appropriate position sizing ________________________________________ Limitations and Considerations Technical Limitations 1. Lagging Nature: All technical indicators are based on historical data 2. False Signals: No indicator is 100% accurate 3. Market Regime Changes: Indicators may perform differently in various market conditions 4. Whipsaws: Possible in choppy, sideways markets. Optimal Use Cases 1. Trending Markets: Performs best in clear trending environments 2. Medium to High Volatility: Requires sufficient price movement for signals 3. Liquid Markets: Works best with adequate volume and tight spreads 4. Multiple Timeframe Analysis: Most effective when used across different timeframes. When to Use Caution 1. Major News Events: Fundamental analysis may override technical signals 2. Market Opens/Closes: Higher volatility can create false signals 3. Low Volume Periods: Signals may be less reliable 4. Holiday Trading: Reduced participation affects signal quality ________________________________________ Risk Disclaimer IMPORTANT LEGAL DISCLAIMER FROM aiTrendview WARNING: TRADING INVOLVES SUBSTANTIAL RISK OF LOSS This Quantum Market Analyzer X7 indicator ("the Indicator") is provided for educational and informational purposes only. By using this indicator, you acknowledge and agree to the following terms: No Investment Advice • The Indicator does NOT constitute investment advice, financial advice, or trading recommendations • All signals generated are based on historical price data and mathematical calculations • Past performance does not guarantee future results • No representation is made that any account will achieve profits or losses similar to those shown. Risk Acknowledgment • TRADING CARRIES SUBSTANTIAL RISK: You may lose some or all of your invested capital • LEVERAGE AMPLIFIES RISK: Margin trading can result in losses exceeding your initial investment • MARKET VOLATILITY: Financial markets are inherently unpredictable and volatile • TECHNICAL ANALYSIS LIMITATIONS: No technical indicator is infallible or guarantees profitable trades. User Responsibility • YOU ARE SOLELY RESPONSIBLE for all trading decisions and their consequences • CONDUCT YOUR OWN RESEARCH: Always perform independent analysis before making trading decisions • CONSULT PROFESSIONALS: Seek advice from qualified financial advisors • RISK MANAGEMENT: Implement appropriate risk management strategies No Warranties • The Indicator is provided "AS IS" without warranties of any kind • aiTrendview makes no representations about the accuracy, reliability, or suitability of the Indicator • Technical glitches, data feed issues, or calculation errors may occur • The Indicator may not work as expected in all market conditions. Limitation of Liability • aiTrendview SHALL NOT BE LIABLE for any direct, indirect, incidental, or consequential damages • This includes but is not limited to: trading losses, missed opportunities, data inaccuracies, or system failures • MAXIMUM LIABILITY is limited to the amount paid for the indicator (if any) Code Usage and Distribution • This indicator is published on TradingView in accordance with TradingView's house rules • UNAUTHORIZED MODIFICATION or redistribution of this code is prohibited • Users may not claim ownership of this intellectual property • Commercial use requires explicit written permission from aiTrendview. Compliance and Regulations • VERIFY LOCAL REGULATIONS: Ensure compliance with your jurisdiction's trading laws • Some trading strategies may not be suitable for all investors • Tax implications of trading are your responsibility • Report trading activities as required by law Specific Risk Factors 1. False Signals: The Indicator may generate incorrect buy/sell signals 2. Market Gaps: Overnight gaps can invalidate technical analysis 3. Fundamental Events: News and economic data can override technical signals 4. Liquidity Risk: Some markets may have insufficient liquidity 5. Technology Risk: Platform failures or connectivity issues may prevent order execution. Professional Trading Warning • THIS IS NOT PROFESSIONAL TRADING SOFTWARE: Not intended for institutional or professional trading • NO REGULATORY APPROVAL: This indicator has not been approved by any financial regulatory authority • EDUCATIONAL PURPOSE: Designed primarily for learning technical analysis concepts FINAL WARNING NEVER INVEST MONEY YOU CANNOT AFFORD TO LOSE Trading financial instruments involves significant risk. The majority of retail traders lose money. Before using this indicator in live trading: 1. Practice on paper/demo accounts extensively 2. Start with small position sizes 3. Develop a comprehensive trading plan 4. Implement strict risk management rules 5. Continuously educate yourself about market dynamics By using the Quantum Market Analyzer X7, you acknowledge that you have read, understood, and agree to this disclaimer. You assume full responsibility for all trading decisions and their outcomes. Contact: For questions about this disclaimer or the indicator, contact aiTrendview through official TradingView channels only. ________________________________________ This study guide and indicator are published on TradingView in compliance with TradingView's community guidelines and house rules. All users must adhere to TradingView's terms of service when using this indicator. Document Version: 1.0 Publisher: aiTrendview ________________________________________ Disclaimer The content provided in this blog post is for educational and training purposes only. It is not intended to be, and should not be construed as, financial, investment, or trading advice. All charting and technical analysis examples are for illustrative purposes. Trading and investing in financial markets involve substantial risk of loss and are not suitable for every individual. Before making any financial decisions, you should consult with a qualified financial professional to assess your personal financial situation.Pine Script®指標由aiTrendview-Charting-System提供140
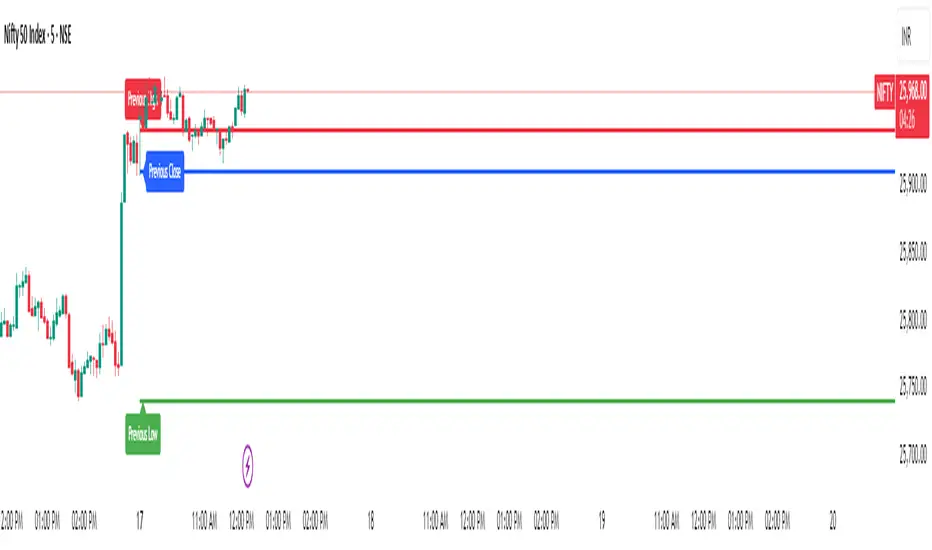
Previous Day Levels @darshaksscThis indicator provides intraday traders and analysts with immediate visual reference to the previous day's high, low, and close. These historical price levels are frequently watched by market participants for potential reaction, context, and session structure. How to Add the Indicator: Open any chart on TradingView. Click the Indicators button at the top. Search for “Previous Day Levels @darshakssc” in the Public Library. Click the ★ Favorite icon if you wish to save it for quick access in the future. Click the indicator’s name to add it to your chart. The lines and labels will appear automatically on any intraday timeframe. What You Will See: Previous day’s High (red line and label: “Previous High”). Previous day’s Low (green line and label: “Previous Low”). Previous day’s Close (blue line and label: “Previous Close”). These are drawn automatically at each new session and remain visible throughout today’s trading. Usage: Use these levels as reference points for context, risk placement, or understanding shifts in session structure. Watch for price interactions, rejections, or consolidations around these lines—they often act as support/resistance for many trading strategies. No signals or trade advice are provided by this tool. All decisions are made manually by the trader. Features: Persistent, color-coded horizontal lines and clear, small labels. No alerts, buy/sell arrows, or any indication of trading performance. Fully automated for each new session—no action required from the user after adding. Disclaimer: This indicator is intended for informational and charting purposes only. It is not financial advice or a buy/sell recommendation. Always perform your own due diligence before making trading decisions.Pine Script®指標由darshakssc提供29
KP's all in one updatedall in one for intraday overall study, emas,earnings,circuits and morePine Script®指標由Krishnpriya提供18
RSI BREAKOUT SIGNALSThis BB + RSI Breakout indicator is designed to help traders identify potential buy and sell opportunities based on price movements relative to the Donchian channel (or Bollinger-type channel) and momentum conditions. It calculates the highest high and lowest low over a user-defined length to form a dynamic channel, and then it checks whether the current price breaks above the upper band (for a buy signal) or below the lower band (for a sell signal). To avoid repeated signals in a row, the indicator uses a state system: after a buy signal occurs, it will not generate another buy until a sell occurs, and vice versa. When a buy signal is triggered, it automatically calculates a take-profit price a certain percentage above the buy candle and displays this price below the candle as a “TP” label. Sell signals are displayed above the candle, and any previous TP label is cleared. The indicator updates in real time, so the signals move with the chart, giving a clear and lag-free visualization of entry points and potential profit targets.Pine Script®策略由gabrielcoracinidesouza07提供22433
Daily Vertical Lines 6PM (Arctic Blue – No Sundays)Daily vertical lines to show each day's beginning at 6 pm, very simple, just bars to represent the days of each week in arctic blue, no sundays, so that it goes in tandem with my weekly indicator. Pine Script®指標由gabejonah18提供5
CM_MACD_Ult_MTF + Entry SignalsThis script is an enhanced and updated version of the classic CM_Ult_MacD_MTF originally created by ChrisMoody. It preserves the full functionality, look, and behavior of the original multi-timeframe MACD, including: Multi-timeframe MACD calculation 4-color histogram based on momentum direction Optional MACD and Signal line display Optional crossover dots Color-changing MACD line on signal cross Zero-line reference This upgraded version adds entry signals based on MACD/Signal crossovers: New Features Added LONG @ price label when MACD crosses above Signal SHORT @ price label when MACD crosses below Signal Labels appear directly at the crossover point Full support for Pine Script® v6, making it compatible with TradingView’s latest publishing requirements Why this version? The original script was written in an older Pine version and was no longer publishable. This version keeps the full visual identity and logic of the classic MACD while adding modern compatibility and helpful trading signals. Credits Original concept and visual framework: ChrisMoody Added features, Pine v6 migration, and enhancements: tgambinoxPine Script®指標由tgambinox提供53
Order Block Detector by Madtrad✅ Detects bullish and bearish order blocks ✅ Displays green/red rectangles for zones ✅ Displays triangles as signals ✅ 3 types of configurable alerts: Bullish Order Block only Bearish Order Block only All Order Blocks ✅ Information table at top right ✅ Adjustable parameters (sensitivity, display, transparency)Pine Script®指標由manolodes提供96
BB + RSI Breakout Strategy RSI PLUS BB Really good strategy with a tp of 3% win rate is 95 Pine Script®策略由gabrielcoracinidesouza07提供33254
6-Signal Trading SystemAlle Indikatoren aus der PJM Vorlage (alt) zusammengefasstPine Script®指標由darkblue2404提供24
Absorption — Bullish or BearishAbsorption — Bullish or Bearish Only is a lightweight and minimalistic tool designed to identify pure absorption events in the market. It highlights only two conditions: Bullish Absorption • Volume spike • Small candle body • Positive delta behavior (close > open) → Indicates potential buy-side absorption at lows Bearish Absorption • Volume spike • Small candle body • Negative delta behavior (close < open) → Indicates potential sell-side absorption at highs This script intentionally keeps the chart clean by marking only “Bullish” or “Bearish” labels, without any additional visuals, colors, or extra signals. Ideal for traders who want a simple, non-disruptive absorption confirmation tool.Pine Script®指標由YUHUNGTsai提供13
Absorption DetectorAbsorption Detector is a clean and effective tool designed to identify institutional absorption at key turning points of the market. It highlights candles where volume surges but the real body remains small, indicating potential absorption of liquidity before a reversal move. Key Features Volume Spike Detection – identifies abnormal increases in traded volume Small Body Recognition – pinpoints candles with low real-body percentage Delta Simulation (Fake Delta) – uses close–open behavior to approximate bullish/bearish delta Bullish Absorption – highlights potential low-side absorption (green dots + green candles) Bearish Absorption – highlights potential high-side absorption (red dots + red candles) Background Highlighting – visual emphasis on absorption zones Clean, lightweight and non-repainter How It Helps Absorption often occurs before strong moves: Large players fill opposite orders Stops are triggered and absorbed Liquidity on one side dries up Reversal or continuation moves follow This indicator makes it easy to spot these moments in real time.Pine Script®指標由YUHUNGTsai提供31
Volume Spike HighlighterVolume Spike Highlighter is a simple and effective volume-based tool designed to highlight abnormal trading activity. It detects when the current volume exceeds the average volume by a customizable multiplier and visually emphasizes those bars with bright colors, making unusual buying or selling pressure easy to spot. Features: Highlights volume spikes with enhanced green/orange color Normal volume remains standard red/green Adjustable lookback period and spike multiplier Includes a smooth volume moving average for context Clean and lightweight, ideal for intraday or swing traders This indicator helps traders quickly identify strong participation, breakouts, absorption zones, trap candles, and areas where institutions may be active.Pine Script®指標由YUHUNGTsai提供28
session high and low (only for current day) -HITHVEERits about session highs and lows and only for the current day and main sessions are asia london and newyork Pine Script®指標由NiggaWhosNotBlack提供60
Volume Climax Reversal (VCR) — Catch Exhaustion Tops & BottomsNew! VCR spots exhaustion spikes at highs/lows using volume extremes + price action + VWAP context. If you trade parabolic runners, indices, or mean-reversion edges, VCR helps you time the backside (shorts) and fade capitulation (longs) with clean, rule-based signals. What it does Detects volume climax: current volume > SMA(len) × multiplier and a new volume high in the lookback. Confirms price context: makes a higher high (for tops) or lower low (for bottoms). Filters with VWAP (optional): bearish signals only below VWAP, bullish signals only above VWAP. Optional wick filter: requires an exhaustion wick > body to reduce chop. Why traders like it Clear entries: “VCR↓” (bearish) at exhaustion tops, “VCR↑” (bullish) at washout lows. Fewer false signals: VWAP gating + wick filter focus on true climaxes. Built-in alerts: set once, get notified on your phone/desktop when a setup appears. How I trade it (simple playbook) Bearish reversal (short / puts) Wait for VCR↓ (exhaustion at/near HH). Look for a lower high that fails to reclaim the signal candle high. Enter on the break of that lower-high candle low. Stop above the signal wick high. Covers/targets: VWAP first; then 20–30% fade from the local top / prior demand. Bullish reversal (long / calls) Wait for VCR↑ (capitulation at/near LL). Look for a higher low that holds above the signal candle low. Enter on the break of the HL candle high. Stop below the signal wick low. Targets: VWAP first; then prior supply/MA bands. Tip for small-cap/“Dux” style: VCR pairs perfectly with a gap + high USD-rotation scan. Let them blow off, then use VCR for the timing. Inputs (tune to your market) Volume SMA Length (default 20) Volume Spike Multiplier (default 2.0) Lookback High / Low (default 10 / 10) Require VWAP confirmation? (on) Use wick filter? (on) Works on stocks, indices, futures, crypto. Timeframes: 1–15m for day trading; 1h–4h–D for swing. Alerts Set one (or both) alerts and forget it: Bearish Volume Climax — VCR↓ Bullish Volume Climax — VCR↑ You’ll get instant notifications when a qualified top/bottom prints. Best practices Don’t countertrend the first front-side ramp—wait for the VCR and a lower-high/higher-low. Respect VWAP: it’s your first profit-taking and a bias filter. Size small into volatility; widen stops in fast markets. Combine with your watchlist filters (gap %, float/O/S, USD rotation, session timing). What’s included Clean visual signals (triangles + subtle background shading) Session-anchored VWAP Alert conditions that appear in TradingView’s alert menu Sensible defaults + clear docs (this post) FAQ Q: Does it repaint? No. VCR uses completed-bar data; signals print end-of-bar. Q: Which markets? Anything with volume: US equities, futures, crypto, indices. Q: Can I use it for scalps? Yes—1–5m with wick filter on and VWAP required works well. Get more / upgrades I’m iterating fast (MTF filter, heatmap panel, combined “one-alert” mode). Want the pro template with dashboard & combined alerts? Message me on TV or DM / email you@domain.com . Risk Notice This is educational research, not financial advice. Markets carry risk—always manage position size and use stops. If this helped you, smash the 👍 and ⭐ — it really helps! #volume #vwap #reversal #exhaustion #trendreversal #smallcaps #scalping #daytrading #swingtrading #stocks #futures #crypto #indicatorPine Script®指標由Rendon1提供54
VWAP + Volume Spikes See Where Smart Money ExhaustsVolume tells the truth. VWAP tells the bias. This script shows both — live. If you trade intraday momentum, reversals, or liquidity sweeps, this indicator is built for you. It shows where volume spikes hit extreme levels, anchored around VWAP and its dynamic bands, so you can instantly spot capitulation or hidden absorption. 🎯 What This Indicator Does ✅ Plots VWAP — session-anchored, updates automatically ✅ Adds dynamic VWAP bands — standard deviation envelopes showing volatility context ✅ Highlights volume spikes — colored candles + background for abnormal prints ✅ Includes alerts — “Volume Spike”, “VWAP Cross”, or a combined alert with direction ✅ Clean visual design — instantly readable in fast markets It’s your visual orderflow radar — whether you’re trading gold, indices, or small caps. 🔍 Why It Works Institutions build and unwind positions around VWAP. Retail often chases volume… this script shows you when that volume becomes too extreme. A spike above VWAP near resistance? → Likely distribution. A spike below VWAP near support? → Likely capitulation. Combine volume exhaustion + VWAP context, and you’ll see market turning points form before most indicators react. ⚙️ Inputs You Can Tune Bands lookback: adjusts how reactive the VWAP bands are Band width (σ): set how tight or wide your deviation envelope is Volume baseline length: controls how “abnormal” a spike must be Spike threshold: multiplier vs. average volume Toggle color-coding, bands, and labels Default settings work well across 1m–15m intraday charts and 1h–4h swing frames. 💡 How Traders Use It 1️⃣ Fade Parabolics: When a green spike candle pierces upper VWAP band on high volume → smart money unloading. Look for rejection and short into VWAP. 2️⃣ Catch Capitulations: When a red spike candle dumps below lower VWAP band → panic selling. Watch for stabilization and long back to VWAP. 3️⃣ VWAP Rotation Plays: Alerts for price crossing VWAP help you spot shift in intraday control. Above VWAP = buyers in charge. Below VWAP = sellers in charge. 🧠 Best Practices Pair it with Volume Profile or Delta/Flow tools to confirm exhaustion. Don’t chase — wait for spike confirmation + reversal candle. Use it on liquid tickers (NASDAQ, SPY, GOLD, BTC, etc.). Great for Dux-style small-cap shorts or index pullbacks. 🔔 Alerts Ready Choose from: Volume Spike (single-bar explosion) VWAP Cross Up/Down (trend shift confirmation) One Combined Alert (any signal, includes ticker, price, and volume) Set once — get real-time push notifications, Telegram, or webhook signals. 📊 My Favorite Setups US100 / NASDAQ: fade rallies above VWAP + spike Gold / Silver: trade reversals from VWAP bands Small caps: short back-side after volume climax ES, DAX, Oil: scalp VWAP rotation with confluence ❤️ Support This Work I release free and premium scripts weekly — combining smart money concepts, VWAP tools, and volume analytics. 👉 Follow me on TradingView for more indicators and setups. 👉 Comment “🔥” if you want me to post the multi-timeframe VWAP + Volume Pressure version next. 👉 Share this with your team — it helps the community grow.Pine Script®指標由Rendon1提供19
HelloTradingViewtest script to unlock invite only features. Hope everyone is having an awesome day!Pine Script®指標由AxisAnalytics提供6
3TF Supertrend Resonance— 4H/1H/15m+ 3TP/SLMTF Supertrend — 4H / 1H / 15m Confluence + Dynamic TP/SL + Adaptive Trend/Range Filters This script is a multi-timeframe Supertrend confluence system designed for traders who operate on lower timeframes (15m / 1m) but want higher-timeframe structure, trend confirmation, and dynamic TP/SL projections. It combines 4H + 1H + 15m Supertrend, trend alignment detection, range filtering, and auto-projected risk-based targets, providing a complete directional framework for both scalping and intraday swing entries. 👉1. Multi-Timeframe Supertrend Framework (4H / 1H / 15m) The script calculates Supertrend levels and direction on three major timeframes: -4H Supertrend -1H Supertrend -15m Supertrend Users can choose between: -Confirmed HTF values (no repaint) -Live HTF values (more sensitive but may repaint) Each Supertrend level is plotted on the current chart as a horizontal line, extended far to the left and slightly to the right, with optional lightweight labels showing direction and price. These levels function as HTF dynamic support/resistance during intraday trading. 👉2. Confluence Detection (4H = 1H = 15m) A trend confluence occurs when: -4H direction = 1H direction = 15m direction When the three timeframes align: A full-height vertical line marks the first candle of confluence (color-coded bullish/bearish). An alert is triggered: “Triple-TF Trend Confluence — First Candle” This identifies the earliest moment when the market shifts into unified directional behavior. 👉3. Trend Background Coloring (15m + 1m) When confluence is active: -Bullish confluence → Green background -Bearish confluence → Red background Background visualization is applied on: -15m timeframe (main directional chart) -1m timeframe (scalping entries with HTF alignment) This ensures lower-timeframe decisions always stay aligned with higher-timeframe direction. 👉4. Weak-Trend / Range Detection (Only on 15m) Even if all three timeframes are aligned, momentum may be weak. Range/weak-trend detection activates when: -Confluence = true -AND (ADX < threshold OR Choppiness > threshold) On 15m charts: A grey overlay appears, covering green/red confluence colors. First candle entering range shows a vertical grey mark (optional). Alert: “Confluence but Weak Momentum — First Candle” This identifies moments where the market is aligned but lacking trend strength — a “trend that doesn’t move.” 👉5. Dynamic TP/SL Projection (1.5R / 3R / 4.5R) Using the current timeframe’s Supertrend as a structural stop-loss: SL = current Supertrend line Risk = | Close - SL | The script auto-calculates: TP1 = 1.5 × risk TP2 = 3.0 × risk TP3 = 4.5 × risk All projected upward for bullish trends and downward for bearish trends. Displayed visually: Dotted short-range lines for SL, TP1, TP2, TP3 Lightweight left-side labels showing: SL price + distance Individual TP prices This provides an immediate R-multiple framework for trade planning. 👉6. 15m Supertrend Flip Indicator (Minimalistic) When the 15m Supertrend changes direction: A tiny circle marker is plotted: -Bullish flip → below the bar, green -Bearish flip → above the bar, red Alerts: “15m ST Flip Up (Bear → Bull)” “15m ST Flip Down (Bull → Bear)” This highlights early shifts in short-term structure before confluence or major trend changes occur. 👉7. Alerts Included The script provides alerts for: -Triple-TF Trend Confluence — First Candle -Weak Trend / Range Start -15m Supertrend Flip Up -15m Supertrend Flip Down These are practical for automated notifications when key structural conditions appear. Summary This script provides: ✅ Higher-Timeframe Context 4H, 1H, and 15m Supertrend levels + direction. ✅ Directional Certainty Triple-timeframe confluence with visual + alert confirmation. ✅ Smart Background Guidance Color-coded trend zones for 15m & 1m. ✅ Range / Weak Trend Filtering Avoid false trends using ADX + Choppiness. ✅ Actionable TP/SL Framework Auto-projected 1.5R / 3R / 4.5R + SL lines based on Supertrend structure. ✅ Precise Intraday Signals 15m Supertrend flips marked with minimalistic dots.Pine Script®指標由zhaowenyan891211提供已更新 77385
ECG PRICE - mauricioofsousa📉 ECG PRICE – The Price Electrocardiogram (explained for traders, scientists, and complete beginners) 🔍 1. WHAT IS THE ECG PRICE? The ECG PRICE protocol is a market-reading system based on the RSI, but with a surgical twist: 👉 You don’t just calculate RSI from price. 👉 You adjust the price using the RSI, and then calculate RSI over this adjusted price. This creates a filtered, amplified signal that behaves like a heart monitor for price, detecting micro-impulses and subtle market movements long before they show up in the standard RSI. 🧬 2. CORE IDEA Just like a real ECG amplifies and reveals electrical rhythms hidden inside the heartbeat, the ECG PRICE amplifies micro-deformations hidden inside the price’s momentum. It works in three stages: Compute the regular RSI Use the RSI to adjust the price (creating an electrocardiographic price) Compute a second RSI over this modified price The result is a meta-derived oscillator—more sensitive, more precise, and better at detecting structural changes. 🧩 3. TECHNICAL BREAKDOWN 3.1. First RSI (classic) The script calculates: average gains average losses relative strength (RS) and then the standard 0–100 RSI This is the “normal heart rate monitor” everyone uses. 3.2. Creating the “Adjusted Price” adjustedPrice = close * (rsi / 100) This means: ➡️ When RSI is high (strong buying momentum), price is amplified. ➡️ When RSI is low (strong selling momentum), price is compressed. This converts raw price into a bio-electrical signal, where the price itself is modulated by its own internal momentum. It’s the financial equivalent of ECG gain adjustment. 3.3. RSI of the Adjusted Price Now the script calculates a new RSI from this modified price. That is the actual ECG PRICE. This second-order oscillator becomes extremely sensitive to: micro-momentum shifts early trend fading volatility shocks micro-divergences institutional pressure waves It reads the electrical pattern behind the price rather than the superficial movement. 🟩🟥 4. Diagnostic Lines of the Protocol 35 (green dotted) Pre-oversold fatigue zone. 65 (red dotted) Pre-overbought exhaustion zone. 30 (white solid) Classic oversold. 70 (white solid) Classic overbought. Together they create two diagnostic corridors: 1. Medical corridor (30–70): Standard RSI clinical range. 2. Electrical corridor (35–65): The ECG-sensitive zone where micro-shifts appear first. 🧠 5. In Engineering Language (MGO style) The ECG PRICE is essentially: A nonlinear second-order oscillator where the RSI feeds back into price, creating a recursive momentum-modulated signal. It functions like a: bioinformational modulator feedback-driven wave processor impulse amplifier micro-PID sensitivity enhancer Very similar to the informational-wave transformations inside the MGO pipeline. 👨⚕️📉 6. Explained for a Total Beginner Imagine the price is a heart. The normal RSI shows if the heart is beating fast or slow. But the ECG PRICE takes that heartbeat… feeds it back into the heart… and then measures the new heartbeat. This creates a much more sensitive exam that detects problems before the normal test would. 💡 7. What It Gives You in Practice earlier reversal signals better trend-fatigue detection clearer micro-divergences a clean RSI with reduced noise a smoother momentum curve advanced behavioral readings before breakouts It’s an upgrade. A second-layer RSI that “hears” the inner electrical impulses of price.Pine Script®指標由mauricio_of_sousa提供5
Triple Supertrend final indicatorit gives 3 super trends giving the trend and is very good indicator.can be used to be in trend and trail your profit and stoip lossesPine Script®指標由chandolaamit提供1125
PidhikiruvenThis is it!! had a great time looking at it?? Now go figure...Pine Script®指標由Pramodh94提供已更新 4480
Liquidity Void Detector + Pro SignalsWhat This Indicator Does This indicator detects “liquidity voids”—large displacement candles with very high body-to-wick ratios and size significantly above recent ATR—where price moved rapidly and left untested areas. It automatically draws shaded boxes for new, non-overlapping voids, shows a moveable dashboard (void fill probabilities), and provides one clean, actionable long/short signal per void when price action and momentum confirm. How It Works Void Detection: Candles with a body/wick ratio and size above user threshold trigger a potential liquidity void. Box Drawing: Each new void is drawn as a shaded box (yellow/orange) that never overlaps other active voids. Signal Confirmation: A “LONG” or “SHORT” label appears at the first bar within each valid void if momentum and candlestick structure align. Dashboard: User-selectable dashboard shows up-to-date stats on remaining unfilled, partially filled, and fully filled voids. Alerts: Built-in alerts fire when a new high-probability long/short signal is detected (user must add alerts manually). Key Features No overlap, no clutter: Only the latest set of boxes and a single signal per event are drawn. Oldest boxes are pruned automatically. Momentum filter: Signals combine void and trend strength for higher conviction, filtering out weak/fake moves. Non-repainting: Signals, boxes, and logic only use confirmed bar data—no repaint or future leaks. Adjustable settings: Every threshold (body/wick ratio, ATR size, maximum boxes, dashboard location, signal label size) is user-configurable. Efficient for all timeframes and asset classes. How to Use Add to your chart: Click "Add to Chart" or search “Liquidity Void Detector” in the indicator search panel. Tune your inputs: Adjust the Body/Wick Ratio and Min Size vs ATR for your market or timeframe. Set the Void Box Length (how many bars the box displays), signal sensitivity, and maximum concurrent voids. Move the dashboard as needed for your chart layout. What to look for: Yellow/orange boxes highlight recent liquidity voids—untested price gaps where future reactions may occur. LONG/SHORT signals appear only where a fresh void coincides with confirmed momentum in that direction. Dashboard tracks probability of voids remaining unfilled, being partially filled, or fully refilled by price. Trading logic and best use: Traders may use void boxes to anticipate where price might react, reverse, or trend continuation can resume. Combine signals with additional price action confirmation such as S/R levels, order blocks, wick rejections, volume spikes, or patterns (e.g., pin bars, engulfing). Use signal alerts in conjunction with order flow, session profile, or support/resistance tools for increased confluence. Always backtest and demo trade before live use. Important Compliance & Disclaimer No advice: This tool provides visual context only. All trading and risk decisions are the user’s responsibility. No repainting, original source: The code is fully open-source, uses only native Pine Script, and never repaints. No spam, no links, no 3rd-party promotion: 100% TradingView House Rules compliant. If you find this useful, please consider leaving a positive review, and remember to always confirm with your own analysis.Pine Script®指標由darshakssc提供771