Enhanced Price Direction Predictor📊 Core Mechanism: Rule-Based Scoring:
The indicator relies on a simplified scoring model where it checks for nine specific conditions on the bullish side and nine corresponding conditions on the bearish side.
Bullish/Bearish Score Calculation:The script initializes bullish_score and bearish_score to $0.0$.It then checks a predefined list of features (e.g., $5$-period Rate of Change, $5/20$ EMA crossover, RSI level, Order Flow direction) and adds a fixed point value (weight) to the appropriate score if the condition is met.
Overbought/Oversold Penalty:It includes a built-in risk-management element by applying a $-0.10$ penalty if the RSI is in extreme territory:RSI(14) $>$ 70 (Overbought) $\rightarrow$ Penalty to bullish_score.RSI(14) $<$ 30 (Oversold) $\rightarrow$ Penalty to bearish_score.
Probability Conversion:The probability_up is calculated by taking the ratio of the bullish_score to the total_score (sum of bullish and bearish scores):$$\text{Probability\_Up} = \frac{\text{Bullish\_Score}}{\text{Bullish\_Score} + \text{Bearish\_Score}}$ MIL:IF the total_score is zero (i.e., no strong conditions are met), the probability defaults to $0.5$ (neutral).
廣量指標

⚡ Zero-Lag 60s Binary Predictor🧠 Core Anti-Lag Philosophy
The indicator's primary goal is to overcome the inherent lag of traditional indicators like the Simple Moving Average (SMA) or standard Relative Strength Index (RSI). It achieves this by focusing on:
Leading Indicators: Using derivatives of price/momentum (like acceleration and jerk—the second and third derivatives of price) to predict turns before the price action is clear.
Instantaneous Metrics: Using short lookback periods (e.g., ta.change(close, 1) or fastLength = 5) and heavily weighting the most recent data (e.g., in instMomentum).
Market Microstructure: Incorporating metrics like Tick Pressure and Order Flow Imbalance (OFI), which attempt to measure internal bar dynamics and buying/selling aggression.
Zero-Lag Techniques: Specifically, the Ehlers Zero Lag EMA, which is mathematically constructed to eliminate phase lag by predicting where the price will be rather than where it was.

ASTER Key Levels & Alerts (Improved)TradingView Script Description
Title: ASTER Key Levels & Alerts (Improved)
Description:
Enhance your trading strategy with the "ASTER Key Levels & Alerts" indicator, designed for precision and decision-making on the Aster chart (e.g., ASTS). This Pine Script v6 tool overlays customizable key levels and zones to identify optimal entry, exit, and stop-loss points, complete with real-time alerts.Key Features:
Customizable Levels: Adjust add zones (Light & Main), breakout, stop, and take-profit (TP1-TP3

Relative Volume (Multi-TF, D, W, M)Relative Volume (Multi-TF, Candle-Matched Colors)
This indicator measures Relative Volume (RVOL) — the ratio of current volume to average historical volume — across any higher timeframe (Daily, Weekly, or Monthly) and displays it as color-coded columns that match the candle colors of the chart you’re viewing.
RVOL reveals how active today’s market participation is compared to its typical rhythm.
RVOL = 1.0 → normal volume
>1.5 → rising interest
>2.0–3.0 → strong institutional participation
>5.0 → climax or exhaustion levels
Features
Works on any chart timeframe while computing RVOL from your chosen higher timeframe (e.g., show Daily RVOL while trading on a 5-minute chart).
Column colors automatically match your chart’s candle colors (green/red/neutral).
Adjustable lookback period (len) and selectable source timeframe (D, W, or M).
Pre-drawn horizontal guide levels at 1.0, 1.2, 1.5, 2, 3, and 5 for quick interpretation.
Compatible with all chart types, including Heikin Ashi or custom color schemes.
Typical Use
Swing trading:
Look for quiet bases where RVOL stays 0.4–0.9, then expansion ≥2 on breakout days.
Confirm follow-through when green days keep RVOL ≥1.2–1.5 and red pullbacks stay below 1.0.
Day trading:
Watch intraday RVOL (on 1–5m charts) for bursts ≥2 that sustain for several bars — this signals crowd engagement and valid momentum.
Interpretation Summary
RVOL Value Meaning Typical Action
0.4–0.9 Quiet base / low interest Watch for setup
1.0 Normal activity Neutral
1.2–1.5 Valid participation Early confirmation
2–3 Strong expansion Momentum / breakout
≥5 Climax / exhaustion Take profits or avoid new entries
Author’s note:
RVOL isn’t directional; it tells how many players are active, not who’s winning. Combine it with structure (levels, VWAP, or trend) to see when the market crowd truly commits.

PDH & PDL Levels This indicator mark previous day high and low lines on current day. Lines will start at opening of the market and will remain there till end of the day. Lines are marked with PDH and PDL labels

SECTOR ROTATION Sector Rotation Indicator with Auto Chart Symbol
This indicator helps traders track relative performance across multiple indices/sectors simultaneously, making it easy to identify sector rotation and market leadership.
Key Features:
✅ 21 Symbols Tracking: Monitor 20 customizable symbols + your current chart symbol automatically(DIVIDEND SYMBOL)
✅ Percentage Performance: All moving averages show percentage gain/loss from 1 timeframe period ago
✅ Color-Coded Visualization: Heat map coloring (red to green) based on relative performance ranking
✅ Flexible Timeframes: Works on any timeframe from 1-minute to 12-month charts
✅ Performance Table: Quick-view table showing candle performance with inside/outside bar detection
✅ Indian Market Ready: Pre-configured with NSE indices (NIFTY, BANKNIFTY, and sectoral indices)
Default Symbols (Customizable):
NIFTY, CNXSMALLCAP, CNXMIDCAP, BANKNIFTY
Sector indices: IT, AUTO, PHARMA, METAL, ENERGY, FMCG, etc.
Plus your current chart symbol (automatically added)
How It Works:
Select your preferred timeframe (1D, 1W, 1M, etc.)
The indicator calculates percentage performance from given period ago
Moving averages show smoothed performance trends
Colors indicate relative strength: Green = outperformers, Red = underperformers
Perfect For:
Sector rotation analysis
Relative strength comparison
Market breadth assessment
Index/ETF traders
Swing and position traders
Settings:
Adjustable MA length (default: 20)
Customizable colors and table position
Show/hide percentage labels
Horizontal or vertical table layout
This is not any buy or sell signal or recommendation, consult with your advisor first.

OBV (Delta or regular)This is a quite simple script to apply some choices to OBV.
You can choose to use regular OBV values or you can choose to use delta OBV values.
Delta OBV values calculates the delta between selling volume and buying volume per bar to find discrepancies.
You can make the OBV a smoothed line or just keep the normal rigid line. Rigid line is default.
A secondary smoothed OBV line is added automatically with color change if the OBV is above or below the smoothed line.
You can set your desired MA from SMA, EMA, VWMA and WMA, The same will be applied to both lines if chosen to smooth them both.
Both lines are editable from the styles tab (visibility, color and line type)
If you for some reason don't want color change on the secondary line, chose the same color for both color 1 and 2.
Simple delta OBV example:
If a red bar has a long lower wick, OBV will calculate the entire bar towards bearish volume, while the delta will check if there's more buying or selling happening in total. Some times you'll be able to catch divergences in the volume which implies a reversal might be in the making.
For instance more selling on a green candle making the OBV drop instead of increasing or vise versa.
Hopefully someone finds is useful.


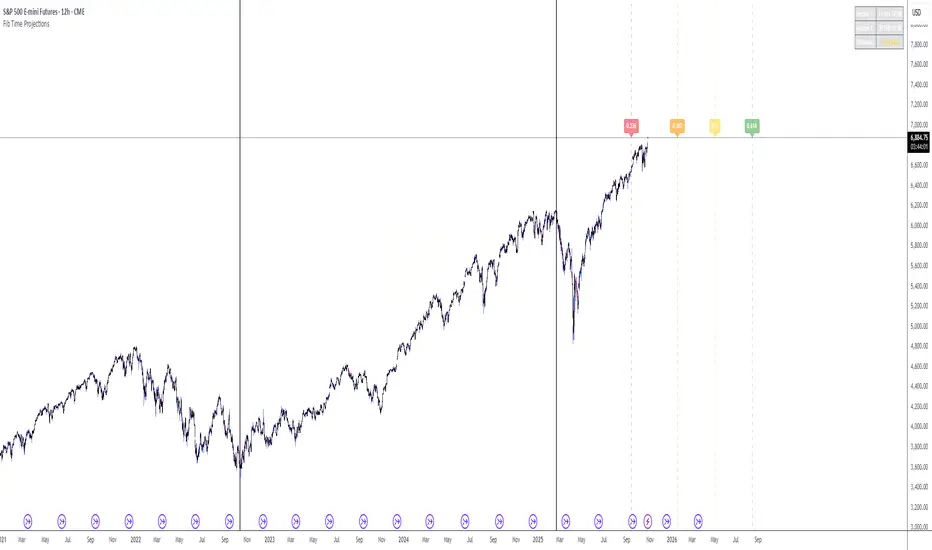
Fib Time Projections aFib Time Projections aFib Time Projections aFib Time Projections aFib Time Projections a
MAHAR K Stochastic IndicatorWhat It Does
%K line calculates fast stochastic of _src over length, then re-smoothed twice: sk (smoothK), %D (smoothD), and slower %F (smoothF).
Plots the three lines, draws 80/50/20 bands, and highlights extreme values by drawing red circles when sk hits 100 and green when it hits 0.
Notable Details
sma_signal chooses the smoothing kernel (SMA, EMA, WMA, DEMA). ma() delegates to the selected function and contains a VWMA branch even though VWMA is not listed in the input options.
A custom dema() helper implements the classic double EMA.
stOBOS is always true, so the ternary wrappers around the circle plots can be simplified.
Risk / Edge Cases
If highestHigh == lowestLow (flat price over the window) the %K calculation divides by zero, yielding na. Consider guarding against that or defaulting to previous values.
To actually expose VWMA, add it to the input options; otherwise remove the dead code branch.
Next Steps
Decide whether to safeguard the denominator before plotting.
Align the smoothing options with the available choices and prune the redundant conditionals if desired.

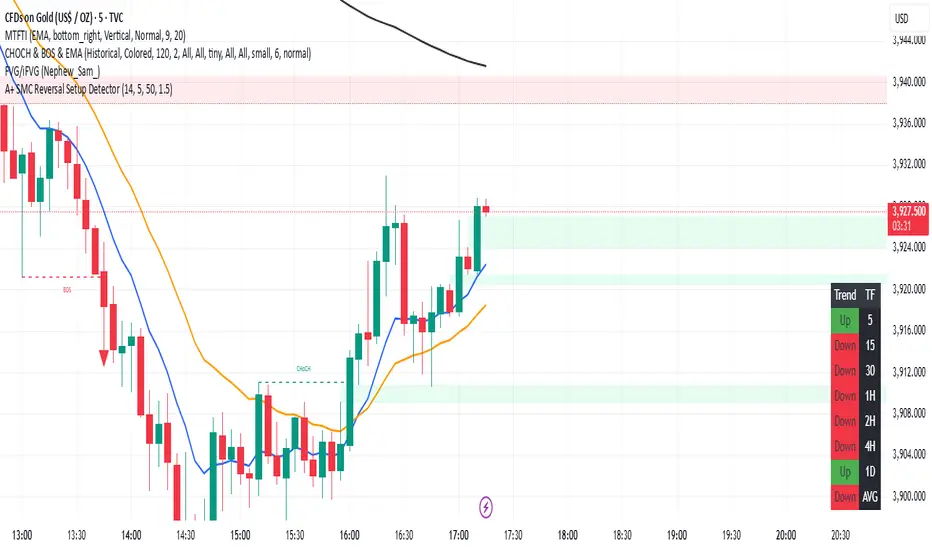
A+ SMC Reversal Setup Detectortesting topg strategy testi
ng topg strategytesting topg strategytesting topg strategy.
testing topg strategy
testing topg strategy
testing topg strategytesting topg strategytesting topg strategy
testing topg strategy
EMA6 or SMA6 Touch AlertThis script monitors the market and notifies you whenever the price touches either the 6-period EMA or the 6-period SMA.
It helps identify potential pullbacks, reaction points, or entry zones, as price interaction with these moving averages often signals short-term market shifts.
What the script does:
Calculates the EMA 6 and SMA 6
Detects if price touches either moving average within the candle
Plots both lines on the chart for visibility
Allows you to set alerts to receive automatic notifications
Best suited for:
Scalping
Day Trading
Pullback Entries
Short-term trend reactions

摆渡(链英趋势信号)/@version=6
indicator("摆渡(链英趋势信号)", overlay = true)
// --------------------------------------------------------------------------------------------------------------------}
// 𝙐𝙎𝙀𝙍 𝙄𝙉𝙋𝙐𝙏𝙎
// --------------------------------------------------------------------------------------------------------------------{
float src = input.source(close, "Source")
int length = input.int(25, "Length")
int width = input.int(2, "Line Width")
color color1 = input.color(#22c878, "", inline = "1", group = "color")
color color2 = input.color(#c8224e, "", inline = "1", group = "color")
int transp = input.int

Lux Algo Signals & Overlays [6.3]Like an original one. the script follows a script of LuxAlgo, but free. this is for a personal usage

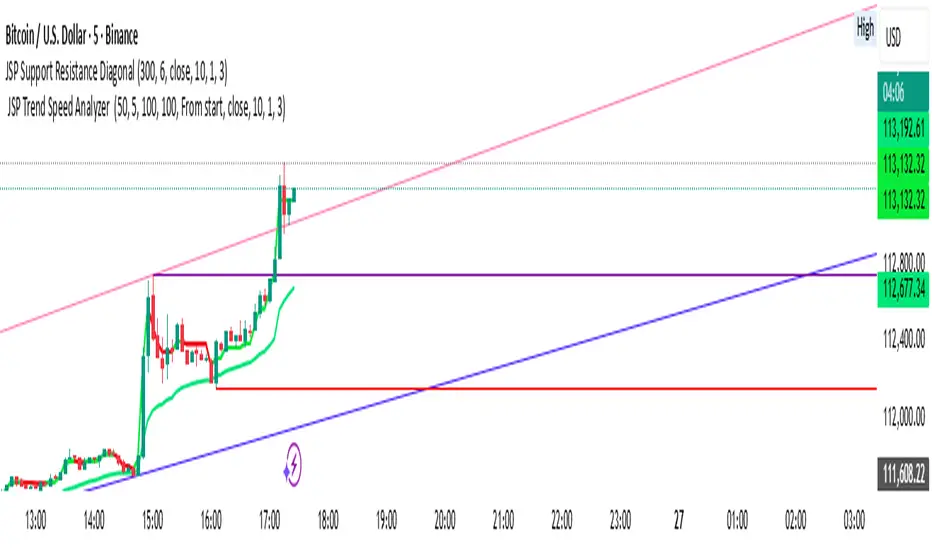
CHN-Super AnalizAutomatically determines support and resistance levels. Performs trend analysis. Determines stop level. Gives buy and sell signals.

VietNguyen Buy/Sell VIPThis is indicator of VietNammes, it is very good for trade Gold and Crypto.
VietNguyen DN

High-Win Pullback - Minimal & Safe (v6)hfbfbffb eybvfyeqbffbqe rohfbqerobfeqr jrbhebqerf jfhfqbfe fbqfboquebfe ouqbfouef

High-Win Pullback - Minimal & Safe (v6)hbhb hbuiu ubupibpiububpuiubb bpiubpibuibi jbbibhibb jblhjbhb
HwangLongHwangLong 2 is a technical indicator used primarily for identifying trend reversal points in the financial markets. It combines multiple factors such as price action, market momentum, and volatility to generate buy or sell signals. The indicator is designed to help traders spot strong trend changes, potential breakout points, and overbought or oversold conditions. It is particularly favored for its ability to filter out market noise and provide clear, actionable insights. By analyzing both short-term and long-term market dynamics, HwangLong 2 aims to improve trading accuracy and enhance decision-making in dynamic market conditions.

HwangLong2HwangLong 2 is a technical indicator used primarily for identifying trend reversal points in the financial markets. It combines multiple factors such as price action, market momentum, and volatility to generate buy or sell signals. The indicator is designed to help traders spot strong trend changes, potential breakout points, and overbought or oversold conditions. It is particularly favored for its ability to filter out market noise and provide clear, actionable insights. By analyzing both short-term and long-term market dynamics, HwangLong 2 aims to improve trading accuracy and enhance decision-making in dynamic market conditions.

Pythia — v0.5.5 LiteDescription
Pythia Lite helps to identify potential trend reversal zones before they become visible on the chart.
It analyzes the energy of price movement and highlights where momentum starts to fade — signaling possible changes ahead.
Built on adaptive MACD divergence logic and collapse-zone forecasting, it shows where the probability of a reversal becomes the highest.
Core Features
• Forecasts possible reversal areas
• Smart signal filtering based on σ-significance
• Dynamic projection zones (linear regression + ATR)
• Visibility and stability boost for cleaner signals
• Visual markers for directional bias
Lite Limitations
• Reduced sensitivity range
• Single-scale analysis (no macro mode)
• Simplified divergence filters
👉 saellab.gumroad.com
Created through the dialogue of analysis and intelligence.
© Saël Lab — Pythia Project 2025
#Pythia #Forecast #Divergence #CollapseZone #Reversal #MACD #SaelLab #TradingSystem #Energy #MarketExhaustion #AdaptiveIndicator

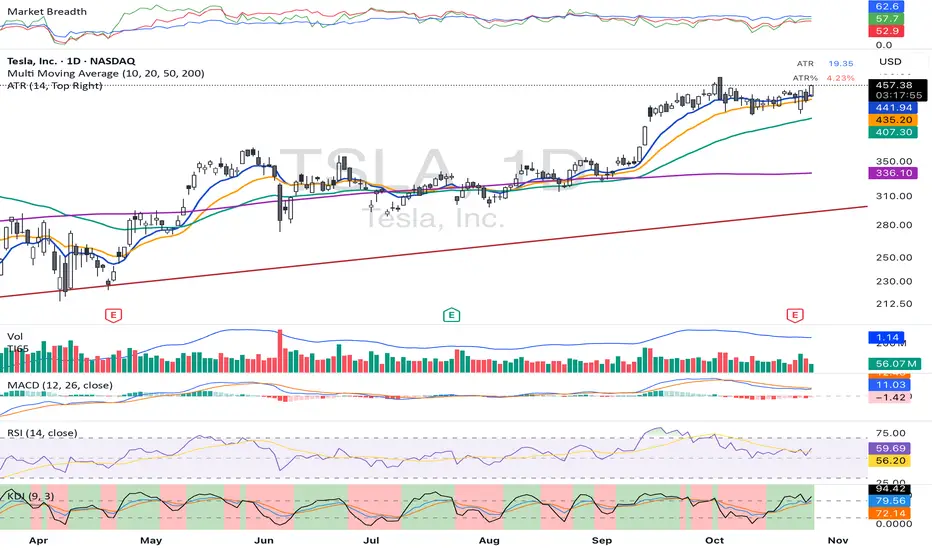
ATRThis script displays the Average True Range (ATR) value and the ATR as a percentage of the current closing price directly on the main chart as a clean table, with no lines or plots. It allows users to easily monitor both absolute volatility and its relative magnitude, making comparisons across different assets intuitive. The display position is customizable, offering flexibility for personal chart layouts. Ideal for traders seeking quick volatility insights, risk management guidance, or portfolio-wide comparisons.