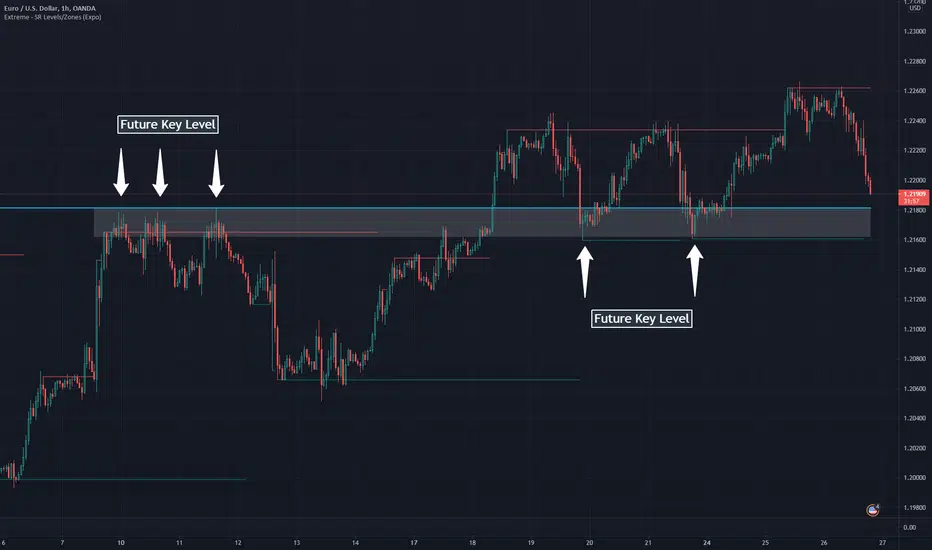
Extreme - SR Levels/Zones (Expo)Extreme - SR Levels/Zones (Expo) automatically searches and prints key support and resistance levels based on "extreme" high & low values.
When the extreme condition is met there is a high probability that the market pauses, makes a pullback, or that the trend change direction. If the current trend is strong, the price will breakout from the previous extreme level.
The indicator can be used standalone or as a part of your current trading strategy.
Real-time
No repainting
Works on any market
HOW TO USE
1. Use the indicator to identify key support and resistance levels.
2. Use the indicator to identify potential breakouts.
3. Use the indicator to identify potential reversal points.
INDICATOR IN ACTION
Daily chart
I hope you find this indicator useful , and please comment or contact me if you like the script or have any questions/suggestions for future improvements. Thanks!
I will continually work on this indicator, so please share your experience and feedback as it will enable me to make even better improvements. Thanks to everyone that has already contacted me regarding my scripts. Your feedback is valuable for future developments!
ACCESS THE INDICATOR
• Contact me on TradingView or use the links below
-----------------
Disclaimer
Copyright by Zeiierman.
The information contained in my scripts/indicators/ideas does not constitute financial advice or a solicitation to buy or sell any securities of any type. I will not accept liability for any loss or damage, including without limitation any loss of profit, which may arise directly or indirectly from the use of or reliance on such information.
All investments involve risk, and the past performance of a security, industry, sector, market, financial product, trading strategy, or individual’s trading does not guarantee future results or returns. Investors are fully responsible for any investment decisions they make. Such decisions should be based solely on an evaluation of their financial circumstances, investment objectives, risk tolerance, and liquidity needs.
My scripts/indicators/ideas are only for educational purposes!
Breakout
NSDT ES USA Open TargetsThis indicator provides potential entries and targets (both long and short) for the ES/MES USA session. It creates potential target lines on the chart as well as a gray box with the potential levels in text format. Both options can be turned on or off at the discretion of the trader. You may need to adjust the chart width so the box shows on the screen. It's position is adjustable.
The lines and the text box are updated after the first 1 MINUTE bar closes for USA session. The USA session open is defined as 9:30AM - 9:31AM, Eastern time.
Place the chart on a 1 MIN time interval for best results. You can change the chart timeframe after the 1st min bar closes and the data is updated.
To get access to this indicator, use the link in the profile signature or private message us here in Tradingview.

NSDT NQ USA Open TargetsThis indicator provides potential entries and targets (both long and short) for the NQ/MNQ USA session. It creates potential target lines on the chart as well as a gray box with the potential levels in text format. Both options can be turned on or off at the discretion of the trader. You may need to adjust the chart width so the box shows on the screen. It's position is adjustable.
The lines and the text box are updated after the first 1 MINUTE bar closes for USA session. The USA session open is defined as 9:30AM - 9:31AM, Eastern time.
Place the chart on a 1 MIN time interval for best results. You can change the chart timeframe after the 1st min bar closes and the data is updated.
To get access to this indicator, use the link in the profile signature or private message us here in Tradingview.

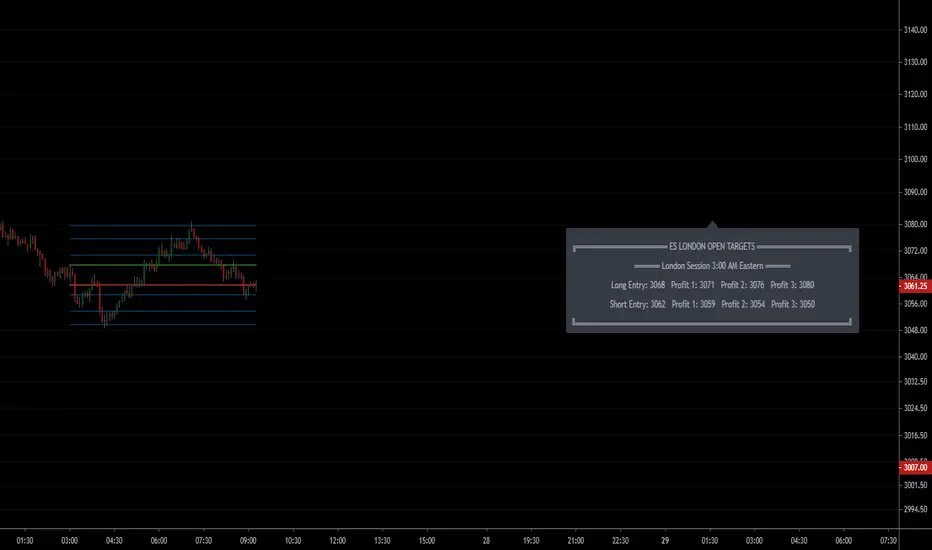
NSDT ES London Open TargetsThis indicator provides potential entries and targets (both long and short) for the ES/MES London session. It creates potential target lines on the chart as well as a gray box with the potential levels in text format. Both options can be turned on or off at the discretion of the trader. You may need to adjust the chart width so the box shows on the screen. It's position is adjustable.
The lines and the text box are updated after the first 1 MINUTE bar closes for London session. The London session open is defined as 3:00AM - 3:01AM, Eastern time.
Place the chart on a 1 MIN time interval for best results. You can change the chart timeframe after the 1st min bar closes and the data is updated.
To get access to this indicator, use the link in the profile signature or private message us here in Tradingview.
NSDT NQ London Open TargetsThis indicator provides potential entries and targets (both long and short) for the NQ/MNQ London session. It creates potential target lines on the chart as well as a gray box with the potential levels in text format. Both options can be turned on or off at the discretion of the trader. You may need to adjust the chart width so the box shows on the screen. It's position is adjustable.
The lines and the text box are updated after the first 1 MINUTE bar closes for London session. The London session open is defined as 3:00AM - 3:01AM, Eastern time.
Place the chart on a 1 MIN time interval for best results. You can change the chart timeframe after the 1st min bar closes and the data is updated.
To get access to this indicator, use the link in the profile signature or private message us here in Tradingview.

NSDT NQ Asia Open TargetsThis indicator provides potential entries and targets (both long and short) for the NQ/MNQ Asian session. It creates potential target lines on the chart as well as a gray box with the potential levels in text format. Both options can be turned on or off at the discretion of the trader. You may need to adjust the chart width so the box shows on the screen. It's position is adjustable.
The lines and the text box are updated after the first 1 MINUTE bar closes for Asian session. The Asian session open is defined as 6:00PM - 6:01PM, Eastern time.
Place the chart on a 1 MIN time interval for best results. You can change the chart timeframe after the 1st min bar closes and the data is updated.
To get access to this indicator, use the link in the profile signature or private message us here in Tradingview.

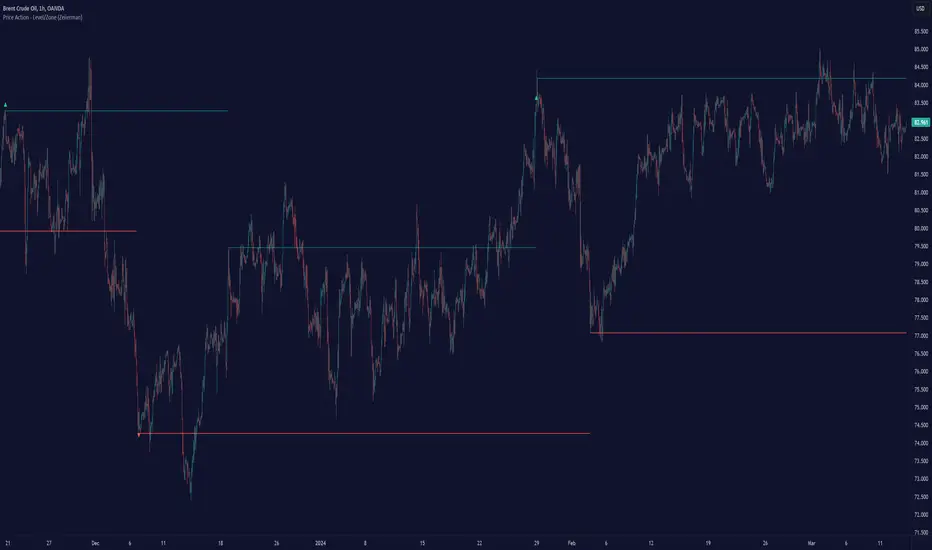
Price Action - Level/Zone (Expo)Price Action - Level/Zone (Expo) indicator identifies buying and selling pressure that has an impact on the price movement. This is visualized by a Zone, or Levels or with Barcolors depending on which settings are used.
Depending on the selected settings the indicator can identify buying and selling pressure which pushes the price further in the trend direction and it can show exhausted buyers/sellers which is seen in reversal points.
HOW TO USE
1. Use the indicator to identify buying and selling pressure.
2. Use the indicator to identify exhausted buyers and sellers.
3. Use the indicator to identify reversal points, pullbacks, or trend shifts.
4. Use the indicator to buy/short-sell breakouts of the zones.
5. Use the indicator to buy/short-sell when the price re-test the zones.
-> Try the indicator on Heikin Ashi Candles , but it works as good at any type of candlestick, bars, Renko, or line break.
INDICATOR IN ACTION
4 hour chart
4 hour chart
I hope you find this indicator useful , and please comment or contact me if you like the script or have any questions/suggestions for future improvements. Thanks!
I will continually work on this indicator, so please share your experience and feedback as it will enable me to make even better improvements. Thanks to everyone that has already contacted me regarding my scripts. Your feedback is valuable for future developments!
ACCESS THE INDICATOR
• Contact me on TradingView or use the links below
-----------------
Disclaimer
Copyright by Zeiierman.
The information contained in my scripts/indicators/ideas does not constitute financial advice or a solicitation to buy or sell any securities of any type. I will not accept liability for any loss or damage, including without limitation any loss of profit, which may arise directly or indirectly from the use of or reliance on such information.
All investments involve risk, and the past performance of a security, industry, sector, market, financial product, trading strategy, or individual’s trading does not guarantee future results or returns. Investors are fully responsible for any investment decisions they make. Such decisions should be based solely on an evaluation of their financial circumstances, investment objectives, risk tolerance, and liquidity needs.
My scripts/indicators/ideas are only for educational purposes!
Pre-session rangeSimple tool to capture high and low of pre-session period (not restricted to stock market, by any means!) and then plotting it on your trading session time.

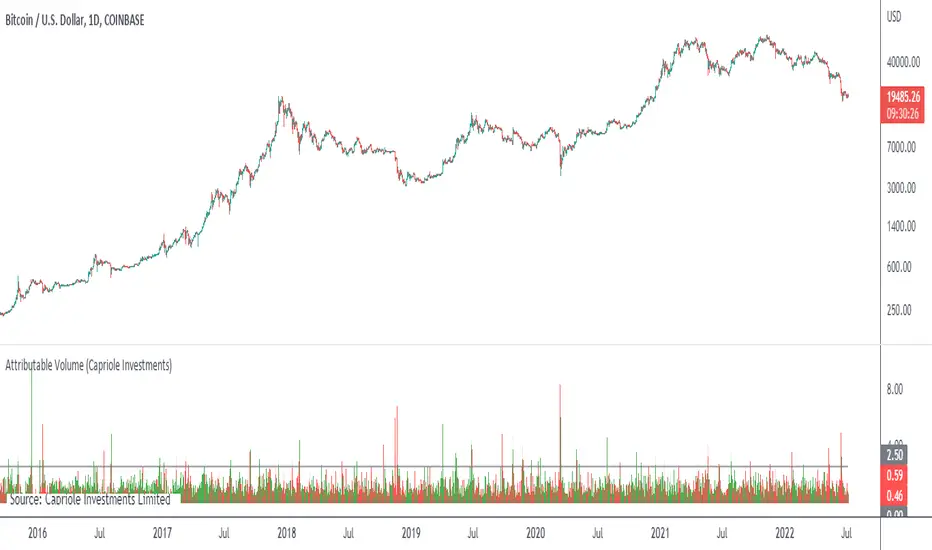
Attributable VolumeA volume indicator which calculates "Attributable Volume”, the portion of volume which contributed to the direction in which the candle moved.
Attributable Volume is calculated as: Total volume excluding the "counter wick" volume.
Where for a green (up) candle, the "counter wick" volume is the top wick volume.
In theory, Attributable Volume should better represent the effort of directional thrust of each candle.
By default, this indicator displays “Attributable RVOL”, but can be set to:
Attributable RVOL
RVOL
Attributable Volume
Volume
Note: RVOL = Relative Volume, the current volume divided by the Volume moving average. RVOL can be used to identify major moves, and potential starts/ends to trends.
EMA BREAKOUT WITH TP OR SL [NLB]Hello Everyone,
Its Indicator Base On two exponential moving average (EMA) crossover You can Also Choice any input when EMA cross we are plots High and low
Indicator Feature
➤ Long Side Signal With Alerts
➤ Short Side Signal With Alerts
➤ Long side Take profit Calculated By Open Bar You Can Also Change Calculate Bar Source and percentage input
➤ Short side Take profit Calculated By Open Bar You Can Also Change Calculate Bar Source and percentage input
➤ Long side stop loss
➤ Short side stop loss
Important: This Indicator we are using for Automation Trading if You Want This Indicator Access Please Contact me PM on Tradingview

Fearzone & Greedzone Levels - Contrarian & Breakout (Expo)"Be fearful when others are greedy, and greedy when others are fearful" - Warren Buffett. Fearzone & Greedzone Levels - Contrarian & Breakout (Expo) is a contrarian and breakout indicator that gives us an indication when fear and greed begins to take over in the market. Traders should be prepared for increased volatility and good trading opportunities.
This indicator can both be used to identify potential reversal points and be used to identify breakouts from previous Fear and Greed Levels.
The Fearzone and Greedzone can be visualized with candlesticks or with circles depending on what you prefer.
Alert conditions are added.
HOW TO USE
1. Use the indicator to identify when investors are fearful and greedy.
2. Use the indicator to identify potential reversal points.
3. Use the indicator to identify potential breakouts.
INDICATOR IN ACTION
4 hour chart
4 hour chart
I hope you find this indicator useful , and please comment or contact me if you like the script or have any questions/suggestions for future improvements. Thanks!
I will continually work on this indicator, so please share your experience and feedback as it will enable me to make even better improvements. Thanks to everyone that has already contacted me regarding my scripts. Your feedback is valuable for future developments!
-----------------
Disclaimer
Copyright by Zeiierman.
The information contained in my scripts/indicators/ideas does not constitute financial advice or a solicitation to buy or sell any securities of any type. I will not accept liability for any loss or damage, including without limitation any loss of profit, which may arise directly or indirectly from the use of or reliance on such information.
All investments involve risk, and the past performance of a security, industry, sector, market, financial product, trading strategy, or individual’s trading does not guarantee future results or returns. Investors are fully responsible for any investment decisions they make. Such decisions should be based solely on an evaluation of their financial circumstances, investment objectives, risk tolerance, and liquidity needs.
My scripts/indicators/ideas are only for educational purposes!

Dual SuperTrend, Ichimoku and DMI Color Weighted by DGTThis study interprets SuperTrend with Ichimoku Cloud, one of the popular technical analysis indicator, and interprets Directional Movement (DMI), which is another quite valuable technical analysis indicator.
Then combines the interpreted SuperTrend with interpreted Directional Movement (DMI) and Volume Based Colored Bars indicator created by Kıvaç ÖZBİLGİÇ (permission has been granted from the author)
Here are details of the concept applied
1- SuperTrend Line colored based on Ichimoku Cloud
Definition
The Ichimoku Cloud, developed by Goichi Hosoda and published in the late 1960s, is a collection of technical indicators that give it a unique capacity to show support and resistance levels, momentum and trend direction
What Does the Ichimoku Cloud Tells?
The overall trend is up when price is above the cloud, known as Kumo Cloud, down when price is below the Kumo Cloud, and trendless or transitioning when price is in the Kumo Cloud
When Senkou Span A (Leading Span A) is rising and above Senkou Span B (Leading Span B), this helps confirm the uptrend and space between the lines is typically colored green. When Senkou Span A is falling and below Senkou Span B, this helps confirm the downtrend. The space between the lines is typically colored red
Traders often use the Kumo Cloud as an area of support and resistance depending on the relative location of the price. The Kumo Cloud provides support/resistance levels that can be projected into the future. This sets the Ichimoku Cloud apart from many other technical indicators that only provide support and resistance levels for the current date and time
Crossovers, also known as TK Cross among Ichimoku Cloud traders, are another way the indicator can be used. Watch for the Tenkan-Sen Line, or Conversion Line, to move above the Kijun-Sen Line, or Base Line, especially when price is above the Kumo cloud. This can be a powerful buy signal. One option is to hold the trade until the Tenkan-Sen drops back below the Kijun-Sen Line. Any of the other lines could be used as exit points as well.
With this study:
Allow Traders to use the Ichimoku Cloud in conjunction with other technical indicators to maximize their risk-adjusted returns
The Ichimoku Cloud can make a chart look busy with all the lines. To Remedy this a different approach is applied in this study showing the Price and the Kumo Cloud relation as well as TK Crosses displayed. The SuperTrend Indicator is chosen to display Ichimoku Indicator, where the SuperTrend is another trend following indicator.
How it works:
SuperTrend Line is colored as:
Green when the Price is above the Kumo Cloud
Red when the Price is below the Kumo Cloud
Black when the Price is within the Kumo Cloud
And Finally Blue when the Kumo Cloud Is not ready to be drawn or not Kumo Cloud available
Additionally intensity of the colors used in all cases above are defined by values of Tenkan-Sen and Kijun-Sen Line, which allows us to detect TK Crosses
2- Plots Colored Directional Movement Line
Definition
Directional Movement (DMI) (created by J. Welles Wilder ) is actually a collection of three separate indicators combined into one. Directional Movement consists of the Average Directional Index (ADX) , Plus Directional Indicator (+D I) and Minus Directional Indicator (-D I) . ADX's purposes is to define whether or not there is a trend present. It does not take direction into account at all. The other two indicators (+DI and -DI) are used to compliment the ADX. They serve the purpose of determining trend direction. By combining all three, a technical analyst has a way of determining and measuring a trend's strength as well as its direction.
This study combines all three lines in a single colored shapes series plotted on the top of the price chart indicating the trend strength with different colors and its direction with triangle up and down shapes.
What to look for
Trend Strength : Analyzing trend strength is the most basic use for the DMI. Wilder believed that a DMI reading above 25 indicated a strong trend, while a reading below 20 indicated a weak or non-existent trend
Crosses : DI Crossovers are the significant trading signal generated by the DMI
With this study
A Strong Trend is assumed when ADX >= 25
Bullish Trend is defined as (+D I > -DI ) and (ADX >= 25), which is plotted as green triangle up shape on top of the price chart
Bearish Trend is defined as (+D I < -DI ) and (ADX >= 25), which is plotted as red triangle down shape on top of the price chart
Week Trend is assumed when 17< ADX < 25, which is plotted as black triangles up or down shape, depending on +DI-DI values, on top of the price chart
Non-Existent Trend is assumed when ADX < 17, which is plotted as yellow triangles up or down shape, depending on +DI-DI values, on top of the price chart
Additionally intensity of the colors used in all cases above are defined by comparing ADX’s current value with its previous value
3- Volume Based Colored Bars indicator created by Kıvaç ÖZBİLGİÇ
Volume Based Colored Bars colors the bars into volume weighted signals increasing the visibility of the Volume changes. Intensity of the colors of the bars varies according to average value of the volume for given length of bars (default value set to 30 bars)
Disclaimer: The script is for informational and educational purposes only. Use of the script does not constitutes professional and/or financial advice. You alone the sole responsibility of evaluating the script output and risks associated with the use of the script. In exchange for using the script, you agree not to hold dgtrd tradingview user liable for any possible claim for damages arising from any decision you make based on use of the script

Consolidation Zones - LiveHello Traders!
This is the script that finds Consolidation Zones in Realtime.
How it works?
- The script finds highest/lowest bars by using "Loopback Period"
- Then it calculates direction
- By using the direction and highest/lowest bar info it calculates consolidation zones in realtime
- If the length of consolidation area is equal/greater than user-defined min length then this area is shown as consolidation zone
- Then Consolidation Zone extends automatically if there is no breakout
if you increase the Loopback Length then you get bigger consolidation zones:
You have option to "Paint Consolidation Area" or not:
Enjoy!

Bayesian BBSMA OscillatorSometime ago (very long ago), one of my tinkering project was to do a spam or ham classification type app to filter news I'd wanna read. So I built myself a Naive Bayes Classifier to feed me my relevant articles. It worked great, I can cut through the noise.
The hassle was I needed to manually train it to understand what I wanna read. I trained it using 50 articles and to my surprise, it's enough.
Complexity Theory
I've been reading a book called The Road to Ruin by Jim Rickards. He described how he got to his conclusion of how the stock market works by using Complexity Theory. Bill Williams would agree. Jim tells us that by using just enough data, we calculate the probability of an event to occur. We can't say for sure when but we know it's coming. This was my light bulb moment.
While Jim talks much about Bayesian Inference in which a probability of an event can always be updated as more evidence comes to light, I had my eyes set on binary probabilities of when prices are going up and down.
Assumptions
These are my assumptions:
Prices breaking up a Bollinger basis line will have fuel to go up even higher
Prices will go down when prices have broken up a Bollinger upper band
Scalping is the main method so we should use a lower period Moving Average (MA)
When prices are above MA, it's likelier a correction to the downside is imminent
When prices are below MA, it's likelier a correction to the upside is imminent
Optimize parameters for 1 hour timeframe which will give us time to react while still having more opportunities to trade
Building Blocks
Jim Rickards started with limited data (events) while in technical trading, data are plentiful. I decided to classify 2 events which are:
Next candles would be breaking up
Next candles would be breaking down
Key facts:
We won't know for sure when prices are going to break
We won't know for sure how much the prices movements are going to be
Formulas
Breaking up:
Pr(Up|Indicator) = Pr(Indicator|Up) * Pr(Up) / Pr(Indicator|Up) * Pr(Up) + Pr(Indicator|Down) * Pr(Down)
Breaking down:
Pr(Down|Indicator) = Pr(Indicator|Down) * Pr(Down) / Pr(Indicator|Down) * Pr(Down) + Pr(Indicator|Up) * Pr(Up)
Reading The Oscillator
Green is the probability of prices breaking up
Red is the probability of prices breaking down
When either green or red is flatlining ceiling, immediately on the next candle when the probability decreases go short or long based on which direction you're observing - Strong Signal
When either green or red is flatlining ceiling, take no action while it's ceiled
Usually when either green or red is flatlining bottom, the next candle when the probability increases, immediately take a short long position based on the direction you're observing - Weak Signal
When either green or red is flatlining bottom, take no action while it's bottomed
Alerts
Use Once per Bar option when generating alerts.

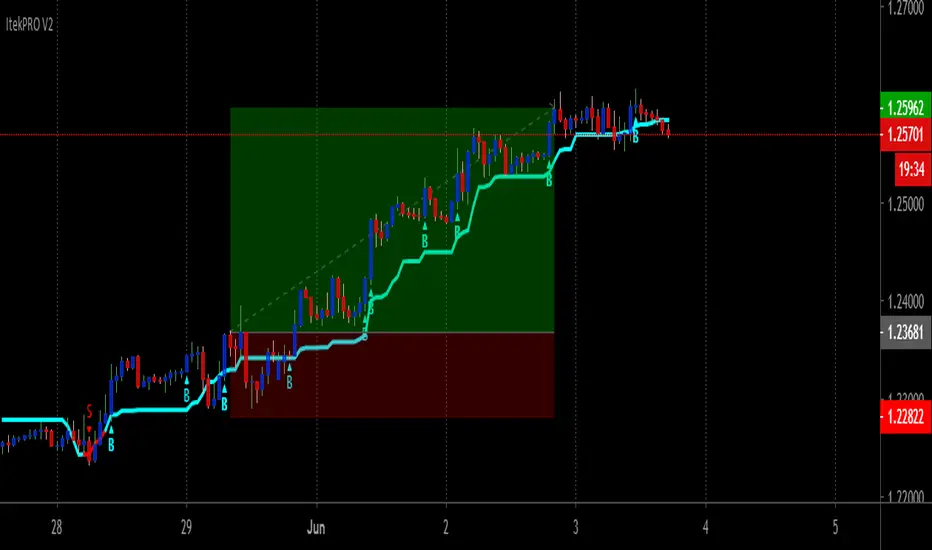
ItekPRO V2Itek PRO V2 Is An New Version of Iteksignal Trading System With Multiple BUY/SELL Entries And Exits That Can Be Used On Any Market!
An efficient way to Trade Manually Rule-Based and safely is with Itek PRO V2, a price action trend continuation Systen Trading.
GREAT for Swing Traders, Position Traders, or Investors. Works on Forex, Crypto, Stocks, Commodities.
This powerful indicator will work on just about ANY symbol and chart so that you can capture either smaller moves, or larger moves.. find the right symbol and time frame for your style of trading and use this amazing strategy to pull profitable trades.
TREND Direction and Trend Turns Are Clearly Indicated With The Built In Color-Coded Trend Line Indicator
When the trend line is BLUE the trend is headed UP, when its RED the trend is headed DOWN, when the trend line is flat it may indicate sideways conditions. The potential TREND TURNS can be seen by the change in the SLOPE and confirm by the change in the COLOR.
Signals produced by the indicator are very easy to read, completely Non-Discretionary.
Here’s How It Works
Entry Signals
Once Itek PRO V2 indicator has spotted an entry point, it clearly displays a Buy or Sell Signal on your chart, showing you exactly where possible entry to continue with the trend or start a new one.
Trade Setup Definitions
· Signal bar: It is the closed bar where the indicator is plotted (Blue or Red dots) in the chart.
· Entry bar: The first bar after the signal bar that reach the high of the Signal bar.
Setup Entry Rules
· Rule 1: Wait for the Signal bar closes. Enter the Long trade 1-2 pips above the high of the signal bar (Opposite for Short).
· Rule 2: If the HIGH of Signal Bar is near an important resistance level enter the trade 1-2 tick above resistance.
cATRpillerThis indicator is used to identify range breakouts using an ATR multiplier. My first script, Im sure there are indies out there like this, but this my favorite way to identify breakouts and trends.

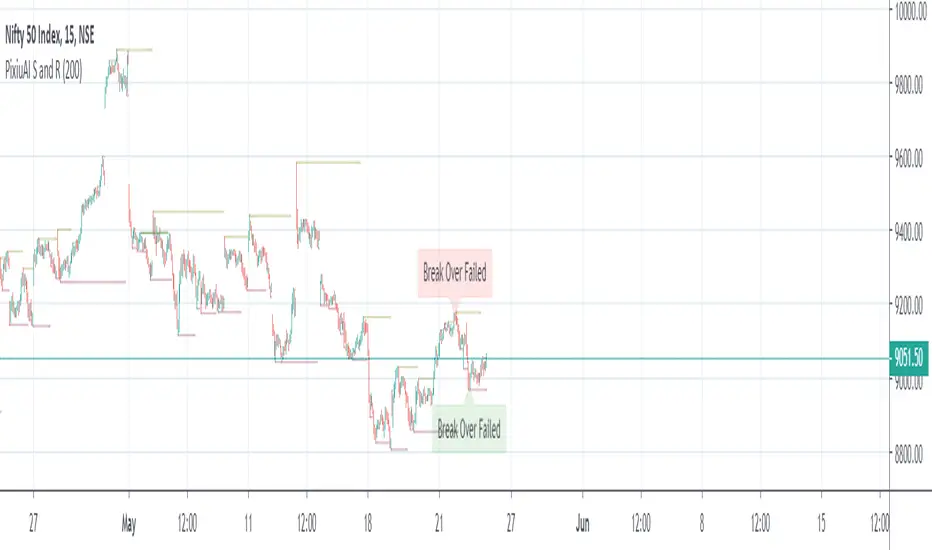
Pixiu AI - Support and ResistanceSupport and Resistance prices are the previous points of highs and lows in the price. The market tends to stick around in price regions and directional trends. Using these price points one can wait and take the following decisions:
- when the price reaches the support point, they can take a long position if they observe the price staying in the price range and make profits from till it gains back up to the resistance point. (and vice-versa)
- when the price breaks the support/resistance (S&R) points and continues in that direction in addition to high volumes supporting it, people can take a bullish trade
- when the price breaks the S&R point, traders can wait for the price to return to the S&R point to make a final decision of whether it wants to go up or not. A price tested strategy is considered stronger than just price breaks
We at The Pixiu want to help you in your daily trade, and therefore we present you an auto Support and Resistance indicator that also highlights the points of crossovers to the users in the live market. Use this for assistance while trading and share your feedback with us.
There are 3 parameters for the indicator:
- Short-range S&R
- Mid-range S&R
- Identify the point of S&R testing (when price crosses over and returns back in the range)
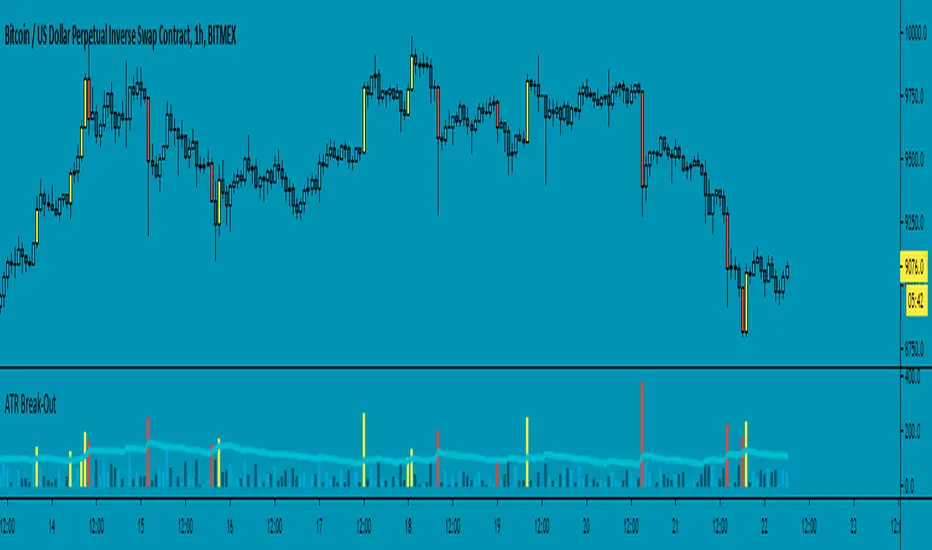
ATR Break-Out - evoThis script measures candle length and average true range (ATR). A break out occurs when a candle is larger than the given ATR value. You can choose to calculate length from wicks or from the body (open & close).
You can use this as trend direction indicator by following the last break out candle or open a position after a break out with a stop just above or below the candle. Enjoy!
Ranged Candle Length - evoSimilar to one of my previous scripts 'Ranged Volume', but instead of using volume, this script uses candle length mirrored. It creates a range using highest and lowest of a given period. When the range gets larger, it means the current candle is bigger than the largest candle of your given period (break-out).
Yellow = Bullish break out
Red = Bearish break out
A good way to use this is to follow the direction of the last break-out candle or open a position with a stop just below or above the candle (that's how I tested it real time).
Good luck!

Renko AccelerationRenko is a very useful charting method for analyzing stock movement. It does a great job of filtering out all the excess noise so that all we're left with is pure price action. But, what about time? Time is a fundamental part of chart analysis and we are only seeing part of the picture. After all, shouldn't we take a very different approach to trading signals from a block that renders in 2 seconds as opposed to a block that renders in 30 minutes?
This indicator provides the best of both worlds, enabling us to correlate the passing of time with price movement and clearly see when squeezes and breakouts occur.
As the indicator turns up to green we can see that volatility is on the move and the market is accelerating (breakout), and as it turns down to red the market is stagnating (squeeze). There is also an alternate 'Precise' view which renders the exact time per block for more granular analysis.

Ranged Volume - evoA simple script that shows mirrored regular volume bars with the purpose to show break-outs and low volume ranges, using highest and lowest of a few bars back.
Use Heikin Ashi function to smooth the colors with the trend.

ORB- Range break outThis script has below features
> Option to choose the bar number for considering break out
> Option to choose the targets based on the candle size
> Option to choose the budget and based on that it will show the quantity to trade
> SL is the candle range
> Can use it in any time frame

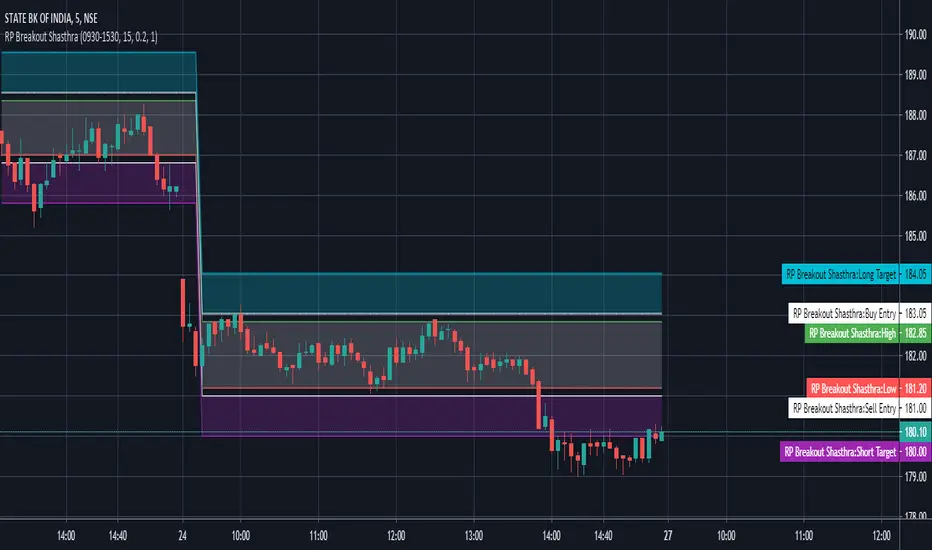
Breakout Shasthra with buffer and target option by RPThe RP Breakout Shasthra indicator is designed to show custom breakout levels.
There are many ORB (Opening range breakout) indicators which either take 9:15 as the default start time and the resolution is also fixed.
There are many successful breakouts like 10:15 - 30mins breakout, 12:30 - 1 hour breakouts etc.
So this indicator is designed to deliver you custom options to set the beakout time and duration.
Also there is an option to plot previous breakout lines to backtest.
The options window is simple.
In the INPUT Tab
Breakout start time - This is set to default sessions. Here you only need to select the start time.
Breakout Timeframe - The duration to consider can be set here.
Enter Buffer - Set the point above which to take entry. Use Keyboard to enter decimals
Enter Target - Set the point for target to take exit. Use Keyboard to enter decimals
Example:- If you wanted 11:30 - 15 mins breakout. Change Breakout start time from 9:15 to 11:30
Change Breakout Timeframe from 60 to 15
And hit OK.
In the Styles Tab
You can customize the color