BTC Aggregate USD Volumeaggregated USD volume of BTC from Bittrex, Poloniex, OkCoin, Gemini, Binance, Bitstamp, Kraken, Bitfinex, Bitmex (leveraged), and Coinbase
Btc!

Current volatilityHello everyone.
Today an other small indicator that show the current volatility .
It works on all tickers ( crypto-currencies / others ) .
Method :
- ((high-low) * 100) / open
Hope it will be useful for you :)

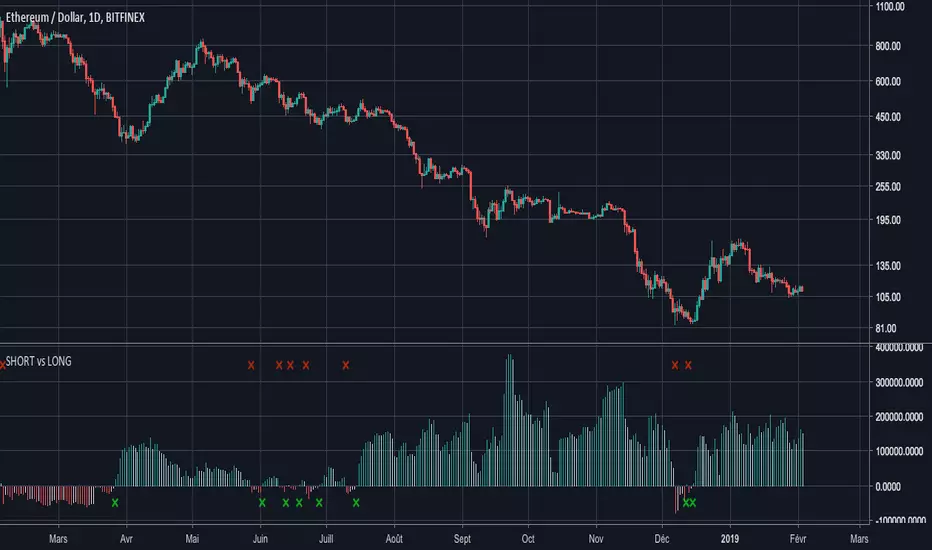
ETHUSDSHORTS - ETHUSDLONGS : balance of powerHello everyone,
I noticed that many people try to compare SHORTS and LONG positions (see:ETHUSDSHORTS and ETHUSDLONGS ), and the available indicators don't sufficiently highlight the balance of power .
That's why I programmed this indicator to answer this need ( which I also have ! ).
His ETHUSDSHORTS - ETHUSDLONGS crossover indicator e of power
I think you will understand quickly how it works, it's easy :
- If the histogram is negative, the color is red and that means that there are more BTCUSDSHORTS than ETHUSDLONGS
- If the histogram is positive, the color is green and that means that there are more ETHUSDLONGS than ETHUSDSHORTS
A small cross (red or green) appears when the power balance is reversed.
Have a good day.
Coinmarketcap - Live CryptoMarketCap TOP 20Hello everyone,
I hope you are fine.
Today an other important indicator : the TOP 20 crypto market cap !
It's better if you use it on BTC/USD to have more historical data.
Next cryptocurrencies have been used for this indicator :
BTC
ETH
XRP
EOS
BCH
LTC
USDT
TRX
XLM
BSV
ADA
BNB
XMR
IOTA
DASH
NEO
ETC
XEM
USDC
ZEC
Thank you and have a good day :)

BTCUSDSHORT - BTCUSDLONG : balance of powerHello everyone,
I noticed that many people try to compare SHORTS and LONG positions (see: BTCUSDSHORTS and BTCUSDLONGS ), and the available indicators don't sufficiently highlight the balance of power .
That's why I programmed this indicator to answer this need ( which I also have ! ).
His name is : BTCUSDSHORT - BTCUSDLONG crossover indicator
I think you will understand quickly how it works, it's easy :
- If the histogram is negative, the color is red and that means that there are more BTCUSDSHORTs than BTCUSDLONG
- If the histogram is positive, the color is green and that means that there are more BTCUSDLONDS than BTCUSDSHORTS
A small cross (red or green) appears when the power balance is reversed.
Have a good day.
EDIT 03/02 : Title has been changed

[ALERTS] CMYK-RMI-TRIPLE IIThis is the same previous script but without the Deribit index (for BITMEX users for example) that can give problems due to no connection with any of the 6 exchanges. Now use 'close' as source.
BTCUSD, XBTUSD, ...
Best time frame: 5 minutes
Alerts: 'once per bar'

Bitstamp BTC Horizontal 200 Week SMAsmall change to my horizontal 200 week SMA script.
Plots the latest 200 week SMA value from Bitstamp BTCUSD on the chart. I use it for the Bitmex chart, as Bitmex doesn't have enough history for a 200 week moving average.

Buy The Dip - Does It Work?Buying the dip has become a meme in crypto, but does it actually work?
Using this script you can find out.
The dip is defined here as the average true range multiplied by a number of your choosing (dipness input) and subtracted from the low.
When price crosses under the dip level, a long is initiated. The long is then closed using a timestop (default value 20 bars), no fancy exits here.
A general rule for buying the dip should be to be more passive in a bull market and aggressive in a bear market.
Same goes for all counter trend trading.
Heres a few other examples of dip buying statistics using the H4 timeframe:
50% profitable, 1.692 Profit Factor
BINANCE:PIVXBTC
56.52% profitable, 1.254 Profit Factor
BINANCE:KMDBTC
27.27% Profitable, 0.257 Profit Factor... yikes!
BINANCE:BTSBTC
73.33% Profitable, 13.627 Profit Factor... o.O
BINANCE:MANABTC


STOCH MACD SAR RSI V2 ALERTS 15M// Alerts based on Stochastic Oscillator ( STOCH ), Moving Average Convergence / Divergence ( MACD) , Parabolic Stop and Reverse (PSAR) and Relative Strength Index (RSI)
// In the second version RSI added
// Adapted for15M time frame
// Created and based on Binance chart
// Working with comission
// No repaints

STOCH MACD SAR RSI V2 STRAT 15M// Strategy based on Stochastic Oscillator ( STOCH ), Moving Average Convergence / Divergence ( MACD ), Parabolic Stop and Reverse (PSAR) and Relative Strength Index (RSI)
// In the second version RSI added
// Adapted for15M time frame
// Created and based on Binance chart
// Working with comission
// No repaints

CryptoField - TREND Mode indicatorThe CryptoField TREND Mode indicator identifies the trend direction (uptrend or downtrend) and the mode (trending or sideways) of the market.
Uptrend when green
Downtrend when red
Sideways when orange
Trending when green or red
Basically the indicator works like a double moving average, but the algorithm reacts faster on movements and it tolerates "noisy"/volatile markets better which makes it more effective on crypto markets.
It can be applied to strategies or other indicators as a trend direction or market mode filter.

Powerfull strategy MACD + RSI + Stoch buy on High exit on ATRMy strategy uses a combination of three indicators MACD Stochastic RSI .
The Idea is to buy when ( MACD > Signal and RSI > 50 and Stochastic > 50) occures at the same time the BUY STop we place on previous day HIGH
We exit on Take profit or Stop loss which is calculated by ATR (10) or on the opposite signal "Volatility breakout"
This strategy works well on stocks, commodities and cryptos especially during market breaking up after consolidation
The best results are on Daily charts , so its NOT a scalping strategy. But it can work also on 1H charts.
The strategy does not have any stops and profit targets, so we can take all the market can give us at the moment.
The exit point only when MACD goes under Signal
Its Preformance is significantly better with "buy stop on High.1" idea and exit on "volatility price breakout"
So, use it, trade it.
If it will help you to imprive your trading results, please donate me
BTC: 12kd1F8buWisUBdq27BBwRkUvzW7Ey3og5


GRID RELOADED 1.0Script for grid trading on Bitmex XBTUSD 5min
A quick description for the input parameters. I can detail privately the ones that are important:
Points between two same dir trades = how much the price must change before a new DCA can happen
Points between SHORTS = same for short trades
Global Take Profit points = take profit for all open positions expressed in the same units as the price
Global Stop Loss points = same as for profit
Take Profit points decrease per bar = this is how much the target global profit decreases each bar toward zero
Trend up to start a trade long = wait for the DEMA to show a long slope before opening new long positions
Max long position = max n. of long positions
Check trend on trade = wait for a positive/negative bar before long/short
Min Stochastic overbought/sold for trade = wait for the stochastic to be below/above this before long/short
Limit Orders long % below close price = place limit orders % before current price. the order could be left pending.
DEMA 1 Length = periods of DEMA for trends
HA Candles = toggle a pattern match to enter trades

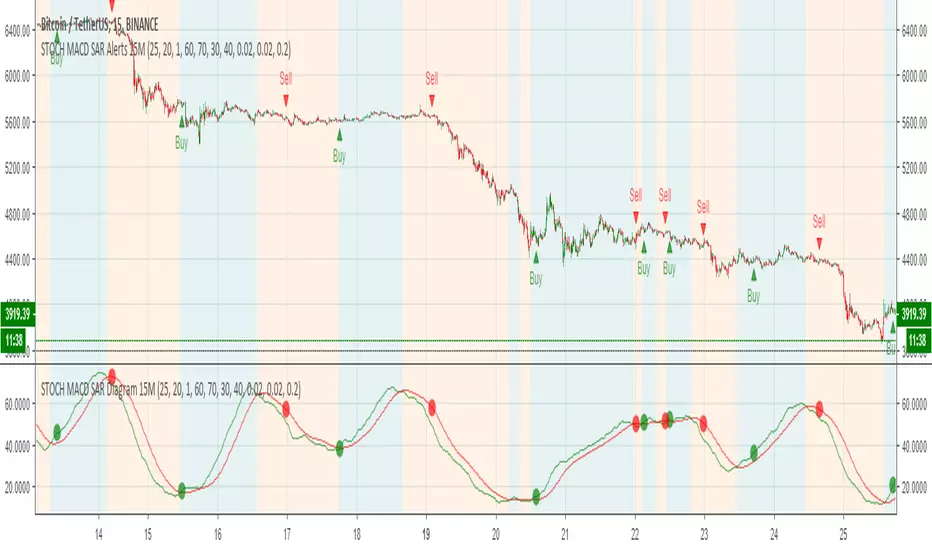
STOCH MACD SAR Alerts 15M// Alerts based on Stochastic Oscillator (STOCH), Moving Average Convergence / Divergence (MACD) and Parabolic Stop and Reverse (PSAR) Strategy
// Adapted for15M time frame
// Created and based on Binance chart
// Working with comission
// No repaints
STOCH MACD SAR Strategy 15M// Strategy based on Stochastic Oscillator (STOCH), Moving Average Convergence / Divergence (MACD) and Parabolic Stop and Reverse (PSAR)
// Adapted for15M time frame
// Created and based on Binance chart
// Working with comission
// No repaints

RSI EMA Alerts 15M+// Alerts based on Relative Strength Index ( RSI ) and Exponential Moving Average ( EMA ) Strategy
// Greatest effect on 15M+ time frame
// Created and based on Binance chart
// Working with comission
// No repaints

CCI × MACD SIGNALThis is a script that displays entry points using "CCI" and "MACD".
I think that scalping will work well if I use "FXBTCJPY" 1 minute as the main and it would be nice if you do not want your interests and take a little profit

RSI + Stochastic RSI Indicator CombinedFree to use RSI and Stochastic RSI, combined within one indicator.
The RSI and Stochastic RSI are two of the most commonly used and respected indicators in trading technical analysis. By placing them on top of each other you can save valuable space on your chart and stay more easily within your TradingView indicator limit.
The RSI is bright blue, with the "neutral" 30-70 chart area shaded blue.
The Stoch RSI is red and blue, with the "neutral" 20-80 chart area shaded purple.
None of the other annotations shown above will appear, they are only to demonstrate how they can be interpreted.
So what does the RSI do?
Broadly speaking, the Relative Strength Index measures the strength and movements of a market.
Above 70 the RSI is considered oversold = an increased likelihood of an incoming price drop.
Below 30 the RSI is considered undersold = an increased likelihood of an incoming price rise.
What does the Stochastic RSI do?
Broadly speaking, the Stochastic RSI measures the momentum of a market. It does this by measuring the RSI relative to its own high/low over the previous period.
Above 80 the Stoch RSI is considered oversold = an increased likelihood of an incoming price drop.
Below 20 the Stoch RSI is considered undersold = an increased likelihood of an incoming price rise.
Look for when the two Stoch RSI lines cross over - it is an important signal.
When the blue line is on top we have momentum driving the price up; when the red line is on top we have momentum driving the price down.
The key here is to look for periods where both the RSI and Stoch RSI are both low at the same time (especially on the daily chart) = an extremely promising entry point to catch a move up. Equally, looking for periods where both the RSI and Stoch RSI are very high is likely a good exit point (or at least a time to make absolutely certain you have a suitable stop-loss in place), because a price drop is likely not far away.
Remember: the Stoch RSI does not always fluctuate cleanly between the top and bottom. At any time it can change direction to reflect market conditions, which is why a stop loss is essential at all times. Equally, just because the RSI or Stoch RSI is at 100, it is still possible for it to keep going up due to whale action or traders FOMOing in. The same applies at low levels. Both these indicators represent historical data and therefore are not strictly predictive in nature, but show trends that may be in action.
Please give me a thumbs up and follow me if you found this useful. This tool is for educational purposes only and not a recommendation to buy or sell. Always do your own research before trading. Make sure to add this to your favourite scripts.
Best wishes,
BCryptological
ps - combine this powerful indicator with knowledge of strong support and resistance points with the 50/100/200 Moving Average . This will help you identify likely entry/exit points to maximise the accuracy of your predictions.


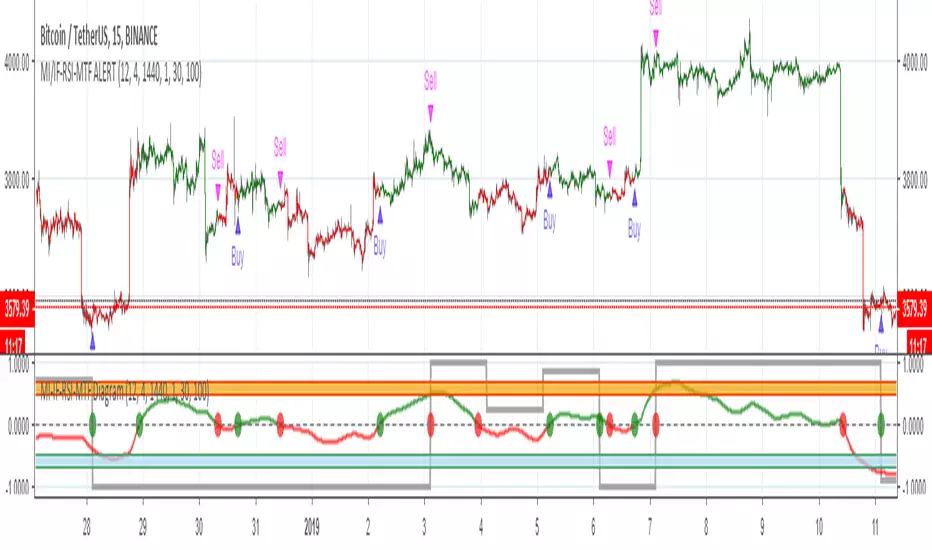
MOMENTUM INDICATOR / INVERS FISHER / RSI / MTF / ALERT// Alerts based on Momentum indicator and Inverse Fisher transform with Multi Time Frame function on Relative Strength Index (RSI)
// Greatest effect on 15M+ time frame
// Created and based on Binance chart
// Working with comission
// No repaints
MOMENTUM INDICATOR / INVERS FISHER / RSI / MTF / STRAT// Strategy based on Momentum indicator and Inverse Fisher transform with Multi Time Frame function on Relative Strength Index (RSI)
// Greatest effect on 15M+ time frame
// Created and based on Binance chart
// Working with comission
// No repaints
