Momentum Strategy for cryptos (V7.B.4)Here's a strategy for low time frames (30min suggested) for BTC, based on momentum Analysis using Stochastic RSI
By default the strategy will use the 50% of the specified capital for each trade; if "Gamble Sizing" is enabled, it will add the specified amount of capital (25% by default, until reaching the 100% limit or lower) for the next trade after having detected a loss in the previous trade; if the next trade is successful, the size for the next trade comes back to 50%
• Trend Filter LONG: If the fast exponential moving average is UNDER the slow exponential moving average, it won't open LONG positions
• Trend Filter SHORT: If the fast exponential moving average is ABOVE the slow exponential moving average, it won't open SHORT positions
• Bars delay: the strategy will wait the specified amount of bars before closing the current position; the counter is triggered as soon as the closing trade condition is verified
BY MAKING USE OF THIS STRATEGY, YOU ACKNOWLEDGE AND AGREE THAT: (1) YOU ARE AWARE OF THE RISKS ASSOCIATED WITH TRANSACTIONS OF DIGITAL CURRENCIES AND THEIR DERIVATIVES; (2) YOU SHALL ASSUME ALL RISKS RELATED TO THE USE OF THIS STRATEGY AND TRANSACTIONS OF DIGITAL CURRENCIES AND THEIR DERIVATIVES; AND (3) I SHALL NOT BE LIABLE FOR ANY SUCH RISKS OR ADVERSE OUTCOMES.
BTCUSDT

Bitcoin Binance Sentiment IndexThe divergence of the price between the futures and spot markets for perpetual contracts could be a gauge of sentiment on a traded cryptoasset.
Sentiment analysis could be used to improve the the predictive value of technical and fundamental analysis.
The price of the perpetual contract is divided by the spot price for Bitcoin on Binance and two simple moving averages of this ratio are plotted together. For graphical purposes, the ratio between the two prices has been multiplied by 100. The moving averages were chosen arbitrarily and can be changed. Values above 100 mean that the average price of the futures over the last x periods was above the spot price over the same period. Conversely, values below 100 mean that the mean price of the futures over the last x periods was below the spot price over the same period. The indicator has been created for a daily timeframe.
This indicator is clearly intended for educational purposes only and does not constitute investment advice.
If you are interested in updates on this indicator or interested on sentiment analysis, put a like, subscribe or contact me in pm.
BIO

GBTC Fomo Panic PremiumIt is rumored that GBTC price action leads the Bitcoin market. This indicator compares GBTC fomo/panic levels to the (Binance) BTC spot market. Fomo is measured as large percentage moves of the high price from the min over a look-back period. Panic is measured as large percentage moves of the low price from the max over a look-back period. A prime example of this indicator's usage would be as a sell signal confirmation during the 2020 pre-Thanksgiving panic exhibited on the 1-hour chart while the 20 EMA was still above the 99 SMA.
You can customize the leading and lagging markets and the length of the lookback period. I would love to hear what parameters, markets and timeframes work for you. Maybe there is a way to leave comments, or hit me up on Twitter: @thirdreplicator
May you profit and enjoy.

Crypto ZigZag RSI strategy 15minThis strategy is designed for crypto markets like ETHUSD/T, BTCUSD/T and so on.
It works amazingly with 15 min time frames.
Its idea consists in :
We have the RSI indicator, and with it we check for the crossover with overbought and oversold levels. At the same time we have the zigzag which is made from the higher highs and the lower lows between a specific price movement in %.
For entries, they are going to be based on the crossover of rsi with overbought or oversold levels , combined together with cross over 0 line from the the zigzag.
At the same time the strategy has the posibility to go only long, only short or both.
Let me know if you have any questions.

Bitcoin (BTC) Scalp / Short-term Short IndicatorThe purpose of this scalping Indicator is to help identifying Sell signals for short term trades on Bitcoin (Spot, Features, etc.) .
This script is working with more indicators and everything is balanced by hard work on (back)testing.
Result for users is a simple signal to SELL.
You can use it as easy indicator in your graph or create alerts.
I have the best results on 1min graph, with leverage and stop-loss feature.
This is my own version of scalping Sell Script / Indicator, which is a combination of few indicators, for example RSI , BB and price levels (actual and average) and works on standard candles.
SELL signal paints above the candle and you can set your target / trailing / stop-loss in the settings and check how it works in Strategy Tester.
Settings of this Indicator:
Take Profit
Stop Loss
Trailing Stop Loss
Trailing Stop Loss Offset
Initial Capital
Base Currency
Order size
Pyramiding
Commissions
Slippage
Average price lines (colors and visibility)
Plot background
These signals can be often observed at the beginning of a strong move, but there is a significant probability that these price levels will be revisited at a later point in time again.
Therefore these are interesting levels to place limit orders.
A Sell signal is defined as the last up candle before a sequence of down candles.
In my trading settings I have more but small positions, one safety limit order (for price averaging = better entry - easier close in profit) and stop-loss.
Sometimes trailing-profit feature have very nice profits.
Settings depends on your own money-management and free capital.
Don't ignore UP / DOWN trend. For UP trend I have an Indicator too (check my profile).
In addition to the upper/lower limits of each line, also average value is marked as this is an interesting area for price interaction and better view.
PM me to obtain access, more informations or support.
NOTICE: By requesting access to this script you acknowledge that you have read and understood that this is for research purposes only and I am not responsible for any financial losses you may incur by using this script.

Bitcoin (BTC) Scalp / Short-term Long IndicatorThe purpose of this scalping Indicator is to help identifying Buy signals for short term trades on Bitcoin (Spot, Features, etc.) .
This script is working with more indicators and everything is balanced by hard work on (back)testing.
Result for users is a simple signal to BUY .
You can use it as easy indicator in your graph or create alerts.
I have the best results on 1min graph, with leverage and stop-loss feature.
This is my own version of scalping Buy Script / Indicator, which is a combination of few indicators, for example RSI, BB and price levels (actual and average) and works on standard candles .
LONG signal paints below the candle and you can set your target / trailing / stop-loss in the settings and check how it works in Strategy Tester .
Settings of this Indicator:
Take Profit
Stop Loss
Trailing Stop Loss
Trailing Stop Loss Offset
Initial Capital
Base Currency
Order size
Pyramiding
Commissions
Slippage
Average price lines (colors and visibility)
Plot background
These signals can be often observed at the beginning of a strong move, but there is a significant probability that these price levels will be revisited at a later point in time again.
Therefore these are interesting levels to place limit orders.
A Buy signal is defined as the last down candle before a sequence of up candles.
In my trading settings I have more but small positions, one safety limit order (for price averaging = better entry - easier close in profit) and stop-loss.
Sometimes trailing-profit feature have very nice profits.
Settings depends on your own money-management and free capital.
In addition to the upper/lower limits of each line, also average value is marked as this is an interesting area for price interaction and better view.
PM me to obtain access, more informations or support.
NOTICE: By requesting access to this script you acknowledge that you have read and understood that this is for research purposes only and I am not responsible for any financial losses you may incur by using this script.

PT Crypto Kill ZonesVersion 1.0 of our PT Crypto Kill Zones indicator helps create a visual of specific times throughout the trading day, which we can expect volatility. The market moves within particular sessions. These sessions are broken up as such in three segments, NY, London & Asia.
Toggles -
Market Open highlights the opening of each market.
Daily Zone – highlights a period around the daily crypto candle close.
NY Open Zone – highlights a period around the NY market open.
NY Close Zone – highlights a period around the NY market close.
London Open Zone – highlights a period around the London market open.
London Open Zone – highlights a period around the London market close.
Asia Zone – highlights a period around the Asia market open.
Preferred zones are settings we came up with by running backtests to figure out which periods are close to the kill zones, which offer a better reaction.
Strategy: Use the sub 1h time-frame (30m is ideal) and scalp the London & NY zones with the PT Liquidity & PT Buy/Sell indicator.
This Oscillator was built around our buy sell & Liquidity indicator for scalping. It is included as part of the library. Just message us for access!

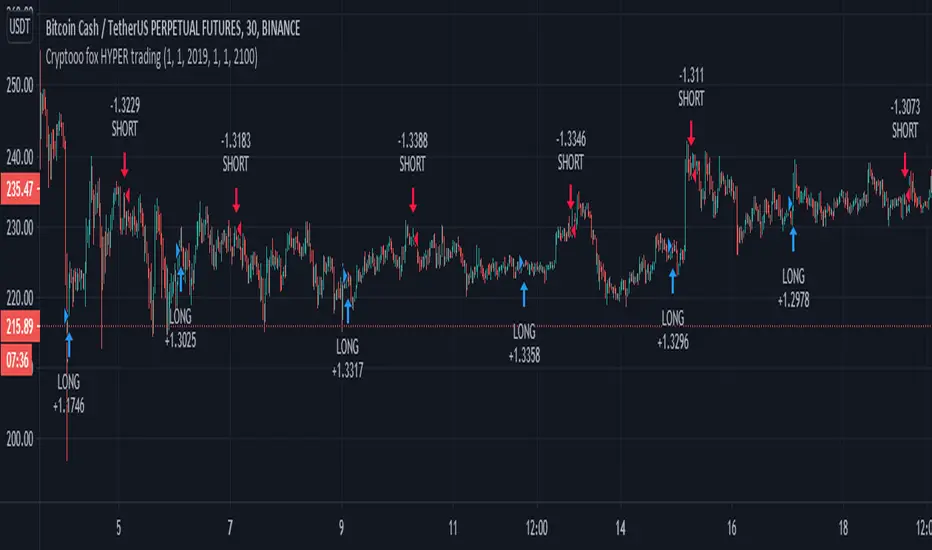
Cryptooo fox HYPER trading(CRYPTOOO FOX ( BCH ) long & short no repaint strategy)
Hello traders
- The strategy is using higher time frame but it never repaint .
- The strategy is working only in ( 10 % of equity ) you can change it as you want .
- I use 0.04 % as fees ( this future market in binance fees ) .
- I use 1000 dollar as capital ( you also can change it as your capital ) .
- The strategy is working in ( BCH / USDTP ) and ( BTC / USDTP) IN BINANCE FUTURE MARKET .
- I recommanded too much using ( 15 min , 30 min ) charts .
- This script is working in standard charts no ( heikien ashi or range ) charts .
- ( TO ACCES THIS SCRIPT PLEASE USE THE LINKS BELOW ) .
TSS Strategy TESTThis is strategy for backtesting TSSPRO script and has all settings from this indicator.
Strategy has setup for 100$ initial capital and 100% entering to each position and 0.04% exchange comission plus take-profit and stop-loss and TSS script settings.
I also have settings for 15min timeframe for BTC & ETH with annually profit ~200-300% (no leverage. i.e. x1).
You can also specify in settings:
+Take profit
+Stop-loss
+Start & end time
Annually Profit Strategy statistics for Binance BTCUSDT 4H (no leverage. i.e. x1)
2020(august) +134%
2019 +93%
2018 +135%
PM me if you want to test it.

BITCOIN Miners Revenue VS Price Correlation OscillatorUse 3D(3-day candle) as timeframe for best reading.
------
original template for Correlation indicator was created by obaranova. credit goes to her.

[2020 Updated]Bitcoin Logarithmic Growth CurvesCredit goes to the original writer of the script, Quantadelic, who generously allowed anyone to copy/edit. I adjusted the value of the bottom/top intercept and slope to better fit the March 2020 coronavirus dip.
Use Bitstamp BTCUSD for better reading.

[AngelHouse] The Monster StudyHello, I'm Angelhouse, a crypto analyst and indicator developer. :)
I would like to introduce you to the newly developed "The Monster" index.
The metric is an upgraded version of the existing "All Eating" indicator.
The index was created to refer to the plot line of the "The Monster" strategic indicator.
- The "Monster" indicator is a strategic indicator created for crypto market transactions.
- This indicator is based on a four-hour time zone and is a strategic indicator using the intersection of the threshold.
- If a plot is crossed, a call is in progress or crossed, a sales signal is generated.
For a detailed description of the indicators, see The Monster Strategy.
※ If you want to obtain access to this indicator with a script dedicated for the first time, please contact the link shown in the signature.

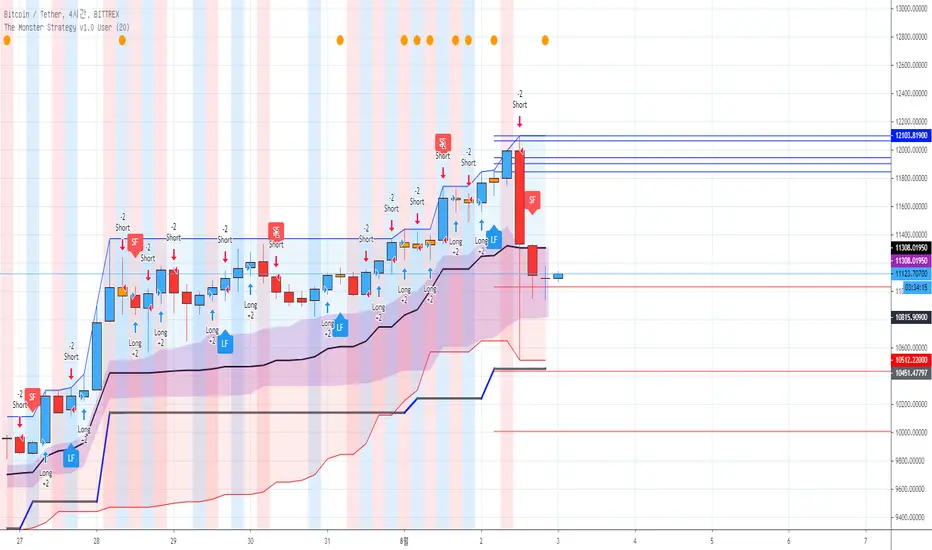
[AngelHouse] The Monster StrategyHello, I'm Angelhouse, a crypto analyst and indicator developer. :)
I would like to introduce you to the newly developed "The Monster" strategic indicators.
The indicator is an upgraded version of the existing "All Eating" strategy indicator.
- The "Monster" indicator is a strategic indicator created for crypto market transactions.
- This indicator is based on a four-hour time zone and is a strategic indicator using the intersection of the threshold.
- If a plot is crossed, a call is in progress or crossed, a sales signal is generated.
※ Explanation of the "The Monster" Strategy Indicator v1.0
1. Long & Short: You can configure your swing strategy based on the signal.
The All Eating Strategy indicator is based on a four-hour frame. Due to the logic nature, the signal does not match at a time higher than 4 hours. Therefore, we recommend that you use the indicator only in a time zone of 4 hours or less.
Also, the signal does not have 100% accuracy, so even if you configure a strategy based on the signal, it is recommended that you set the break/break line and respond.
2. Long Feel & Short Feel: The signal is also quite reliable. The strength of the signal is very reliable when a strong rise and a strong fall occur.
However, the downside is that there may be some offbeat in the transverse section. However, even if the index is offbeat, the loss is small, and if the stock price rises or falls, high expected returns can be expected.
You can use the signal alone, but if you use the Long & Short indicator, you can get better results. If the Long Feel & Short Feel signal is also generated where the Long & Short signal is generated, the probability will be higher, right?
3. Candle color: White cans are formed when cans such as dojorpoenor hammer are generated. The cans have a meaning of reversal when they occur after a strong rise or fall, and can continue the trend when they occur during an ongoing trend.
4. Single item band: The single item band consists of the strong area (blue area) and the weak area (red area) based on the reference line. Stock prices can indicate additional gains when they are in the bullish zone, and additional declines when they are in the weak zone.
Also, you can recognize the top of the strong zone as the resistance line and the bottom of the weak zone as the support line.
The cloud stand in the single band should be located in front of the band for 26 days, but it is also recognized as a role of support and resistance.
5. 1D Baseline: The line of one bar is recalled to 4 hours. blue when the reference line is positive, red when negative, and gray when horizontal, and red when the reference line is positive,
Or, in the opposite case, it's time to suspect a trend inflection.
6. Target line : When a specific period is set (default 20 days setting), the target point is provided in each of the 5 lines, from the highest point in the period to the low point of the current bar, and from the lowest point to the high point of the current bar.
※ If you want to obtain access to this indicator with a script dedicated for the first time, please contact the link shown in the signature.

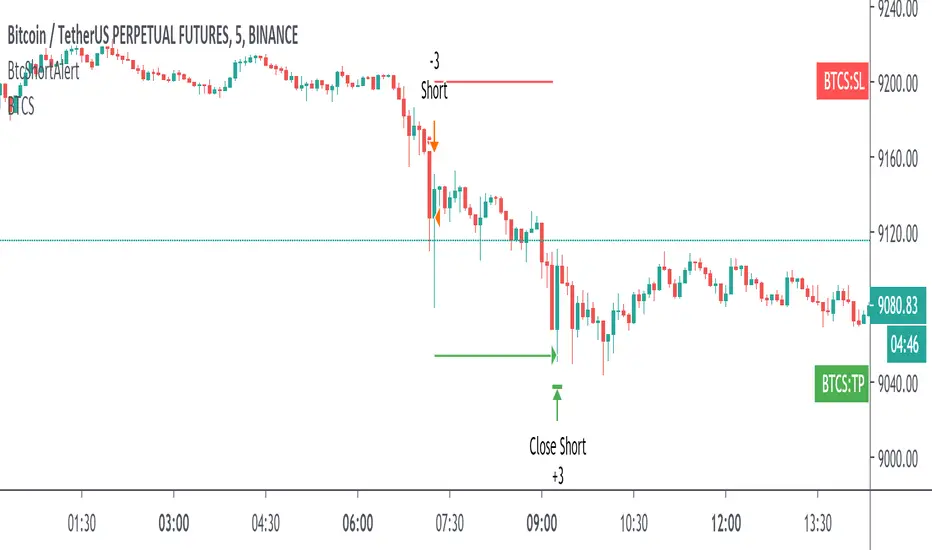
Btc Short StrategyBINANCE:BTCUSDTPERP
Developed for the btc perpetual future contract on Binance Futures .
How to Use:
It's based on a complex strategy for short positions that involves volume analysis, trend analysis, moving averages, supports and resistances and more.
Concretely this indicator opens a short position when there is a bearish trend and a breakout of a support zone and uses fear and volatility to take an edge on the market.
It runs on the 5 min chart for the entry , and it analyses higher timeframes.
It opens and close sell positions and automatically draws SL and TP. The R/R is 1:1.
It's possible to enable alerts of the strategy in order to be notified whenever the indicator opens or closes a position . You can use it in addiction of your strategy or for educational purposes .
(This indicator will be updated when/if there will be a change in the bias of the market)
Access must be given by me to test this. Once access given you can test.
PM me or use the links below to obtain access to this indicator.
Backtesting Results:
Initial Capital= 10000
Order Size= 3 contracts (max loss 2.15% of the capital)
Commission= 0.075% (same of VIP0 of binance)
Slippage=10 ticks
Reviews and Feedback are welcome.
Refer the Release notes for any updates and my posts below and in my idea page for more details.
Report any issues or ideas to me, I'll fix them !
Thank you !
DISCLAIMER:
All trading involves high risk: past performance is not necessarily indicative of future results. Hypothetical or simulated performance results have certain inherent limitations. Unlike an actual performance record, simulated results do not represent actual trading. Also, since the trades have not actually been executed, the results may have under- or over-compensated for the impact , if any, of certain market factors, such as lack of liquidity. Simulated trading programs in general are also subject to the fact that they are designed with the benefit of hindsight. No representation is being made that any account will or is likely to achieve profits or losses similar to those shown.
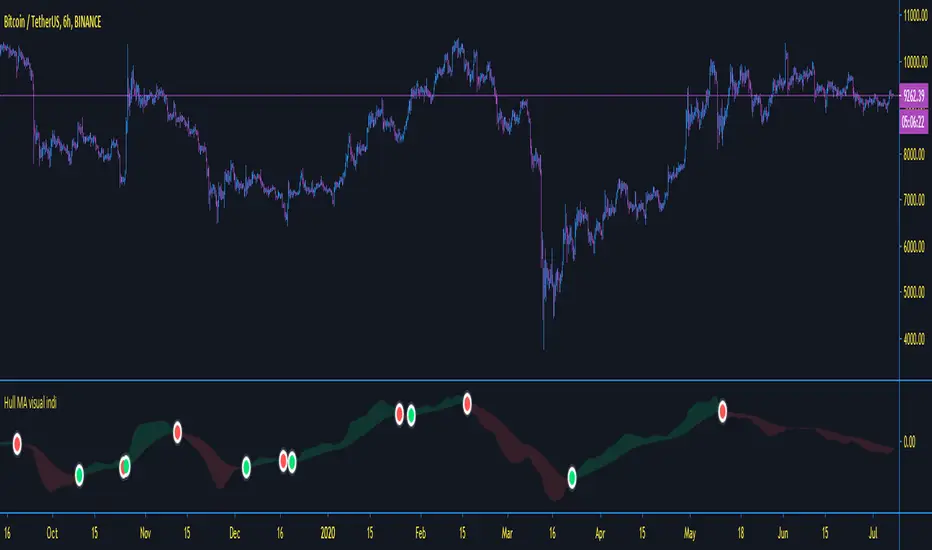
Moving Average Indicator - TradingSargentThis indicator is based on Hull Moving averages, and works best for signals on the 6 hour and above timeframe with standard settings - as always, fully adjustable from settings...
simple to use as another confirmation on your strategies -
Green = buy
red = sell
DM for access rules
Bayes Probability Index by DGTWhat is Probability?
It is a measure for calculating the chances or the possibilities of the occurrence of a random event. In simple words, it calculates the chance of the favorable outcome amongst the entire possible outcomes. Mathematically, if you want to answer what is probability, it is defined as the ratio of the number of favorable events to the total number of possible outcomes of a random events.
Is this enough? May be or may be not
Let’s consider an example,
A simple probability question may ask: "What is the probability of Amazon.com's stock price falling?"
How about if we extend our question a step further by asking: "What is the probability of AMZN stock price falling given that the Dow Jones Industrial Average (DJIA) index fell earlier?"
Now we are ready to consider conditional probability and Bayes' Theorem is where we could find answer to this question
Bayes' Theorem
Bayes' theorem, named after 18th-century British mathematician Thomas Bayes, is a mathematical formula for determining conditional probability. Conditional probability is the likelihood of an outcome occurring, based on prior knowledge of conditions or another related event occurring. Bayes' theorem provides a way to revise existing predictions or theories (update probabilities) given new or additional evidence. Bayes' theorem thus gives the probability of an event based on new information that is, or may be related, to that event
Formula For Bayes' Theorem
P(A|B) = P(B∣A) * P(A) /P(B)
= P(B∣A) * P(A) / (P(B∣A)* P(A) + P(B∣A’)* P(A’) )
where
A and B are events and P is probability
P(A|B) is the posterior probability, the probability of A after taking into account B
P(A) is the prior probability, the probability of A belief
P(A’) is the prior probability, the probability of A disbelief : P(A’)=1- P(A)
P(B) is the prior probability, the probability of B belief
P(B∣A) is the conditional probability or likelihood, the degree of belief in B given that proposition of A belief (A true)
P(B∣A’) is the conditional probability or likelihood, the degree of belief in B given that proposition of A disbelief (A false)
Bitcoin was the first-ever cryptocurrency, designed by Satoshi Nakamoto. In its likeness, all other cryptocurrencies were then created. The relationship between Bitcoin and altcoins remains something crypto analyst watch closely. This study aims to display the likelihood of bullish movement for ALTS-USDT pairs taking into consideration of bullish move probability of BTC-USDT pair
What to look for:
Percentage Value of the Conditional Probability and/or Simple Probability. When value is above %50 than bullish move is more probable, conversely when the value is below %50 bearish move is more likely
Limitations : Conditional Probability Line will be shown for daily time frame only, Simply Probability Line would be available for all time frames
Conditional Probability is calculated with the condition of BTC-USDT pair so using Conditional Probability is suggested with ALTS-USDT pairs.
Indicators aim to generate a potential signal/indication of an upcoming opportunity, but, the Indicators themselves do not guarantee the future movement of a given financial instrument, and are most useful when used in combination with other techniques.
Trading success is all about following your trading strategy and the indicators should fit within your trading strategy, and not to be traded upon solely
Disclaimer : The script is for informational and educational purposes only. Use of the script does not constitutes professional and/or financial advice. You alone the sole responsibility of evaluating the script output and risks associated with the use of the script. In exchange for using the script, you agree not to hold dgtrd TradingView user liable for any possible claim for damages arising from any decision you make based on use of the script

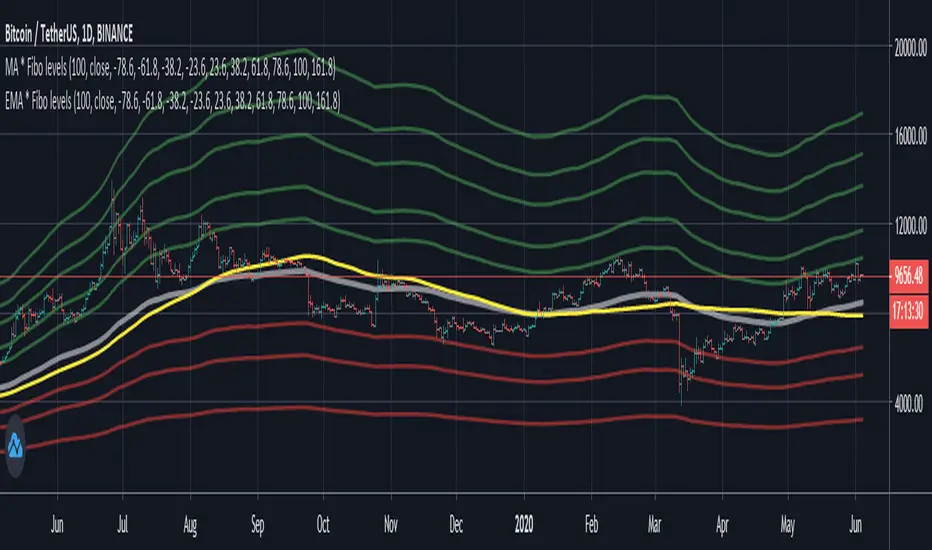
MA * Fibo levels (canal)Some updates to the scrypt "MA * Fibo levels (auto)"
In the previous scrypt we drew lines using either highs or lows of the candles due to the positiveness or negativeness of given percentages.
But, after some research it seems easier to use CANALS to buy or sell rather than LINES. So these canals are the intervals between SMA(highs) and SMA(lows) multiplied by FIBO coefficients. However, lines can be also used as stop-losses if the price goes out of the canal, and wait until the price reaches the other canal.
Good luck in trading!
If the scrypt was useful let me know!
Any feedbacks and ideas are welcomed!

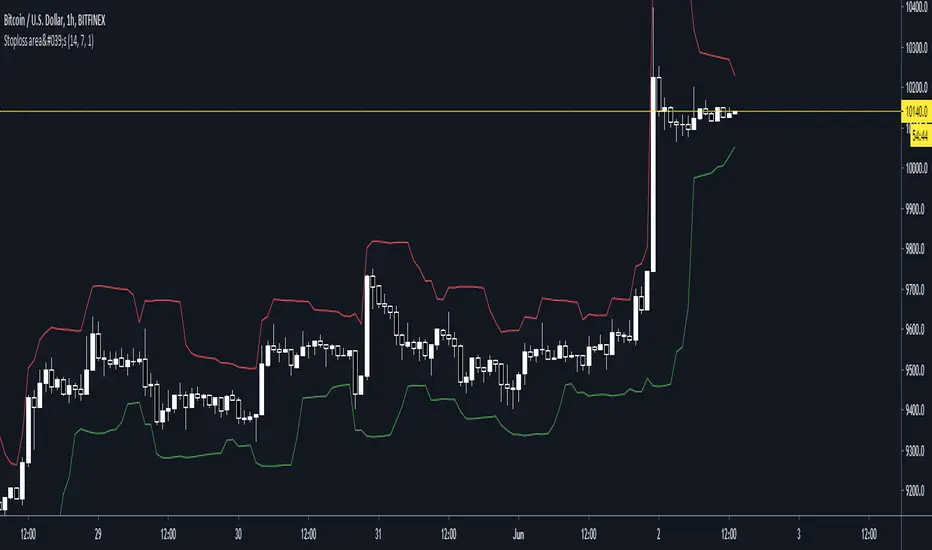
Stoploss indicatorGood for setting trailing stops and stoplosses when your taking a scalp etc, most recommended for manual trailing stops
Simple EMA trend indicatorSimple EMA trend indicator , pretty straightforward green equates to bullish and usually a retest/wick is often seen , same for the flipside viceversa


PRP - Pivot Reversal + PSAR Strategy [QuantNomad]PRP is a combination of Pivot Reversal and PSAR Strategy. With this strategy, I tried to be in a position for big moves in the market.
The strategy uses Pivot Reversal entries with an additional condition that TR of entry bar should be at least X ATRs. This allows to filter out some false signals.
For exits, I recoded the PSAR indicator as trailing stop loss. So I start PSAR Y ATRs below the Pivot level price crossed at entry. After that PSAR behaves as usual.
For stability and easier execution, I check conditions only on the close, no stop/limit orders are used.
