[astropark] SuperTrend Bollinger MAsHi Followers,
here it is a new script, based on SuperTrend indicator!
As plus you will be able to activate Bollinger Bands and 6 simple moving averages.
What's the SuperTrend?
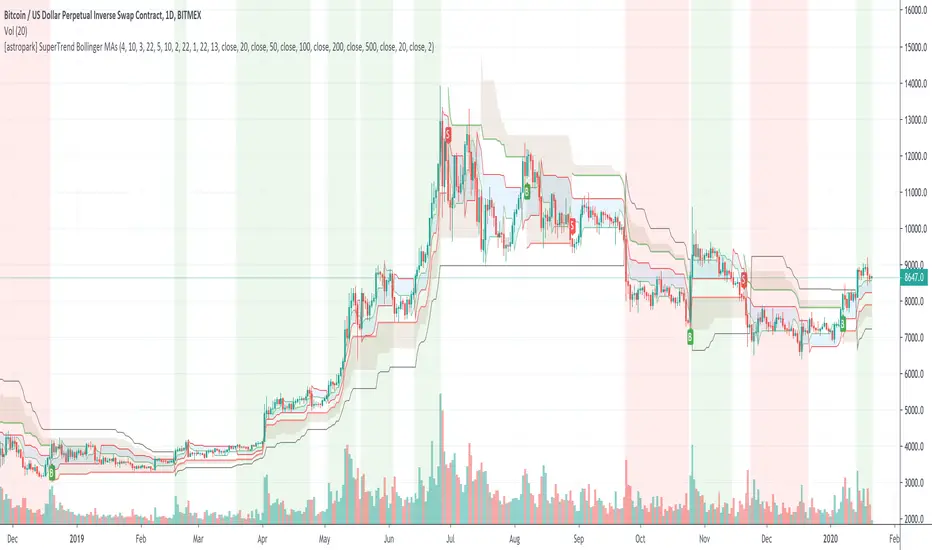
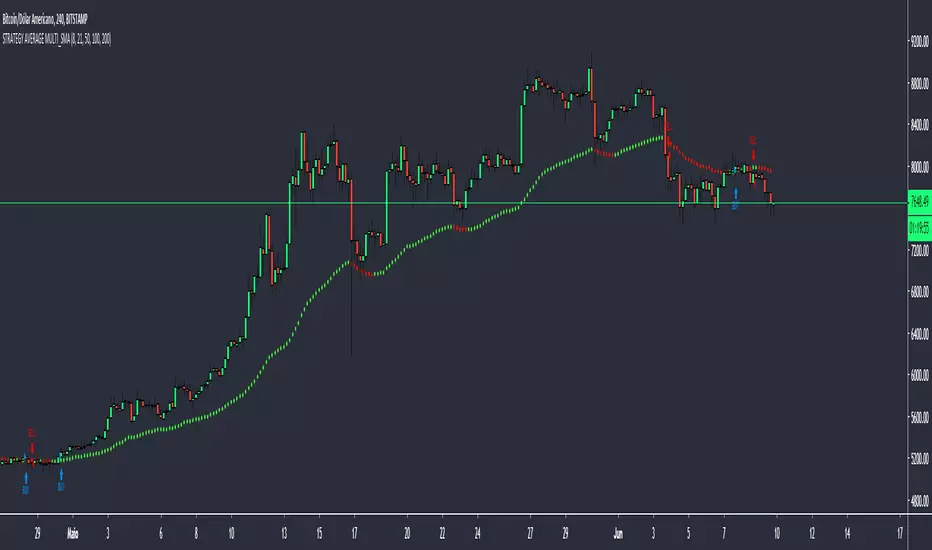
As you can see from the chart, the SuperTrend Indicator
defines moving support & resistance levels for price action with its clouds and trendlines
catches trend changes when black line (the Slow SuperTrend) switches from staying upper price action to down and viceversa
shows you on background bearish momentum in red
shows you on background bullish momentum in green
This is not a free indicator, so send me a private message in order to get access to this script.
Do you like my scripts? Offer me a coffee, a beer, a pizza or whatever :)
BTC jar: 1K5kuYQPEqoNo6GRmJbHWMPmqwKM5S3oRR
ETH jar: 0x091b541a6dd6fe08c4e7bd909baafb2fce9b975e
LTC jar: LSVoAChsZrVsvbNyUfdpxtFpDAUSaUTUig
XRP jar: (XRP deposit tag) 103997763 (XRP deposit address) rEb8TK3gBgk5auZkwc6sHnwrGVJH8DuaLh
PS: Do you need a customization or do you need a dev who implements your strategy? send me a private message ;-)
Pine Script®指標