Renko UT Bot Strategy v6 - ADX FilterDescription:
This script implements a Renko-based trailing stop strategy using the UT Bot method, now enhanced with an optional ADX and DI+/- filter to help avoid choppy, low-momentum market conditions. Trades are triggered only when price and EMA cross the adaptive trailing stop and ADX/DI conditions are also met.
USE:
Start the indicator on a Renko chart and optimize settings for prefered choosen chart
Key Features:
Adaptive ATR trailing stop based on Renko logic
EMA/Trailing Stop crossovers for entries
Adjustable ADX and DI+/- filter (no signals if conditions aren’t met)
Visual stop line and trade labels on the chart
Customizable inputs for ATR, EMA, and filter levels
Disclaimer:
This strategy is provided for educational and research purposes only. It has not been tested in live trading or with real money. The past performance of this script does not guarantee future results. Trading involves substantial risk, and you can lose all or more of your investment.
Before considering any real-money use, please test the strategy thoroughly on a demo account or in TradingView’s paper trading environment.
This script is not financial advice. Consult with a licensed financial advisor before making trading decisions.
Author PDK1977
Buysellsignal

UT Bot + LinReg Candles (Dual Sensitivity)
Script Description:
This indicator combines the popular UT Bot Alerts system with Linear Regression Candles (open source) for enhanced trend detection and trading signals in one singel script. The UT Bot features independent, then 2 x ATR sensitivity and periods controls for buy and sell signals, allowing you to fine-tune entries and exits to match your strategy. The script also overlays colored Linear Regression Candles with an optional signal line, helping you visually identify trend strength and direction. All calculations are performed on standard chart prices (no Heikin Ashi). Suitable for all asset classes and timeframes.
Eample setting for usdjpy 5 min chart for repeated buy and sell singnals based on trend:
BUY ATR period 300 multiplier 1
SELL ATR period 1 multiplier 2
Disclaimer:
This script is for informational and educational purposes only. It is not financial advice. Use at your own risk; the author assumes no responsibility for any trading results or losses.
Credits goes to to Ugurvu for linreg candles and quantnomad for UT Bot alerts that make this script possible.
Author: Patrick

[TH] กลยุทธ์ SMC หลายกรอบเวลา (V5.2 - M15 Lead)English Explanation
This Pine Script code implements a multi-timeframe trading strategy based on Smart Money Concepts (SMC). It's designed to identify high-probability trading setups by aligning signals across three different timeframes.
The core logic is as follows:
High Timeframe (HTF) - M15: Determines the overall market direction or bias.
Medium Timeframe (MTF) - M5: Identifies potential Points of Interest (POI), such as Order Blocks or Fair Value Gaps, in alignment with the M15 bias.
Low Timeframe (LTF) - Current Chart: Looks for a specific entry trigger within the M5 POI to execute the trade.
Detailed Breakdown
## Part 1: Inputs & Settings
This section allows you to customize the indicator's parameters:
General Settings:
i_pivotLookback: Sets the lookback period for identifying pivot highs and lows on the LTF, which is crucial for finding the Change of Character (CHoCH).
M15 Bias Settings:
i_m15EmaFast / i_m15EmaSlow: These two EMA (Exponential Moving Average) values on the 15-minute chart determine the main trend. A bullish trend is confirmed when the fast EMA is above the slow EMA, and vice-versa for a bearish trend.
M5 Point of Interest (POI) Settings:
i_showM5Fvg / i_showM5Ob: Toggles the visibility of Fair Value Gaps (FVG) and Order Blocks (OB) on the 5-minute chart. These are the zones where the script will look for trading opportunities.
i_maxPois: Limits the number of POI zones drawn on the chart to keep it clean.
LTF Entry Settings:
i_entryMode:
Confirmation: The script waits for a Change of Character (CHoCH) on the LTF (your current chart) after the price enters an M5 POI. A CHoCH is a break of a recent pivot high (for buys) or pivot low (for sells), suggesting a potential reversal. This is the safer entry method.
Aggressive: The script triggers an entry as soon as the price touches the 50% level of the M5 POI, without waiting for a CHoCH. This is higher risk but can provide a better entry price.
i_showChoch: Toggles the visibility of the CHoCH confirmation lines.
Trade Management Settings:
i_tpRatio: Sets the Risk-to-Reward Ratio (RRR) for the Take Profit target. For example, a value of 2.0 means the Take Profit distance will be twice the Stop Loss distance.
i_slMode: (New in V5.2) Provides four different methods to calculate the Stop Loss:
POI Zone (Default): Places the SL at the outer edge of the M5 POI zone.
Last Swing: Places the SL at the most recent LTF swing high/low before the entry.
ATR: Uses the Average True Range (ATR) indicator to set a volatility-based SL.
Previous Candle: Places the SL at the high or low of the candle immediately preceding the entry. This is the tightest and riskiest option.
i_maxHistory: Sets the number of past trades to display on the chart.
## Part 2: Data Types & Variables
This section defines custom data structures (type) to organize information:
Poi: A structure to hold all information related to a single Point of Interest, including its price boundaries, direction (bullish/bearish), and whether it has been mitigated (touched by price).
Trade: A structure to store details for each trade, such as its entry price, SL, TP, result (Win/Loss/Active), and chart objects for drawing.
## Part 3: Core Logic & Calculations
This is the engine of the indicator:
Data Fetching: It uses request.security to pull EMA data from the M15 timeframe and candle data (high, low, open, close) from the M5 timeframe.
POI Identification: The script constantly scans the M5 data for FVG and OB patterns. When a valid pattern is found that aligns with the M15 bias (e.g., a bullish OB during an M15 uptrend), it's stored as a Poi and drawn on the chart.
Entry Trigger:
It checks if the price on the LTF enters a valid (unmitigated) POI zone.
Based on the selected i_entryMode, it either waits for a CHoCH or enters aggressively.
Once an entry condition is met, it calculates the SL based on the i_slMode, calculates the TP using the i_tpRatio, and creates a new Trade.
Trade Monitoring: For every active trade, the script checks on each new bar if the price has hit the SL or TP level. When it does, the trade's result is updated, and the visual boxes are finalized.
## Part 5: On-Screen Display
This part creates the Performance Dashboard table shown on the top-right of the chart. It provides a real-time summary of:
M15 Bias: Current market direction.
Total Trades: The total number of completed trades from the history.
Win Rate: The percentage of winning trades.
Total R-Multiple: The cumulative Risk-to-Reward multiple (sum of RRR from wins minus losses). A positive value indicates overall profitability.
🇹🇭 คำอธิบายและข้อแนะนำภาษาไทย
สคริปต์นี้เป็น Indicator สำหรับกลยุทธ์การเทรดแบบ Smart Money Concepts (SMC) ที่ใช้การวิเคราะห์จากหลายกรอบเวลา (Multi-Timeframe) เพื่อหาจุดเข้าเทรดที่มีความเป็นไปได้สูง
หลักการทำงานของ Indicator มีดังนี้:
Timeframe ใหญ่ (HTF) - M15: ใช้กำหนดทิศทางหลักของตลาด หรือ "Bias"
Timeframe กลาง (MTF) - M5: ใช้หาโซนสำคัญ หรือ "Point of Interest (POI)" เช่น Order Blocks หรือ Fair Value Gaps ที่สอดคล้องกับทิศทางจาก M15
Timeframe เล็ก (LTF) - กราฟปัจจุบัน: ใช้หาสัญญาณยืนยันเพื่อเข้าเทรดในโซน POI ที่กำหนดไว้
รายละเอียดของโค้ด
## ส่วนที่ 1: การตั้งค่า (Inputs & Settings)
ส่วนนี้ให้คุณปรับแต่งค่าต่างๆ ของ Indicator ได้:
การตั้งค่าทั่วไป:
i_pivotLookback: กำหนดระยะเวลาที่ใช้มองหาจุดกลับตัว (Pivot) ใน Timeframe เล็ก (LTF) เพื่อใช้ยืนยันสัญญาณ Change of Character (CHoCH)
การตั้งค่า M15 (ทิศทางหลัก):
i_m15EmaFast / i_m15EmaSlow: ใช้เส้น EMA 2 เส้นบน Timeframe 15 นาที เพื่อกำหนดเทรนด์หลัก หาก EMA เร็วอยู่เหนือ EMA ช้า จะเป็นเทรนด์ขาขึ้น และในทางกลับกัน
การตั้งค่า M5 (จุดสนใจ - POI):
i_showM5Fvg / i_showM5Ob: เปิด/ปิด การแสดงโซน Fair Value Gaps (FVG) และ Order Blocks (OB) บน Timeframe 5 นาที ซึ่งเป็นโซนที่สคริปต์จะใช้หาโอกาสเข้าเทรด
i_maxPois: จำกัดจำนวนโซน POI ที่จะแสดงผลบนหน้าจอ เพื่อไม่ให้กราฟดูรกเกินไป
การตั้งค่า LTF (การเข้าเทรด):
i_entryMode:
ยืนยัน (Confirmation): เป็นโหมดที่ปลอดภัยกว่า โดยสคริปต์จะรอให้เกิดสัญญาณ Change of Character (CHoCH) ใน Timeframe เล็กก่อน หลังจากที่ราคาเข้ามาในโซน POI แล้ว
เชิงรุก (Aggressive): เป็นโหมดที่เสี่ยงกว่า โดยสคริปต์จะเข้าเทรดทันทีที่ราคาแตะระดับ 50% ของโซน POI โดยไม่รอสัญญาณยืนยัน CHoCH
i_showChoch: เปิด/ปิด การแสดงเส้น CHoCH บนกราฟ
การตั้งค่าการจัดการเทรด:
i_tpRatio: กำหนด อัตราส่วนกำไรต่อความเสี่ยง (Risk-to-Reward Ratio) เพื่อตั้งเป้าหมายทำกำไร (Take Profit) เช่น 2.0 หมายถึงระยะทำกำไรจะเป็น 2 เท่าของระยะตัดขาดทุน
i_slMode: (ฟีเจอร์ใหม่ V5.2) มี 4 รูปแบบในการคำนวณ Stop Loss:
โซน POI (ค่าเริ่มต้น): วาง SL ไว้ที่ขอบนอกสุดของโซน POI
Swing ล่าสุด: วาง SL ไว้ที่จุด Swing High/Low ล่าสุดของ Timeframe เล็ก (LTF) ก่อนเข้าเทรด
ATR: ใช้ค่า ATR (Average True Range) เพื่อกำหนด SL ตามระดับความผันผวนของราคา
แท่งเทียนก่อนหน้า: วาง SL ไว้ที่ราคา High/Low ของแท่งเทียนก่อนหน้าที่จะเข้าเทรด เป็นวิธีที่ SL แคบและเสี่ยงที่สุด
i_maxHistory: กำหนดจำนวนประวัติการเทรดที่จะแสดงย้อนหลังบนกราฟ
## ส่วนที่ 2: ประเภทข้อมูลและตัวแปร
ส่วนนี้เป็นการสร้างโครงสร้างข้อมูล (type) เพื่อจัดเก็บข้อมูลให้เป็นระบบ:
Poi: เก็บข้อมูลของโซน POI แต่ละโซน เช่น กรอบราคาบน-ล่าง, ทิศทาง (ขึ้น/ลง) และสถานะว่าถูกใช้งานไปแล้วหรือยัง (Mitigated)
Trade: เก็บรายละเอียดของแต่ละการเทรด เช่น ราคาเข้า, SL, TP, ผลลัพธ์ (Win/Loss/Active) และอ็อบเจกต์สำหรับวาดกล่องบนกราฟ
## ส่วนที่ 3: ตรรกะหลักและการคำนวณ
เป็นหัวใจสำคัญของ Indicator:
ดึงข้อมูลข้าม Timeframe: ใช้ฟังก์ชัน request.security เพื่อดึงข้อมูล EMA จาก M15 และข้อมูลแท่งเทียนจาก M5 มาใช้งาน
ระบุ POI: สคริปต์จะค้นหา FVG และ OB บน M5 ตลอดเวลา หากเจ้ารูปแบบที่สอดคล้องกับทิศทางหลักจาก M15 (เช่น เจอ Bullish OB ในขณะที่ M15 เป็นขาขึ้น) ก็จะวาดโซนนั้นไว้บนกราฟ
เงื่อนไขการเข้าเทรด:
เมื่อราคาใน Timeframe เล็ก (LTF) วิ่งเข้ามาในโซน POI ที่ยังไม่เคยถูกใช้งาน
สคริปต์จะรอสัญญาณตาม i_entryMode ที่เลือกไว้ (รอ CHoCH หรือเข้าแบบ Aggressive)
เมื่อเงื่อนไขครบ จะคำนวณ SL และ TP จากนั้นจึงบันทึกการเทรดใหม่
ติดตามการเทรด: สำหรับเทรดที่ยัง "Active" อยู่ สคริปต์จะคอยตรวจสอบทุกแท่งเทียนว่าราคาไปถึง SL หรือ TP แล้วหรือยัง เมื่อถึงจุดใดจุดหนึ่ง จะบันทึกผลและสิ้นสุดการวาดกล่องบนกราฟ
## ส่วนที่ 5: การแสดงผลบนหน้าจอ
ส่วนนี้จะสร้างตาราง "Performance Dashboard" ที่มุมขวาบนของกราฟ เพื่อสรุปผลการทำงานแบบ Real-time:
M15 Bias: แสดงทิศทางของตลาดในปัจจุบัน
Total Trades: จำนวนเทรดทั้งหมดที่เกิดขึ้นในประวัติ
Win Rate: อัตราชนะ คิดเป็นเปอร์เซ็นต์
Total R-Multiple: ผลตอบแทนรวมจากความเสี่ยง (R) ทั้งหมด (ผลรวม RRR ของเทรดที่ชนะ ลบด้วยจำนวนเทรดที่แพ้) หากเป็นบวกแสดงว่ามีกำไรโดยรวม
📋 ข้อแนะนำในการใช้งาน
Timeframe ที่เหมาะสม: Indicator นี้ถูกออกแบบมาให้ใช้กับ Timeframe เล็ก (LTF) เช่น M1, M3 หรือ M5 เนื่องจากมันดึงข้อมูลจาก M15 และ M5 มาเป็นหลักการอยู่แล้ว
สไตล์การเทรด:
Confirmation: เหมาะสำหรับผู้ที่ต้องการความปลอดภัยสูง รอการยืนยันก่อนเข้าเทรด อาจจะตกรถบ้าง แต่ลดความเสี่ยงจากการเข้าเทรดเร็วเกินไป
Aggressive: เหมาะสำหรับผู้ที่ยอมรับความเสี่ยงได้สูงขึ้น เพื่อให้ได้ราคาเข้าที่ดีที่สุด
การเลือก Stop Loss:
"Swing ล่าสุด" และ "โซน POI" เป็นวิธีมาตรฐานตามหลัก SMC
"ATR" เหมาะกับตลาดที่มีความผันผวนสูง เพราะ SL จะปรับตามสภาพตลาด
"แท่งเทียนก่อนหน้า" เป็นวิธีที่เสี่ยงที่สุด เหมาะกับการเทรดเร็วและต้องการ RRR สูงๆ แต่ก็มีโอกาสโดน SL ง่ายขึ้น
การบริหารความเสี่ยง: Indicator นี้เป็นเพียง เครื่องมือช่วยวิเคราะห์ ไม่ใช่สัญญาณซื้อขายอัตโนมัติ 100% ผู้ใช้ควรมีความเข้าใจในหลักการของ SMC และทำการบริหารความเสี่ยง (Risk Management) อย่างเคร่งครัดเสมอ
การทดสอบย้อนหลัง (Backtesting): ควรทำการทดสอบ Indicator กับสินทรัพย์และตั้งค่าต่างๆ เพื่อให้เข้าใจลักษณะการทำงานและประสิทธิภาพของมันก่อนนำไปใช้เทรดจริง

Future is hereOverview
"Future is Here" is an original, multi-faceted Pine Script indicator designed to provide traders with a comprehensive toolset for identifying high-probability trading opportunities. By integrating volatility-based entry zones, trend-based price targets, momentum confirmation, dynamic support/resistance levels, and risk-reward ratio (RRR) calculations, this indicator offers a cohesive and actionable trading framework. Each feature is carefully designed to complement the others, ensuring a synergistic approach that enhances decision-making across various market conditions. This script is unique in its ability to combine these elements into a single, streamlined interface with clear visual cues and customizable alerts, making it suitable for both novice and experienced traders.
Key Features and How They Work Together
Volatility-Based Entry Zones
Purpose: Identifies overbought and oversold conditions using a volatility-adjusted moving average, helping traders spot potential reversal zones.
Mechanism: Utilizes a user-defined volatility length and multiplier to calculate dynamic overbought/oversold thresholds based on the standard deviation of price. Crossovers and crossunders of these levels trigger "Buy Zone" or "Sell Zone" labels.
Synergy: These zones act as the foundation for entry signals, which are later confirmed by momentum and trend filters to reduce false signals.
Trend-Based Price Targets
Purpose: Projects potential price targets based on the prevailing trend, giving traders clear objectives for profit-taking.
Mechanism: Combines a fast and slow moving average to determine trend direction, then calculates target prices using a multiplier of the price deviation from the slow MA. Labels display bullish or bearish targets when the fast MA crosses the slow MA.
Synergy: Works in tandem with entry zones and momentum signals to align targets with market conditions, ensuring traders aim for realistic price levels supported by trend strength.
Momentum Confirmation
Purpose: Validates entry signals by assessing momentum strength, filtering out weak setups.
Mechanism: Uses the momentum indicator to detect bullish or bearish momentum crossovers, labeling them as "Strong" or "Weak" based on a comparison with a smoothed momentum average.
Synergy: Enhances the reliability of buy/sell signals by ensuring momentum aligns with volatility zones and trend direction, reducing the risk of premature entries.
Dynamic Support/Resistance Levels
Purpose: Highlights key price levels where the market is likely to react, aiding in trade planning and risk management.
Mechanism: Detects pivot highs and lows over a user-defined lookback period, drawing horizontal lines for the most recent support and resistance levels (limited to two each for clarity). Labels mark these levels with price values.
Synergy: Complements entry zones and price targets by providing context for potential reversal or continuation points, helping traders set logical stop-losses or take-profits.
Buy/Sell Signals with Risk-Reward Ratios
Purpose: Generates precise buy/sell signals with integrated take-profit (TP), stop-loss (SL), and RRR calculations for disciplined trading.
Mechanism: Combines volatility zone crossovers, trend confirmation, and positive momentum to trigger signals. ATR-based TP and SL levels are calculated, and the RRR is displayed in labels for quick assessment.
Synergy: This feature ties together all previous components, ensuring signals are only generated when volatility, trend, and momentum align, while providing clear risk-reward metrics for trade evaluation.
Customizable Alerts
Purpose: Enables traders to stay informed of trading opportunities without constant chart monitoring.
Mechanism: Alert conditions are set for buy and sell signals, delivering notifications with the entry price for seamless integration into trading workflows.
Synergy: Enhances usability by allowing traders to act on high-probability setups identified by the indicator’s combined logic.
Originality
"Future is Here" is an original creation that distinguishes itself through its holistic approach to technical analysis. Unlike single-purpose indicators, it integrates volatility, trend, momentum, and support/resistance into a unified system, reducing the need for multiple scripts. The inclusion of RRR calculations directly in signal labels is a unique feature that empowers traders to evaluate trade quality instantly. The script’s design emphasizes clarity and efficiency, with cooldowns to prevent label clutter and a limit on support/resistance lines to maintain chart readability. This combination of features, along with its customizable parameters, makes it a versatile and novel tool for traders seeking a robust, all-in-one solution.
How to Use
Setup: Add the indicator to your TradingView chart and adjust input parameters (e.g., Volatility Length, Trend Length, TP/SL Multipliers) to suit your trading style and timeframe.
Interpretation:
Look for "Buy Zone" or "Sell Zone" labels to identify potential entry points.
Confirm entries with "Bull Mom" or "Bear Mom" labels and trend direction (Bull/Bear Target labels).
Use Support/Resistance lines to set logical TP/SL levels or anticipate reversals.
Evaluate Buy/Sell signals with TP, SL, and RRR for high-probability trades.
Alerts: Set up alerts for Buy/Sell signals to receive real-time notifications.
Customization: Fine-tune multipliers and lengths to adapt the indicator to different markets (e.g., stocks, forex, crypto) or timeframes.

Step Channel Momentum Trend [ChartPrime]OVERVIEW
Step Channel Momentum Trend is a momentum-based price filtering system that adapts to market structure using pivot levels and ATR volatility. It builds a dynamic channel around a stepwise midline derived from swing highs and lows. The system colors price candles based on whether price remains inside this channel (low momentum) or breaks out (strong directional flow). This allows traders to clearly distinguish ranging conditions from trending ones and take action accordingly.
⯁ STRUCTURAL MIDLNE (STEP CHANNEL CORE)
The midline acts as the backbone of the trend system and is based on structure rather than smoothing.
Calculated as the average of the most recent confirmed Pivot High and Pivot Low.
The result is a step-like horizontal line that only updates when new pivot points are confirmed.
This design avoids lag and makes the line "snap" to recent structural shifts.
It reflects the equilibrium level between recent bullish and bearish control.
snapshot
This unique step logic creates clear regime shifts and prevents noise from distorting trend interpretation.
⯁ DYNAMIC VOLATILITY BANDS (ATR FILTERING)
To detect momentum strength, the script constructs upper and lower bands using the ATR (Average True Range):
The distance from the midline is determined by ATR × multiplier (default: 200-period ATR × 0.6).
These bands adjust dynamically to volatility, expanding in high-ATR environments and contracting in calm markets.
The area between upper and lower bands represents a neutral or ranging market state.
Breakouts outside the bands are treated as significant momentum shifts.
snapshot
This filtering approach ensures that only meaningful breakouts are visually emphasized — not every candle fluctuation.
⯁ MOMENTUM-BASED CANDLE COLORING
The system visually transforms price candles into momentum indicators:
When price (hl2) is above the upper band, candles are green → bullish momentum.
snapshot
When price is below the lower band, candles are red → bearish momentum.
snapshot
When price is between the bands, candles are orange → low or no momentum (range).
snapshot
The candle body, wick, and border are all colored uniformly for visual clarity.
This gives traders instant feedback on when momentum is expanding or fading — ideal for breakout, pullback, or trend-following strategies.
⯁ PIVOT-BASED SWING ANCHORS
Each confirmed pivot is plotted as a label ⬥ directly on the chart:
snapshot
They also serve as potential manual entry zones, SL/TP anchors, or confirmation points.
⯁ MOMENTUM STATE LABEL
To reinforce the current market mode, a live label is displayed at the most recent candle:
Displays either:
“Momentum Up” when price breaks above the upper band.
snapshot
“Momentum Down” when price breaks below the lower band.
snapshot
“Range” when price remains between the bands.
snapshot
Label color matches the candle color for quick identification.
Automatically updates on each bar close.
This helps discretionary traders filter trades based on market phase.
USAGE
Use the green/red zones to enter with momentum and ride trending moves.
Use the orange zone to stay out or fade ranges.
The step midline can act as a breakout base, pullback anchor, or bias reference.
Combine with other indicators (e.g., order blocks, divergences, or volume) to build high-confluence systems.
CONCLUSION
Step Channel Momentum Trend gives traders a clean, adaptive framework for identifying trend direction, volatility-based breakouts, and ranging environments — all from structural logic and ATR responsiveness. Its stepwise midline provides clarity, while its dynamic color-coded candles make momentum shifts impossible to miss. Whether you’re scalping intraday momentum or managing swing entries, this tool helps you trade with the market’s rhythm — not against it.

Intraday BUY/SELL & AUTO SL (5-min timeframe only) by chaitu50c)Intraday BUY/SELL & AUTO SL (5-min timeframe only) by chaitu50c
This indicator provides intraday traders with BUY/SELL reversal signals and automated SL (Stoploss) tracking, based on a 3-candle reversal block logic — designed to work exclusively on the 5-min timeframe.
Key Features:
• 3-Candle Reversal Logic — Signals are generated when a defined 3-candle reversal pattern is detected (body-close breakout).
• Current Session Only — All signals and SL lines are valid only for the current session and automatically reset at session start.
• BUY/SELL Signal Labels — Visual ▲ and ▼ labels mark valid reversal signals on the chart.
• Dynamic Auto SL Lines — Plots dashed SL lines based on the reversal block's low/high.
• SL HIT Tracking — If SL is broken, the line stops extending and a ‘SL HIT’ label is displayed at the midpoint of the SL line.
• Adjustable Visual Settings — Customize signal label size, SL line width, colors, and more.
• Clean & Lightweight — Optimized for intraday use without cluttering the chart.
How to Use:
You can trade this indicator in two ways:
1. Direct Signal Entry — Take a BUY or SELL trade when a valid ▲/▼ reversal signal forms.
2. SL HIT Re-entry — If an existing SL line is broken and ‘SL HIT’ appears, you can optionally take an opposite side trade in the direction of the SL HIT.
Example:
A BUY signal is generated and an SL line is plotted below.
If price breaks the SL (SL HIT appears), you may consider entering a SELL trade at that point — as it indicates weakness.
Important Notes:
• Works only on 5-min timeframe — Set your chart to 5-min for correct behavior.
• Designed for intraday trading — all signals and SL levels reset at session start.
• Does not carry signals between sessions.
• SL lines and HIT labels provide a clear and simple visual aid for trade management.
---

Adaptive Cycle Oscillator with EMADescription of the Adaptive Cycle Oscillator with EMA Pine Script
This Pine Script, titled "Adaptive Cycle Oscillator with EMA", is a custom technical indicator designed for TradingView to help traders analyze market cycles and identify potential buy or sell opportunities. It combines an Adaptive Cycle Oscillator (ACO) with multiple Exponential Moving Averages (EMAs), displayed as colorful, wavy lines, and includes features like buy/sell signals and divergence detection. Below is a beginner-friendly explanation of how the script works, adhering to TradingView's Script Publishing Rules.
What This Indicator Does
The Adaptive Cycle Oscillator with EMA helps you:
Visualize market cycles using an oscillator that adapts to price movements.
Track trends with seven EMAs of different lengths, plotted as a rainbow of wavy lines.
Identify potential buy or sell signals when the oscillator crosses predefined thresholds.
Spot divergences between the oscillator and price to anticipate reversals.
Use customizable settings to adjust the indicator to your trading style.
Note: This is a technical analysis tool and does not guarantee profits. Always combine it with other analysis methods and practice risk management.
Step-by-Step Explanation for New Users
1. Understanding the Indicator
Adaptive Cycle Oscillator (ACO): The ACO analyzes price data (based on high, low, and close prices, or HLC3) to detect market cycles. It smooths price movements to create an oscillator that swings between overbought and oversold levels.
EMAs: Seven EMAs of different lengths are applied to the ACO and scaled based on the market's dominant cycle. These EMAs are plotted as colorful, wavy lines to show trend direction.
Buy/Sell Signals: The script generates signals when the ACO crosses above or below user-defined thresholds, indicating potential entry or exit points.
Divergence Detection: The script identifies bullish or bearish divergences between the ACO and the fastest EMA, which may signal potential reversals.
Visual Style: The indicator uses a rainbow of seven colors (red, orange, yellow, green, blue, indigo, violet) for the EMAs, with wavy lines for a unique visual effect. Static levels (zero, overbought, oversold) are also wavy for consistency.
2. How to Add the Indicator to Your Chart
Open TradingView and load the chart of any asset (e.g., stock, forex, crypto).
Click on the Indicators button at the top of the chart.
Search for "Adaptive Cycle Oscillator with EMA" (or paste the script into TradingView’s Pine Editor if you have access to it).
Click to add the indicator to your chart. It will appear in a separate panel below the price chart.
3. Customizing the Indicator
The script offers several input options to tailor it to your needs:
Base Cycle Length (Default: 20): Sets the initial period for calculating the dominant cycle. Higher values make the indicator slower; lower values make it more sensitive.
Alpha Smoothing (Default: 0.07): Controls how much the ACO smooths price data. Smaller values produce smoother results.
Show Buy/Sell Signals (Default: True): Toggle to display green triangles (buy) and red triangles (sell) on the chart.
Threshold (Default: 0.0): Defines overbought (above threshold) and oversold (below threshold) levels. Adjust to widen or narrow signal zones.
EMA Base Length (Default: 10): Sets the starting length for the fastest EMA. Other EMAs are incrementally longer (12, 14, 16, etc.).
Divergence Lookback (Default: 14): Determines how far back the script looks to detect divergences.
To adjust these:
Right-click the indicator on your chart and select Settings.
Modify the inputs in the pop-up window.
Click OK to apply changes.
4. Reading the Indicator
Oscillator and EMAs: The ACO and seven EMAs are plotted in a separate panel. The EMAs (colored lines) move in a wavy pattern:
Red (fastest) to Violet (slowest) represent different response speeds.
When the faster EMAs (e.g., red, orange) are above slower ones (e.g., blue, violet), it suggests bullish momentum, and vice versa.
Zero Line: A gray wavy line at zero acts as a neutral level. The ACO above zero indicates bullish conditions; below zero indicates bearish conditions.
Overbought/Oversold Lines: Red (overbought) and green (oversold) wavy lines mark threshold levels. Extreme ACO values near these lines may suggest reversals.
Buy/Sell Signals:
Green Triangle (Bottom): Appears when the ACO crosses above the oversold threshold, suggesting a potential buy.
Red Triangle (Top): Appears when the ACO crosses below the overbought threshold, suggesting a potential sell.
Divergences:
Green Triangle (Bottom): Indicates a bullish divergence (price makes a lower low, but the EMA makes a higher low), hinting at a potential upward reversal.
Red Triangle (Top): Indicates a bearish divergence (price makes a higher high, but the EMA makes a lower high), hinting at a potential downward reversal.
5. Using Alerts
You can set alerts for key events:
Right-click the indicator and select Add Alert.
Choose a condition (e.g., "ACO Buy Signal", "Bullish Divergence").
Configure the alert settings (e.g., notify via email, app, or pop-up).
Click Create to activate the alert.
Available alert conditions:
ACO Buy Signal: When the ACO crosses above the oversold threshold.
ACO Sell Signal: When the ACO crosses below the overbought threshold.
Bullish Divergence: When a potential upward reversal is detected.
Bearish Divergence: When a potential downward reversal is detected.
6. Tips for Using the Indicator
Combine with Other Tools: Use the indicator alongside support/resistance levels, candlestick patterns, or other indicators (e.g., RSI, MACD) for confirmation.
Test on Different Timeframes: The indicator works on any timeframe (e.g., 1-minute, daily). Shorter timeframes may produce more signals but with more noise.
Practice Risk Management: Never rely solely on this indicator. Set stop-losses and position sizes to manage risk.
Backtest First: Use TradingView’s Strategy Tester (if you convert the script to a strategy) to evaluate performance on historical data.
Compliance with TradingView’s Script Publishing Rules
This description adheres to TradingView’s Script Publishing Rules (as outlined in the provided link):
No Performance Claims: The description avoids promising profits or specific results, emphasizing that the indicator is a tool for analysis.
Clear Instructions: It provides step-by-step guidance for adding, customizing, and using the indicator.
Risk Disclaimer: It notes that trading involves risks and the indicator should be used with other analysis methods.
No Misleading Terms: Terms like “buy” and “sell” are used to describe signals, not guaranteed actions.
Transparency: The description explains the indicator’s components (ACO, EMAs, signals, divergences) without exaggerating its capabilities.
No External Links: The description avoids linking to external resources or soliciting users.
Educational Tone: It focuses on educating users about the indicator’s functionality.
Limitations
Not a Standalone System: The indicator is not a complete trading strategy. It provides insights but requires additional analysis.
Lagging Nature: As with most oscillators and EMAs, signals may lag behind price movements, especially in fast markets.
False Signals: Signals and divergences may not always lead to successful trades, particularly in choppy markets.
Market Dependency: Performance varies across assets and market conditions (e.g., trending vs. ranging markets).

Pucci Trend EMA-SMA Crossover with TolerancePucci Trend EMA-SMA Crossover with Tolerance
This indicator helps identify market trends and generates trading signals based on the crossover between an Exponential Moving Average (EMA) and a Simple Moving Average (SMA) with an adjustable tolerance threshold. The signals work as follows:
Buy Signal (B) -> Triggers when the EMA crosses above the SMA, exceeding a user-defined tolerance (in basis points). Optionally, a price filter can require the high or low to be below the EMA for confirmation.
Sell Signal (S) -> Triggers when the SMA crosses above the EMA, exceeding the tolerance. The optional price filter may require the high or low to be above the EMA.
The tolerance helps reduce false signals by requiring a minimum distance between the moving averages before confirming a crossover. The price filter adds an extra confirmation layer by checking if price action respects the EMA level.
Important Notes:
1º No profitability guarantee: This tool is for analysis only and may generate losses.
2º "As Is" disclaimer: Provided without warranties or responsibility for trading outcomes.
3º Use Stop Loss: Users must determine their own risk management.
4º Parameter adjustment needed: Optimal MA periods and tolerance vary by timeframe.
5º Filter impact varies: Enabling/disabling the price filter may improve or worsen performance.

Adaptive Volume‐Demand‐Index (AVDI)Demand Index (according to James Sibbet) – Short Description
The Demand Index (DI) was developed by James Sibbet to measure real “buying” vs. “selling” strength (Demand vs. Supply) using price and volume data. It is not a standalone trading signal, but rather a filter and trend confirmer that should always be used together with chart structure and additional indicators.
---
\ 1. Calculation Basis\
1. Volume Normalization
$$
\text{normVol}_t
= \frac{\text{Volume}_t}{\mathrm{EMA}(\text{Volume},\,n_{\text{Vol}})_t}
\quad(\text{e.g., }n_{\text{Vol}} = 13)
$$
This smooths out extremely high volume spikes and compares them to the average (≈ 1 means “average volume”).
2. Price Factor
$$
\text{priceFactor}_t
= \frac{\text{Close}_t - \text{Open}_t}{\text{Open}_t}.
$$
Positive values for bullish bars, negative for bearish bars.
3. Component per Bar
$$
\text{component}_t
= \text{normVol}_t \times \text{priceFactor}_t.
$$
If volume is above average (> 1) and the price rises slightly, this yields a noticeably positive value; conversely if the price falls.
4. Raw DI (Rolling Sum)
Over a window of \$w\$ bars (e.g., 20):
$$
\text{RawDI}_t
= \sum_{i=0}^{w-1} \text{component}_{\,t-i}.
$$
Alternatively, recursively for \$t \ge w\$:
$$
\text{RawDI}_t
= \text{RawDI}_{t-1}
+ \text{component}_t
- \text{component}_{\,t-w}.
$$
5. Optional EMA Smoothing
An EMA over RawDI (e.g., \$n\_{\text{DI}} = 50\$) reduces short-term fluctuations and highlights medium-term trends:
$$
\text{EMA\_DI}_t
= \mathrm{EMA}(\text{RawDI},\,n_{\text{DI}})_t.
$$
6.Zero Line
Handy guideline:
RawDI > 0: Accumulated buying power dominates.
RawDI < 0: Accumulated selling power dominates.
2. Interpretation & Application
Crossing Zero
RawDI above zero → Indication of increasing buying pressure (potential long signal).
RawDI below zero → Indication of increasing selling pressure (potential short signal).
Not to be used alone for entry—always confirm with price action.
RawDI vs. EMA_DI
RawDI > EMA\_DI → Acceleration of demand.
RawDI < EMA\_DI → Weakening of demand.
Divergences
Price makes a new high, RawDI does not make a higher high → potential weakness in the uptrend.
Price makes a new low, RawDI does not make a lower low → potential exhaustion of the downtrend.
3. Typical Signals (for Beginners)
\ 1. Long Setup\
RawDI crosses zero from below,
RawDI > EMA\_DI (acceleration),
Price closes above a short-term swing high or resistance.
Stop-Loss: just below the last swing low, Take-Profit/Trailing: on reversal signals or fixed R\:R.
2. Short Setup
RawDI crosses zero from above,
RawDI < EMA\_DI (increased selling pressure),
Price closes below a short-term swing low or support.
Stop-Loss: just above the last swing high.
---
4. Notes and Parameters
Recommended Values (Beginners):
Volume EMA (n₍Vol₎) = 13
RawDI window (w) = 20
EMA over DI (n₍DI₎) = 50 (medium-term) or 1 (no smoothing)
Attention:\
NEVER use in isolation. Always in combination with price action analysis (trendlines, support/resistance, candlestick patterns).
Especially during volatile news phases, RawDI can fluctuate strongly → EMA\_DI helps to avoid false signals.
---
Conclusion The Demand Index by James Sibbet is a powerful filter to assess price movements by their volume backing. It shows whether a rally is truly driven by demand or merely a short-term volume anomaly. In combination with classic chart analysis and risk management, it helps to identify robust entry points and potential trend reversals earlier.

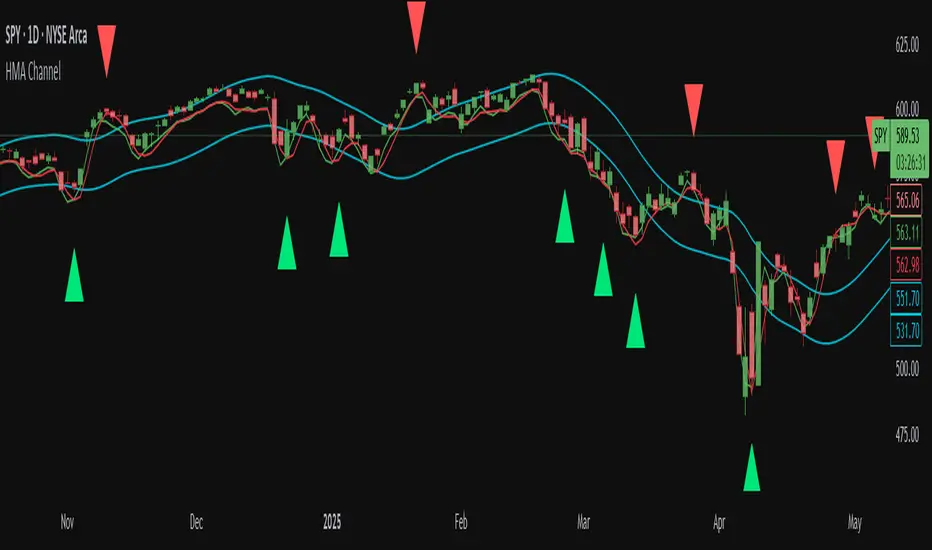
Hull MA Channel with Filtered CrossoversI've created an indicator that let's you create a HMA channel with 2 displaced HMA (A/B). As well as a HMA crossover set (C/D).
Here's how it works:
The HMA crossovers from C and D will not signal unless they are outside of the channel of A and B. As a matter of fact, NO buy signal whatsoever will occur above the channel and NO sell signal will occur below the channel.
The crossover HMA pair (C/D) can have their lengths adjusted to the 0.00 decimal point for VERY fine tuning of the crossovers.
(edit-it doesn't fine tune to the .00. This must not be a feature that is able to be utilized. I tried) The length adjustment still works to the nearest whole number. The .00 are mute :(
In keeping with that same logic, you can adjust the displacement of the channel independently to the 0.00 decimal, again for VERY fine tuning.
This is great for reversals while eliminating noise from false signals, keeping the chart nice and clean. Should be used in combination with other indicators for the best confirmations.
Open-Based Percentage Levelsv2
This is an updated version of my original script.
Changes:
I took off the displacement levels since there served no purpose on this script.
I also fixed it to where the percentage level lines are visible continually throughout the entire trading day. Old version had these lines disappearing.
I also updated the name to better reflect its purpose.
Now only works on 30 min and below as the higher time frames are meaningless. The older version allow higher time frames and the code is open source to adjust as desired

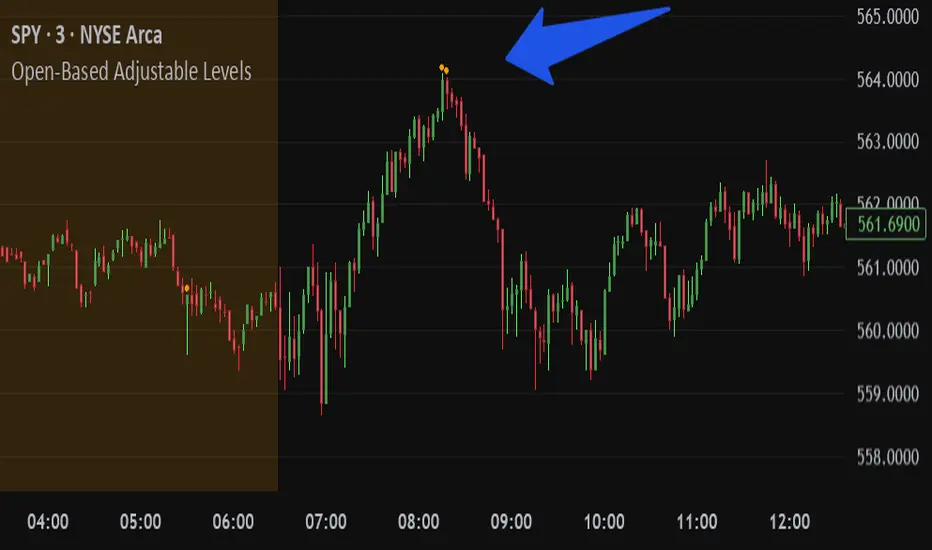
Open-Based Adjustable LevelsThis indicator gives signals for levels where the buy or sell volume is above adjustable levels (ex, volume at 100,000). And these levels will only signal after the price has gone above/below a certain 'adjustable' percentage of the stocks opening price.
Example: Signal sell when the price action is 0.7% above market opening price and when sell volume is above 120,000
or
Signal buy when buy volume is above 80,000 and the price is 0.5% below market opening price.
Great for day trading and detecting potential swings in the market. Above image is on a 3min chart.
Doesn't work as well on daily time frames or above.
Should be combined with other indicators like buy/sell channels, for the best confirmations
The Ultimate Buy and Sell Indicator: Unholy Grail Edition"You see, Watson, the market is not random—it simply whispers in a code too complex for the average trader. Lucky for you, I am not average."
They searched for the Holy Grail of trading for decades—promises, false prophets, and overpriced PDFs.
But they were all looking in the wrong place.
This isn’t a relic buried in the desert.
This is the Unholy Grail — a machine-forged fusion of logic, engineering, and tactical overkill .
Built by Sherlock Macgyver , this is not a mystical object. It’s a surveillance system for trend detection, signal validation, and precision entries .
⚠️ Important: This script draws its own candles.
To see it properly, disable regular candles by turning off "Body", "Wick" and "Border" colors.
🔧 What You’re Looking At
This overlay plots confirmed Buy/Sell signals , momentum-based “watch” zones , adaptive candle coloring , SuperTrend bias detection , dual Bollinger Bands , and a moving average ribbon .
It’s not “minimalist” —it’s comprehensive .
📍 Configuring the Tool: Follow the Breadcrumbs
Every setting includes a tooltip — read them . They're not filler. They explain exactly how each feature functions so you can dial this thing in like you're tuning a surveillance rig in a Cold War bunker .
If you skip them, you're walking blind in a minefield .
🕰️ Timeframes: The Signal Sweet Spot
Each asset has a tempo . You need to find the one where signals align with clarity —not chaos .
Start with 4H or 1H —work up or down from there.
Too many fakeouts? → Higher timeframe
Too slow? → Drop to 15m or 5m —but expect more noise and adjust settings accordingly.
The signals scale with time, but you must find the rhythm that best fits your asset—and your trading lifestyle .
♻️ RSI Cycle = Signal Sensitivity
This is the heart of the system . It controls how reactive the RSI engine is.
Adjust based on noise level and how often you can actually monitor your charts.
Short cycle (14–24): More signals, more speed, more noise
Longer cycle (36–64): Smoother entries, better for swing traders
Tip: If your signals feel too jittery, increase the cycle. If they lag too much, reduce it.
📉 SuperTrend: Your Trend Bias Compass
This isn’t your average SuperTrend. It adapts with RSI overlay logic and detects market “silence” via EMA compression— turning white right before the chaos . That said, you still control its aggression.
ATR Length = how many bars to average
ATR Factor = how tight or loose it hugs price
Lower = more sensitive (more trades, more noise)
Higher = confirmation only (fewer, but stronger signals)
Tweak until it feels like a sniper rifle.
No, you won’t get it perfect on the first try.
Yes, it’s worth it.
🛠️ Modular Signals: Why Things Fire (or Don’t)
Buy/Sell entries require conditions to align. The logic is modular, and that’s on purpose.
RSI signals only fire if RSI crosses its smoothed MA outside the dead zone and a “Watch” condition is active.
SuperTrend signals can be enabled to act on crossovers, optionally ignoring the Watch filter .
Watch conditions (colored squares) act as early recon and hint at possible upcoming trades.
Background color changes are “pre-signal warnings” and will repaint . Use them as leading signals, not gospel.
Want more trades? Loosen your filters .
Want sniper entries? Lock them down .
🌈 Candles and MAs: Visual Market Structure
Candles adapt in real-time to MA structure:
Green = bullish (above both fast/slow MAs)
Yellow = indecision (between)
Red = bearish (below both)
Buy/Sell signals override candles with bright orange and fuchsia —because subtlety doesn’t win wars .
You can also enable up to 8 customizable moving averages —great for confluence , trend confirmation , or just looking like a wizard .
🧠 Pro Usage Tips (TL;DR for Smart People):
Use tooltips in the settings menu —every toggle and slider is explained
Test timeframes until signal frequency and reliability match your goals
Adjust RSI cycle to reduce noise or speed up signals based on how frequently you trade
Tweak SuperTrend factor and ATR to fit volatility on your asset
Start with visual confirmation :
• Are watch signals lining up with trend zones?
• Are backgrounds firing before price moves?
• Are candle colors agreeing with signal direction?
📣 Alerts & Integration
Alerts are available for:
Buy/Sell entries (confirmed or advanced background)
Watch signals
Full band agreement (both Bollinger bands bullish or bearish)
Use these with webhook systems , bots , or your own trade journals .
Created by Sherlock Macgyver
Because sometimes the best trade…
is knowing exactly when not to take one.

Cointegration Buy and Sell Signals [EdgeTerminal]The Cointegration Buy And Sell Signals is a sophisticated technical analysis tool to spot high-probability market turning points — before they fully develop on price charts.
Most reversal indicators rely on raw price action, visual patterns, or basic and common indicator logic — which often suffer in noisy or trending markets. In most cases, they lag behind the actual change in trend and provide useless and late signals.
This indicator is rooted in advanced concepts from statistical arbitrage, mean reversion theory, and quantitative finance, and it packages these ideas in a user-friendly visual format that works on any timeframe and asset class.
It does this by analyzing how the short-term and long-term EMAs behave relative to each other — and uses statistical filters like Z-score, correlation, volatility normalization, and stationarity tests to issue highly selective Buy and Sell signals.
This tool provides statistical confirmation of trend exhaustion, allowing you to trade mean-reverting setups. It fades overextended moves and uses signal stacking to reduce false entries. The entire indicator is based on a very interesting mathematically grounded model which I will get into down below.
Here’s how the indicator works at a high level:
EMAs as Anchors: It starts with two Exponential Moving Averages (EMAs) — one short-term and one long-term — to track market direction.
Statistical Spread (Regression Residuals): It performs a rolling linear regression between the short and long EMA. Instead of using the raw difference (short - long), it calculates the regression residual, which better models their natural relationship.
Normalize the Spread: The spread is divided by historical price volatility (ATR) to make it scale-invariant. This ensures the indicator works on low-priced stocks, high-priced indices, and crypto alike.
Z-Score: It computes a Z-score of the normalized spread to measure how “extreme” the current deviation is from its historical average.
Dynamic Thresholds: Unlike most tools that use fixed thresholds (like Z = ±2), this one calculates dynamic thresholds using historical percentiles (e.g., top 10% and bottom 10%) so that it adapts to the asset's current behavior to reduce false signals based on market’s extreme volatility at a certain time.
Z-Score Momentum: It tracks the direction of the Z-score — if Z is extreme but still moving away from zero, it's too early. It waits for reversion to start (Z momentum flips).
Correlation Check: Uses a rolling Pearson correlation to confirm the two EMAs are still statistically related. If they diverge (low correlation), no signal is shown.
Stationarity Filter (ADF-like): Uses the volatility of the regression residual to determine if the spread is stationary (mean-reverting) — a key concept in cointegration and statistical arbitrage. It’s not possible to build an exact ADF filter in Pine Script so we used the next best thing.
Signal Control: Prevents noisy charts and overtrading by ensuring no back-to-back buy or sell signals. Each signal must alternate and respect a cooldown period so you won’t be overwhelmed and won’t get a messy chart.
Important Notes to Remember:
The whole idea behind this indicator is to try to use some stat arb models to detect shifting patterns faster than they appear on common indicators, so in some cases, some assumptions are made based on historic values.
This means that in some cases, the indicator can “jump” into the conclusion too quickly. Although we try to eliminate this by using stationary filters, correlation checks, and Z-score momentum detection, there is still a chance some signals that are generated can be too early, in the stock market, that's the same as being incorrect. So make sure to use this with other indicators to confirm the movement.
How To Use The Indicator:
You can use the indicator as a standalone reversal system, as a filter for overbought and oversold setups, in combination with other trend indicators and as a part of a signal stack with other common indicators for divergence spotting and fade trades.
The indicator produces simple buy and sell signals when all criteria is met. Based on our own testing, we recommend treating these signals as standalone and independent from each other . Meaning that if you take position after a buy signal, don’t wait for a sell signal to appear to exit the trade and vice versa.
This is why we recommend using this indicator with other advanced or even simple indicators as an early confirmation tool.
The Display Table:
The floating diagnostic table in the top-right corner of the chart is a key part of this indicator. It's a live statistical dashboard that helps you understand why a signal is (or isn’t) being triggered, and whether the market conditions are lining up for a potential reversal.
1. Z-Score
What it shows: The current Z-score value of the volatility-normalized spread between the short EMA and the regression line of the long EMA.
Why it matters: Z-score tells you how statistically extreme the current relationship is. A Z-score of:
0 = perfectly average
> +2 = very overbought
< -2 = very oversold
How to use it: Look for Z-score reaching extreme highs or lows (beyond dynamic thresholds). Watch for it to start reversing direction, especially when paired with green table rows (see below)
2. Z-Score Momentum
What it shows: The rate of change (ROC) of the Z-score:
Zmomentum=Zt − Zt − 1
Why it matters: This tells you if the Z-score is still stretching out (e.g., getting more overbought/oversold), or reverting back toward the mean.
How to use it: A positive Z-momentum after a very low Z-score = potential bullish reversal A negative Z-momentum after a very high Z-score = potential bearish reversal. Avoid signals when momentum is still pushing deeper into extremes
3. Correlation
What it shows: The rolling Pearson correlation coefficient between the short EMA and long EMA.
Why it matters: High correlation (closer to +1) means the EMAs are still statistically connected — a key requirement for cointegration or mean reversion to be valid.
How to use it: Look for correlation > 0.7 for reliable signals. If correlation drops below 0.5, ignore the Z-score — the EMAs aren’t moving together anymore
4. Stationary
What it shows: A simplified "Yes" or "No" answer to the question:
“Is the spread statistically stable (stationary) and mean-reverting right now?”
Why it matters: Mean reversion strategies only work when the spread is stationary — that is, when the distance between EMAs behaves like a rubber band, not a drifting cloud.
How to use it: A "Yes" means the indicator sees a consistent, stable spread — good for trading. "No" means the market is too volatile, disjointed, or chaotic for reliable mean reversion. Wait for this to flip to "Yes" before trusting signals
5. Last Signal
What it shows: The last signal issued by the system — either "Buy", "Sell", or "None"
Why it matters: Helps avoid confusion and repeated entries. Signals only alternate — you won’t get another Buy until a Sell happens, and vice versa.
How to use it: If the last signal was a "Buy", and you’re watching for a Sell, don’t act on more bullish signals. Great for systems where you only want one position open at a time
6. Bars Since Signal
What it shows: How many bars (candles) have passed since the last Buy or Sell signal.
Why it matters: Gives you context for how long the current condition has persisted
How to use it: If it says 1 or 2, a signal just happened — avoid jumping in late. If it’s been 10+ bars, a new opportunity might be brewing soon. You can use this to time exits if you want to fade a recent signal manually
Indicator Settings:
Short EMA: Sets the short-term EMA period. The smaller the number, the more reactive and more signals you get.
Long EMA: Sets the slow EMA period. The larger this number is, the smoother baseline, and more reliable trend bases are generated.
Z-Score Lookback: The period or bars used for mean & std deviation of spread between short and long EMAs. Larger values result in smoother signals with fewer false positives.
Volatility Window: This value normalizes the spread by historical volatility. This allows you to prevent scale distortion, showing you a cleaner and better chart.
Correlation Lookback: How many periods or how far back to test correlation between slow and long EMAs. This filters out false positives when EMAs lose alignment.
Hurst Lookback: The multiplier to approximate stationarity. Lower leads to more sensitivity to regime change, higher produces a more stricter filtering.
Z Threshold Percentile: This value sets how extreme Z-score must be to trigger a signal. For example, 90 equals only top/bottom 10% of extremes, 80 = more frequent.
Min Bars Between Signals: This hard stop prevents back-to-back signals. The idea is to avoid over-trading or whipsaws in volatile markets even when Hurst lookback and volatility window values are not enough to filter signals.
Some More Recommendations:
We recommend trying different EMA pairs (10/50, 21/100, 5/20) for different asset behaviors. You can set percentile to 85 or 80 if you want more frequent but looser signals. You can also use the Z-score reversion monitor for powerful confirmation.

Easy MA SignalsEasy MA Signals
Overview
Easy MA Signals is a versatile Pine Script indicator designed to help traders visualize moving average (MA) trends, generate buy/sell signals based on crossovers or custom price levels, and enhance chart analysis with volume-based candlestick coloring. Built with flexibility in mind, it supports multiple MA types, crossover options, and customizable signal appearances, making it suitable for traders of all levels. Whether you're a day trader, swing trader, or long-term investor, this indicator provides actionable insights while keeping your charts clean and intuitive.
Configure the Settings
The indicator is divided into three input groups for ease of use:
General Settings:
Candlestick Color Scheme: Choose from 10 volume-based color schemes (e.g., Sapphire Pulse, Emerald Spark) to highlight high/low volume candles. Select “None” for TradingView’s default colors.
Moving Average Length: Set the MA period (default: 20). Adjust for faster (lower values) or slower (higher values) signals.
Moving Average Type: Choose between SMA, EMA, or WMA (default: EMA).
Show Buy/Sell Signals: Enable/disable signal plotting (default: enabled).
Moving Average Crossover: Select a crossover type (e.g., MA vs VWAP, MA vs SMA50) for signals or “None” to disable.
Volume Influence: Adjust how volume impacts candlestick colors (default: 1.2). Higher values make thresholds stricter.
Signal Appearance Settings:
Buy/Sell Signal Shape: Choose shapes like triangles, arrows, or labels for signals.
Buy/Sell Signal Position: Place signals above or below bars.
Buy/Sell Signal Color: Customize colors for better visibility (default: green for buy, red for sell).
Custom Price Alerts:
Custom Buy/Sell Alert Price: Set specific price levels for alerts (default: 0, disabled). Enter a non-zero value to enable.
Set Up Alerts
To receive notifications (e.g., sound, popup, email) when signals or custom price levels are hit:
Click the Alert button (alarm clock icon) in TradingView.
Select Easy MA Signals as the condition and choose one of the four alert types:
MA Crossover Buy Alert: Triggers on MA crossover buy signals.
MA Crossover Sell Alert: Triggers on MA crossover sell signals.
Custom Buy Alert: Triggers when price crosses above the custom buy price.
Custom Sell Alert: Triggers when price crosses below the custom sell price.
Enable Play Sound and select a sound (e.g., “Bell”).
Set the frequency (e.g., Once Per Bar Close for confirmed signals) and create the alert.
Analyze the Chart
Moving Average Line: Displays the selected MA with color changes (green for bullish, red for bearish, gray for neutral) based on price position relative to the MA.
Buy/Sell Signals: Appear as shapes or labels when crossovers or custom price levels are hit.
Candlestick Colors: If a color scheme is selected, candles change color based on volume strength (high, low, or neutral), aiding in trend confirmation.
Why Use Easy MA Signals?
Easy MA Signals is designed to simplify technical analysis while offering advanced customization. It’s ideal for traders who want:
A clear visualization of MA trends and crossovers.
Flexible signal generation based on MA crossovers or custom price levels.
Volume-enhanced candlestick coloring to identify market strength.
Easy-to-use settings with tooltips for beginners and pros alike.
This script is particularly valuable because it combines multiple features into one indicator, reducing chart clutter and providing actionable insights without overwhelming the user.
Benefits of Easy MA Signals
Highly Customizable: Supports SMA, EMA, and WMA with adjustable lengths.
Offers multiple crossover options (VWAP, SMA10, SMA20, etc.) for tailored strategies.
Custom price alerts allow precise targeting of key levels.
Volume-Based Candlestick Coloring: 10 unique color schemes highlight volume strength, helping traders confirm trends.
Adjustable volume influence ensures adaptability to different markets.
Flexible Signal Visualization: Choose from various signal shapes (triangles, arrows, labels) and positions (above/below bars).
Customizable colors improve visibility on any chart background.
Alert Integration: Built-in alert conditions for crossovers and custom prices support sound, email, and app notifications.
Easy setup for real-time trading decisions.
User-Friendly Design: Organized input groups with clear tooltips make configuration intuitive.
Suitable for beginners and advanced traders alike.
Example Use Cases
Swing Trading with MA Crossovers:
Scenario: A trader wants to trade Bitcoin (BTC/USD) on a 4-hour chart using an EMA crossover strategy.
Setup:
Set Moving Average Type to EMA, Length to 20.
Set Moving Average Crossover to “MA vs SMA50”.
Enable Show Buy/Sell Signals and choose “arrowup” for buy, “arrowdown” for sell.
Select “Emerald Spark” for candlestick colors to highlight volume surges.
Usage: Buy when the EMA20 crosses above the SMA50 (green arrow appears) and volume is high (dark green candles). Sell when the EMA20 crosses below the SMA50 (red arrow). Set alerts for real-time notifications.
Scalping with Custom Price Alerts:
Scenario: A day trader monitors Tesla (TSLA) on a 5-minute chart and wants alerts at specific support/resistance levels.
Setup:
Set Custom Buy Alert Price to 150.00 (support) and Custom Sell Alert Price to 160.00 (resistance).
Use “labelup” for buy signals and “labeldown” for sell signals.
Keep Moving Average Crossover as “None” to focus on price alerts.
Usage: Receive a sound alert and label when TSLA crosses 150.00 (buy) or 160.00 (sell). Use volume-colored candles to confirm momentum before entering trades.
When NOT to Use Easy MA Signals
High-Frequency Trading: Reason: The indicator relies on moving averages and volume, which may lag in ultra-fast markets (e.g., sub-second trades). High-frequency traders may need specialized tools with real-time tick data.
Alternative: Use order book or market depth indicators for faster execution.
Low-Volatility or Sideways Markets:
Reason: MA crossovers and custom price alerts can generate false signals in choppy, range-bound markets, leading to whipsaws.
Alternative: Use oscillators like RSI or Bollinger Bands to trade within ranges.
This indicator is tailored more towards less experienced traders. And as always, paper trade until you are comfortable with how this works if you're unfamiliar with trading! We hope you enjoy this and have great success. Thanks for your interested in Easy MA Signals!

ScalpSwing Pro SetupScript Overview
This script is a multi-tool setup designed for both scalping (1m–5m) and swing trading (1H–4H–Daily). It combines the power of trend-following , momentum , and mean-reversion tools:
What’s Included in the Script
1. EMA Indicators (20, 50, 200)
- EMA 20 (blue) : Short-term trend
- EMA 50 (orange) : Medium-term trend
- EMA 200 (red) : Long-term trend
- Use:
- EMA 20 crossing above 50 → bullish trend
- EMA 20 crossing below 50 → bearish trend
- Price above 200 EMA = uptrend bias
2. VWAP (Volume Weighted Average Price)
- Shows the average price weighted by volume
- Best used in intraday (1m to 15m timeframes)
- Use:
- Price bouncing from VWAP = reversion trade
- Price far from VWAP = likely pullback incoming
3. RSI (14) + Key Levels
- Shows momentum and overbought/oversold zones
- Levels:
- 70 = Overbought (potential sell)
- 30 = Oversold (potential buy)
- 50 = Trend confirmation
- Use:
- RSI 30–50 in uptrend = dip buying zone
- RSI 70–50 in downtrend = pullback selling zone
4. MACD Crossovers
- Standard MACD with histogram & cross alerts
- Shows trend momentum shifts
- Green triangle = Bullish MACD crossover
- Red triangle = Bearish MACD crossover
- Use:
- Confirm swing trades with MACD crossover
- Combine with RSI divergence
5. Buy & Sell Signal Logic
BUY SIGNAL triggers when:
- EMA 20 crosses above EMA 50
- RSI is between 50 and 70 (momentum bullish, not overbought)
SELL SIGNAL triggers when:
- EMA 20 crosses below EMA 50
- RSI is between 30 and 50 (bearish momentum, not oversold)
These signals appear as:
- BUY : Green label below the candle
- SELL : Red label above the candle
How to Trade with It
For Scalping (1m–5m) :
- Focus on EMA crosses near VWAP
- Confirm with RSI between 50–70 (buy) or 50–30 (sell)
- Use MACD triangle as added confluence
For Swing (1H–4H–Daily) :
- Look for EMA 20–50 cross + price above EMA 200
- Confirm trend with MACD and RSI
- Trade breakout or pullback depending on structure

Reversal Trading Bot Strategy[BullByte]Overview :
The indicator Reversal Trading Bot Strategy is crafted to capture potential market reversal points by combining momentum, volatility, and trend alignment filters. It uses a blend of technical indicators to identify both bullish and bearish reversal setups, ensuring that multiple market conditions are met before entering a trade.
Core Components :
Technical Indicators Used :
RSI (Relative Strength Index) :
Purpose : Detects divergence conditions by comparing recent lows/highs in price with the RSI.
Parameter : Length of 8.
Bollinger Bands (BB) :
Purpose : Measures volatility and identifies price levels that are statistically extreme.
Parameter : Length of 20 and a 2-standard deviation multiplier.
ADX (Average Directional Index) & DMI (Directional Movement Index) :
Purpose : Quantifies the strength of the trend. The ADX threshold is set at 20, and additional filters check for the alignment of the directional indicators (DI+ and DI–).
ATR (Average True Range) :
Purpose : Provides a volatility measure used to set stop levels and determine risk through trailing stops.
Volume SMA (Simple Moving Average of Volume ):
Purpose : Helps confirm strength by comparing the current volume against a 20-period average, with an optional filter to ensure volume is at least twice the SMA.
User-Defined Toggle Filters :
Volume Filter : Confirms that the volume is above average (or twice the SMA) before taking trades.
ADX Trend Alignment Filter : Checks that the ADX’s directional indicators support the trade direction.
BB Close Confirmation : Optionally refines the entry by requiring price to be beyond the upper or lower Bollinger Band rather than just above or below.
RSI Divergence Exit : Allows the script to close positions if RSI divergence is detected.
BB Mean Reversion Exit : Closes positions if the price reverts to the Bollinger Bands’ middle line.
Risk/Reward Filter : Ensures that the potential reward is at least twice the risk by comparing the distance to the Bollinger Band with the ATR.
Candle Movement Filter : Optional filter to require a minimum percentage move in the candle to confirm momentum.
ADX Trend Exit : Closes positions if the ADX falls below the threshold and the directional indicators reverse.
Entry Conditions :
Bullish Entry :
RSI Divergence : Checks if the current close is lower than a previous low while the RSI is above the previous low, suggesting bullish divergence.
Bollinger Confirmation : Requires that the price is above the lower (or upper if confirmation is toggled) Bollinger Band.
Volume & Trend Filters : Combines volume condition, ADX strength, and an optional candle momentum condition.
Risk/Reward Check : Validates that the trade meets a favorable risk-to-reward ratio.
Bearish Entry :
Uses a mirror logic of the bullish entry by checking for bearish divergence, ensuring the price is below the appropriate Bollinger level, and confirming volume, trend strength, candle pattern, and risk/reward criteria.
Trade Execution and Exit Strateg y:
Trade Execution :
Upon meeting the entry conditions, the strategy initiates a long or short position.
Stop Loss & Trailing Stops :
A stop-loss is dynamically set using the ATR value, and trailing stops are implemented as a percentage of the close price.
Exit Conditions :
Additional exit filters can trigger early closures based on RSI divergence, mean reversion (via the middle Bollinger Band), or a weakening trend as signaled by ADX falling below its threshold.
This multi-layered exit strategy is designed to lock in gains or minimize losses if the market begins to reverse unexpectedly.
How the Strategy Works in Different Market Conditions :
Trending Markets :
The ADX filter ensures that trades are only taken when the trend is strong. When the market is trending, the directional movement indicators help confirm the momentum, making the reversal signal more reliable.
Ranging Markets :
In choppy markets, the Bollinger Bands expand and contract, while the RSI divergence can highlight potential turning points. The optional filters can be adjusted to avoid false signals in low-volume or low-volatility conditions.
Volatility Management :
With ATR-based stop-losses and a risk/reward filter, the strategy adapts to current market volatility, ensuring that risk is managed consistently.
Recommendation on using this Strategy with a Trading Bot :
This strategy is well-suited for high-frequency trading (HFT) due to its ability to quickly identify reversal setups and execute trades dynamically with automated stop-loss and trailing exits. By integrating this script with a TradingView webhook-based bot or an API-driven execution system, traders can automate trade entries and exits in real-time, reducing manual execution delays and capitalizing on fast market movements.
Disclaimer :
This script is provided for educational and informational purposes only. It is not intended as investment advice. Trading involves significant risk, and you should always conduct your own research and analysis before making any trading decisions. The author is not responsible for any losses incurred while using this script.

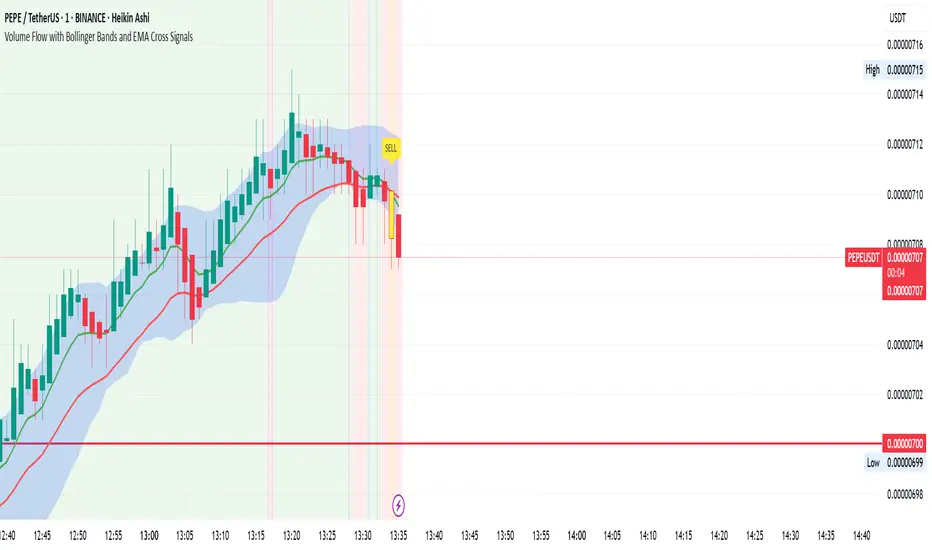
Volume Flow with Bollinger Bands and EMA Cross SignalsThe Volume Flow with Bollinger Bands and EMA Cross Signals indicator is a custom technical analysis tool designed to identify potential buy and sell signals based on several key components:
Volume Flow: This component combines price movement and trading volume to create a signal that indicates the strength or weakness of price movements. When the price is rising with increasing volume, it suggests strong buying activity, whereas falling prices with increasing volume indicate strong selling pressure.
Bollinger Bands: Bollinger Bands consist of three lines:
The Basis (middle line), which is a Simple Moving Average (SMA) of the price over a set period.
The Upper Band, which is the Basis plus a multiple of the standard deviation (typically 2).
The Lower Band, which is the Basis minus a multiple of the standard deviation. Bollinger Bands help identify periods of high volatility and potential overbought/oversold conditions. When the price touches the upper band, it might indicate that the market is overbought, while touching the lower band might indicate oversold conditions.
EMA Crossovers: The script includes two Exponential Moving Averages (EMAs):
Fast EMA: A shorter-term EMA, typically more sensitive to price changes.
Slow EMA: A longer-term EMA, responding slower to price changes. The crossover of the Fast EMA crossing above the Slow EMA (bullish crossover) signals a potential buy opportunity, while the Fast EMA crossing below the Slow EMA (bearish crossover) signals a potential sell opportunity.
Background Color and Candle Color: The indicator highlights the chart's background with specific colors based on the signals:
Green background for buy signals.
Yellow background for sell signals. Additionally, the candles are colored green for buy signals and yellow for sell signals to visually reinforce the trade opportunities.
Buy/Sell Labels: Small labels are placed on the chart:
"BUY" label in green is placed below the bar when a buy signal is generated.
"SELL" label in yellow is placed above the bar when a sell signal is generated.
Working of the Indicator:
Volume Flow Calculation: The Volume Flow is calculated by multiplying the price change (current close minus the previous close) with the volume. This product is then smoothed with a Simple Moving Average (SMA) over a user-defined period (length). The result is then multiplied by a multiplier to adjust its sensitivity.
Price Change = close - close
Volume Flow = Price Change * Volume
Smoothed Volume Flow = SMA(Volume Flow, length)
The Volume Flow Signal is then: Smooth Volume Flow * Multiplier
This calculation represents the buying or selling pressure in the market.
Bollinger Bands: Bollinger Bands are calculated using the Simple Moving Average (SMA) of the closing price (basis) and the Standard Deviation (stdev) of the price over a period defined by the user (bb_length).
Basis (Middle Band) = SMA(close, bb_length)
Upper Band = Basis + (bb_std_dev * Stdev)
Lower Band = Basis - (bb_std_dev * Stdev)
The upper and lower bands are plotted alongside the price to identify the price's volatility. When the price is near the upper band, it could be overbought, and near the lower band, it could be oversold.
EMA Crossovers: The Fast EMA and Slow EMA are calculated using the Exponential Moving Average (EMA) function. The crossovers are detected by checking:
Buy Signal (Bullish Crossover): When the Fast EMA crosses above the Slow EMA.
Sell Signal (Bearish Crossover): When the Fast EMA crosses below the Slow EMA.
The long_condition variable checks if the Fast EMA crosses above the Slow EMA, and the short_condition checks if it crosses below.
Visual Signals:
Background Color: The background is colored green for a buy signal and yellow for a sell signal. This gives an immediate visual cue to the trader.
Bar Color: The candles are colored green for buy signals and yellow for sell signals.
Labels:
A "BUY" label in green appears below the bar when the Fast EMA crosses above the Slow EMA.
A "SELL" label in yellow appears above the bar when the Fast EMA crosses below the Slow EMA.
Summary of Buy/Sell Logic:
Buy Signal:
The Fast EMA crosses above the Slow EMA (bullish crossover).
Volume flow is positive, indicating buying pressure.
Background turns green and candles are colored green.
A "BUY" label appears below the bar.
Sell Signal:
The Fast EMA crosses below the Slow EMA (bearish crossover).
Volume flow is negative, indicating selling pressure.
Background turns yellow and candles are colored yellow.
A "SELL" label appears above the bar.
Usage of the Indicator:
This indicator is designed to help traders identify potential entry (buy) and exit (sell) points based on:
The interaction of Exponential Moving Averages (EMAs).
The strength and direction of Volume Flow.
Price volatility using Bollinger Bands.
By combining these components, the indicator provides a comprehensive view of market conditions, helping traders make informed decisions on when to enter and exit trades.
Smart Grid Scalping (Pullback) Strategy[BullByte]The Smart Grid Scalping (Pullback) Strategy is a high-frequency trading strategy designed for short-term traders who seek to capitalize on market pullbacks. This strategy utilizes a dynamic ATR-based grid system to define optimal entry points, ensuring precise trade execution. It integrates volatility filtering and an RSI-based confirmation mechanism to enhance signal accuracy and reduce false entries.
This strategy is specifically optimized for scalping by dynamically adjusting trade levels based on current market conditions. The grid-based system helps capture retracement opportunities while maintaining strict trade management through predefined profit targets and trailing stop-loss mechanisms.
Key Features :
1. ATR-Based Grid System :
- Uses a 10-period ATR to dynamically calculate grid levels for entry points.
- Prevents chasing trades by ensuring price has reached key levels before executing entries.
2. No Trade Zone Protection :
- Avoids low-volatility zones where price action is indecisive.
- Ensures only high-momentum trades are executed to improve success rate.
3. RSI-Based Entry Confirmation :
- Long trades are triggered when RSI is below 30 (oversold) and price is in the lower grid zone.
- Short trades are triggered when RSI is above 70 (overbought) and price is in the upper grid zone.
4. Automated Trade Execution :
- Long Entry: Triggered when price drops below the first grid level with sufficient volatility.
- Short Entry: Triggered when price exceeds the highest grid level with sufficient volatility.
5. Take Profit & Trailing Stop :
- Profit target set at a customizable percentage (default 0.2%).
- Adaptive trailing stop mechanism using ATR to lock in profits while minimizing premature exits.
6. Visual Trade Annotations :
- Clearly labeled "LONG" and "SHORT" markers appear at trade entries for better visualization.
- Grid levels are plotted dynamically to aid decision-making.
Strategy Logic :
- The script first calculates the ATR-based grid levels and ensures price action has sufficient volatility before allowing trades.
- An additional RSI filter is used to ensure trades are taken at ideal market conditions.
- Once a trade is executed, the script implements a trailing stop and predefined take profit to maximize gains while reducing risks.
---
Disclaimer :
Risk Warning :
This strategy is provided for educational and informational purposes only. Trading involves significant risk, and past performance is not indicative of future results. Users are advised to conduct their own due diligence and risk management before using this strategy in live trading.
The developer and publisher of this script are not responsible for any financial losses incurred by the use of this strategy. Market conditions, slippage, and execution quality can affect real-world trading outcomes.
Use this script at your own discretion and always trade responsibly.

Uptrick: Z-Score FlowOverview
Uptrick: Z-Score Flow is a technical indicator that integrates trend-sensitive momentum analysi s with mean-reversion logic derived from Z-Score calculations. Its primary objective is to identify market conditions where price has either stretched too far from its mean (overbought or oversold) or sits at a statistically “normal” range, and then cross-reference this observation with trend direction and RSI-based momentum signals. The result is a more contextual approach to trade entry and exit, emphasizing precision, clarity, and adaptability across varying market regimes.
Introduction
Financial instruments frequently transition between trending modes, where price extends strongly in one direction, and ranging modes, where price oscillates around a central value. A simple statistical measure like Z-Score can highlight price extremes by comparing the current price against its historical mean and standard deviation. However, such extremes alone can be misleading if the broader market structure is trending forcefully. Uptrick: Z-Score Flow aims to solve this gap by combining Z-Score with an exponential moving average (EMA) trend filter and a smoothed RSI momentum check, thus filtering out signals that contradict the prevailing market environment.
Purpose
The purpose of this script is to help traders pinpoint both mean-reversion opportunities and trend-based pullbacks in a way that is statistically grounded yet still mindful of overarching price action. By pairing Z-Score thresholds with supportive conditions, the script reduces the likelihood of acting on random price spikes or dips and instead focuses on movements that are significant within both historical and current contextual frameworks.
Originality and Uniquness
Layered Signal Verification: Signals require the fulfillment of multiple layers (Z-Score extreme, EMA trend bias, and RSI momentum posture) rather than merely breaching a statistical threshold.
RSI Zone Lockout: Once RSI enters an overbought/oversold zone and triggers a signal, the script locks out subsequent signals until RSI recovers above or below those zones, limiting back-to-back triggers.
Controlled Cooldown: A dedicated cooldown mechanic ensures that the script waits a specified number of bars before issuing a new signal in the opposite direction.
Gradient-Based Visualization: Distinct gradient fills between price and the Z-Mean line enhance readability, showing at a glance whether price is trading above or below its statistical average.
Comprehensive Metrics Panel: An optional on-chart table summarizes the Z-Score’s key metrics, streamlining the process of verifying current statistical extremes, mean levels, and momentum directions.
Why these indicators were merged
Z-Score measurements excel at identifying when price deviates from its mean, but they do not intrinsically reveal whether the market’s trajectory supports a reversion or if price might continue along its trend. The EMA, commonly used for spotting trend directions, offers valuable insight into whether price is predominantly ascending or descending. However, relying solely on a trend filter overlooks the intensity of price moves. RSI then adds a dedicated measure of momentum, helping confirm if the market’s energy aligns with a potential reversal (for example, price is statistically low but RSI suggests looming upward momentum). By uniting these three lenses—Z-Score for statistical context, EMA for trend direction, and RSI for momentum force—the script offers a more comprehensive and adaptable system, aiming to avoid false positives caused by focusing on just one aspect of price behavior.
Calculations
The core calculation begins with a simple moving average (SMA) of price over zLen bars, referred to as the basis. Next, the script computes the standard deviation of price over the same window. Dividing the difference between the current price and the basis by this standard deviation produces the Z-Score, indicating how many standard deviations the price is from its mean. A positive Z-Score reveals price is above its average; a negative reading indicates the opposite.
To detect overall market direction, the script calculates an exponential moving average (emaTrend) over emaTrendLen bars. If price is above this EMA, the script deems the market bullish; if below, it’s considered bearish. For momentum confirmation, the script computes a standard RSI over rsiLen bars, then applies a smoothing EMA over rsiEmaLen bars. This smoothed RSI (rsiEma) is monitored for both its absolute level (oversold or overbought) and its slope (the difference between the current and previous value). Finally, slopeIndex determines how many bars back the script compares the basis to check whether the Z-Mean line is generally rising, falling, or flat, which then informs the coloring scheme on the chart.
Calculations and Rational
Simple Moving Average for Baseline: An SMA is used for the core mean because it places equal weight on each bar in the lookback period. This helps maintain a straightforward interpretation of overbought or oversold conditions in the context of a uniform historical average.
Standard Deviation for Volatility: Standard deviation measures the variability of the data around the mean. By dividing price’s difference from the mean by this value, the Z-Score can highlight whether price is unusually stretched given typical volatility.
Exponential Moving Average for Trend: Unlike an SMA, an EMA places more emphasis on recent data, reacting quicker to new price developments. This quicker response helps the script promptly identify trend shifts, which can be crucial for filtering out signals that go against a strong directional move.
RSI for Momentum Confirmation: RSI is an oscillator that gauges price movement strength by comparing average gains to average losses over a set period. By further smoothing this RSI with another EMA, short-lived oscillations become less influential, making signals more robust.
SlopeIndex for Slope-Based Coloring: To clarify whether the market’s central tendency is rising or falling, the script compares the basis now to its level slopeIndex bars ago. A higher current reading indicates an upward slope; a lower reading, a downward slope; and similar readings, a flat slope. This is visually represented on the chart, providing an immediate sense of the directionality.
Inputs
zLen (Z-Score Period)
Specifies how many bars to include for computing the SMA and standard deviation that form the basis of the Z-Score calculation. Larger values produce smoother but slower signals; smaller values catch quick changes but may generate noise.
emaTrendLen (EMA Trend Filter)
Sets the length of the EMA used to detect the market’s primary direction. This is pivotal for distinguishing whether signals should be considered (price aligning with an uptrend or downtrend) or filtered out.
rsiLen (RSI Length)
Defines the window for the initial RSI calculation. This RSI, when combined with the subsequent smoothing EMA, forms the foundation for momentum-based signal confirmations.
rsiEmaLen (EMA of RSI Period)
Applies an exponential moving average over the RSI readings for additional smoothing. This step helps mitigate rapid RSI fluctuations that might otherwise produce whipsaw signals.
zBuyLevel (Z-Score Buy Threshold)
Determines how negative the Z-Score must be for the script to consider a potential oversold signal. If the Z-Score dives below this threshold (and other criteria are met), a buy signal is generated.
zSellLevel (Z-Score Sell Threshold)
Determines how positive the Z-Score must be for a potential overbought signal. If the Z-Score surpasses this threshold (and other checks are satisfied), a sell signal is generated.
cooldownBars (Cooldown (Bars))
Enforces a bar-based delay between opposite signals. Once a buy signal has fired, the script must wait the specified number of bars before registering a new sell signal, and vice versa.
slopeIndex (Slope Sensitivity (Bars))
Specifies how many bars back the script compares the current basis for slope coloration. A bigger slopeIndex highlights larger directional trends, while a smaller number emphasizes shorter-term shifts.
showMeanLine (Show Z-Score Mean Line)
Enables or disables the plotting of the Z-Mean and its slope-based coloring. Traders who prefer minimal chart clutter may turn this off while still retaining signals.
Features
Statistical Core (Z-Score Detection):
This feature computes the Z-Score by taking the difference between the current price and the basis (SMA) and dividing by the standard deviation. In effect, it translates price fluctuations into a standardized measure that reveals how significant a move is relative to the typical variation seen over the lookback. When the Z-Score crosses predefined thresholds (zBuyLevel for oversold and zSellLevel for overbought), it signals that price could be at an extreme.
How It Works: On each bar, the script updates the SMA and standard deviation. The Z-Score is then refreshed accordingly. Traders can interpret particularly large negative or positive Z-Score values as scenarios where price is abnormally low or high.
EMA Trend Filter:
An EMA over emaTrendLen bars is used to classify the market as bullish if the price is above it and bearish if the price is below it. This classification is applied to the Z-Score signals, accepting them only when they align with the broader price direction.
How It Works: If the script detects a Z-Score below zBuyLevel, it further checks if price is actually in a downtrend (below EMA) before issuing a buy signal. This might seem counterintuitive, but a “downtrend” environment plus an oversold reading often signals a potential bounce or a mean-reversion play. Conversely, for sell signals, the script checks if the market is in an uptrend first. If it is, an overbought reading aligns with potential profit-taking.
RSI Momentum Confirmation with Oversold/Overbought Lockout:
RSI is calculated over rsiLen, then smoothed by an EMA over rsiEmaLen. If this smoothed RSI dips below a certain threshold (for example, 30) and then begins to slope upward, the indicator treats it as a potential sign of recovering momentum. Similarly, if RSI climbs above a certain threshold (for instance, 70) and starts to slope downward, that suggests dwindling momentum. Additionally, once RSI is in these zones, the indicator locks out repetitive signals until RSI fully exits and re-enters those extreme territories.
How It Works: Each bar, the script measures whether RSI has dropped below the oversold threshold (like 30) and has a positive slope. If it does, the buy side is considered “unlocked.” For sell signals, RSI must exceed an overbought threshold (70) and slope downward. The combination of threshold and slope helps confirm that a reversal is genuinely in progress instead of issuing signals while momentum remains weak or stuck in extremes.
Cooldown Mechanism:
The script features a custom bar-based cooldown that prevents issuing new signals in the opposite direction immediately after one is triggered. This helps avoid whipsaw situations where the market quickly flips from oversold to overbought or vice versa.
How It Works: When a buy signal fires, the indicator notes the bar index. If the Z-Score and RSI conditions later suggest a sell, the script compares the current bar index to the last buy signal’s bar index. If the difference is within cooldownBars, the signal is disallowed. This ensures a predefined “quiet period” before switching signals.
Slope-Based Coloring (Z-Mean Line and Shadow):
The script compares the current basis value to its value slopeIndex bars ago. A higher reading now indicates a generally upward slope, while a lower reading indicates a downward slope. The script then shades the Z-Mean line in a corresponding bullish or bearish color, or remains neutral if little change is detected.
How It Works: This slope calculation is refreshingly straightforward: basis – basis . If the result is positive, the line is colored bullish; if negative, it is colored bearish; if approximately zero, it remains neutral. This provides a quick visual cue of the medium-term directional bias.
Gradient Overlays:
With gradient fills, the script highlights where price stands in relation to the Z-Mean. When price is above the basis, a purple-shaded region is painted, visually indicating a “bearish zone” for potential overbought conditions. When price is below, a teal-like overlay is used, suggesting a “bullish zone” for potential oversold conditions.
How It Works: Each bar, the script checks if price is above or below the basis. It then applies a fill between close and basis, using distinct colors to show whether the market is trading above or below its mean. This creates an immediate sense of how extended the market might be.
Buy and Sell Labels (with Alerts):
When a legitimate buy or sell condition passes every check (Z-Score threshold, EMA trend alignment, RSI gating, and cooldown clearance), the script plots a corresponding label directly on the chart. It also fires an alert (if alerts are set up), making it convenient for traders who want timely notifications.
How It Works: If rawBuy or rawSell conditions are met (refined by RSI, EMA trend, and cooldown constraints), the script calls the respective plot function to paint an arrow label on the chart. Alerts are triggered simultaneously, carrying easily recognizable messages.
Metrics Table:
The optional on-chart table (activated by showMetrics) presents real-time Z-Score data, including the current Z-Score, its rolling mean, the maximum and minimum Z-Score values observed over the last zLen bars, a percentile position, and a short-term directional note (rising, falling, or flat).
Current – The present Z-Score reading
Mean – Average Z-Score over the zLen period
Min/Max – Lowest and highest Z-Score values within zLen
Position – Where the current Z-Score sits between the min and max (as a percentile)
Trend – Whether the Z-Score is increasing, decreasing, or flat
Conclusion
Uptrick: Z-Score Flow offers a versatile solution for traders who need a statistically informed perspective on price extremes combined with practical checks for overall trend and momentum. By leveraging a well-defined combination of Z-Score, EMA trend classification, RSI-based momentum gating, slope-based visualization, and a cooldown mechanic, the script reduces the occurrence of false or premature signals. Its gradient fills and optional metrics table contribute further clarity, ensuring that users can quickly assess market posture and make more confident trading decisions in real time.
Disclaimer
This script is intended solely for informational and educational purposes. Trading in any financial market comes with substantial risk, and there is no guarantee of success or the avoidance of loss. Historical performance does not ensure future results. Always conduct thorough research and consider professional guidance prior to making any investment or trading decisions.

Professional MSTI+ Trading Indicator"Professional MSTI+ Trading Indicator" is a comprehensive technical analysis tool that combines over 20 indicators to generate high-quality trading signals and assess market sentiment. The script integrates standard indicators (MACD, RSI, Bollinger Bands, Stochastic, Simple Moving Averages, and Volume Analysis) with advanced components (Squeeze Momentum, Fisher Transform, True Strength Index, Heikin-Ashi, Laguerre RSI, Hull MA) and further includes metrics such as ADX, Chaikin Money Flow, Williams %R, VWAP, and EMA for in-depth market analysis.
Key Features:
Multiple Presets for Different Trading Styles:
Choose from optimal configurations like Professional, Swing Trading, Day Trading, Scalping, or Reversal Hunter. Note that the presets may not work perfectly on all pairs, and manual calibration might be required. This flexibility allows you to fine-tune the settings to align with your unique strategies and signals.
Multi-Layered Signal Filtering:
Filters based on trend, volume, and volatility help eliminate false signals, enhancing the accuracy of market entries.
Comprehensive Fear & Greed Index:
The indicator aggregates data from RSI, volatility, momentum, trend, and volume to gauge overall market sentiment, providing an additional layer of market context.
Dynamic Information Panel:
Displays detailed status updates for each component (e.g., MACD, RSI, Laguerre RSI, TSI, Fisher Transform, Squeeze, Hull MA, etc.) along with a visual strength bar that represents the intensity of the trading signal.
Signal Generation:
Buy and sell signals are generated when a predefined number of conditions are met and confirmed over multiple bars. These signals are clearly displayed on the chart with arrows, making it easier to spot potential entry and exit points.
Alert Setup:
Built-in alert conditions allow you to receive real-time notifications when trading signals are generated, helping you stay on top of market movements.
"Professional MSTI+ Trading Indicator" is designed to enhance your trading strategy by providing a multi-faceted market analysis and an intuitive visual interface. While the presets offer a robust starting point, they may require manual calibration on certain pairs, giving you the flexibility to configure your own unique strategies and signals.

IDX - 5UPThe UDX-5UP is a custom indicator designed to assist traders in identifying trends, entry and exit signals, and market reversal moments with greater accuracy. It combines price analysis, volume, and momentum (RSI) to provide clear buy ("Buy") and sell ("Sell") signals across any asset and timeframe, whether you're a scalper on the 5M chart or a swing trader on the 4H chart. Inspired by robust technical analysis strategies, the UDX-5UP is ideal for traders seeking a reliable tool to operate in volatile markets such as cryptocurrencies, forex, stocks, and futures.
Components of the UDX-5UP
The UDX-5UP consists of three main panels that work together to provide a comprehensive view of the market:
Main Panel (Price):
Pivot Supertrend: A dynamic line that changes color to indicate the trend. Green for an uptrend (look for buys), red for a downtrend (look for sells).
SMAs (Simple Moving Averages): Two SMAs (8 and 21 periods) to confirm the trend direction. When the SMA 8 crosses above the SMA 21, it’s a bullish signal; when it crosses below, it’s a bearish signal.
Entry/Exit Signals: "Buy" (green) and "Sell" (red) labels are plotted on the chart when entry or exit conditions are met.
Volume Panel:
Colored Volume Bars: Green bars indicate dominant buying volume, while red bars indicate dominant selling volume.
Volume Moving Average (MA 20): A blue line that helps identify whether the current volume is above or below the average, confirming the strength of the movement.
RSI Panel:
RSI (Relative Strength Index): Calculated with a period of 14, with overbought (70) and oversold (30) lines to identify momentum extremes.
Divergences: The indicator detects divergences between the RSI and price, plotting signals for potential reversals.
How the UDX-5UP Works
The UDX-5UP uses a combination of rules to generate buy and sell signals:
Buy Signal ("Buy"):
The Pivot Supertrend changes from red to green.
The SMA 8 crosses above the SMA 21.
The volume is above the MA 20, with green bars (indicating buying pressure).
The RSI is rising and, ideally, below 70 (not overbought).
Example: On the 4H chart, the price of Tether (USDT) is at 0.05515. The Pivot Supertrend turns green, the SMA 8 crosses above the SMA 21, the volume shows green bars above the MA 20, and the RSI is at 46. The UDX-5UP plots a "Buy".
Sell Signal ("Sell"):
The Pivot Supertrend changes from green to red.
The SMA 8 crosses below the SMA 21.
The volume is above the MA 20, with red bars (indicating selling pressure).
The RSI is falling and, ideally, above 70 (overbought).
Example: On the 4H chart, the price of Tether rises to 0.05817. The Pivot Supertrend turns red, the SMA 8 crosses below the SMA 21, the volume shows red bars, and the RSI is above 70. The UDX-5UP plots a "Sell".
RSI Divergences:
The indicator identifies bullish divergences (price makes a lower low, but RSI makes a higher low) and bearish divergences (price makes a higher high, but RSI makes a lower high), plotting alerts for potential reversals.
Adjustable Settings
The UDX-5UP is highly customizable to suit your trading style:
Pivot Supertrend Period: Default is 2. Increase to 3 or 4 for more conservative signals (fewer false positives, but more lag).
SMA Periods: Default is 8 and 21. Adjust to 5 and 13 for smaller timeframes (e.g., 5M) or 13 and 34 for larger timeframes (e.g., 1D).
RSI Period: Default is 14. Reduce to 10 for greater sensitivity or increase to 20 for smoother signals.
Overbought/Oversold Levels: Default is 70/30. Adjust to 80/20 in volatile markets.
Display Panels: You can enable/disable the volume and RSI panels to simplify the chart.
How to Use the UDX-5UP
Identify the Trend:
Use the Pivot Supertrend and SMAs to determine the market direction. Uptrend: look for buys. Downtrend: look for sells.
Confirm with Volume and RSI:
For buys: Volume above the MA 20 with green bars, RSI rising and below 70.
For sells: Volume above the MA 20 with red bars, RSI falling and above 70.
Enter the Trade:
Enter a buy when the UDX-5UP plots a "Buy" and all conditions are aligned.
Enter a sell when the UDX-5UP plots a "Sell" and all conditions are aligned.
Plan the Exit:
Use Fibonacci levels or support/resistance on the price chart to set targets.
Exit the trade when the UDX-5UP plots an opposite signal ("Sell" after a buy, "Buy" after a sell).
Tips for Beginners
Start with Larger Timeframes: Use the 4H or 1D chart for more reliable signals and less noise.
Combine with Other Indicators: Use the UDX-5UP with tools like Fibonacci or the Candles RSI (another powerful indicator) to confirm signals.
Practice in Demo Mode: Test the indicator in a demo account before using real money.
Manage Risk: Always use a stop-loss and don’t risk more than 1-2% of your capital per trade.
Why Use the UDX-5UP?
Simplicity: Clear "Buy" and "Sell" signals make trading accessible even for beginners.
Versatility: Works on any asset (crypto, forex, stocks) and timeframe.
Multiple Confirmations: Combines price, volume, and momentum to reduce false signals.
Customizable: Adjust the settings to match your trading style.
Author’s Notes
The UDX-5UP was developed based on years of trading and technical analysis experience. It is an evolution of tested strategies, designed to help traders navigate volatile markets with confidence. However, no indicator is infallible. Always combine the UDX-5UP with proper risk management and fundamental analysis, especially in unpredictable markets. Feedback is welcome – leave a comment or reach out with suggestions for improvements!

Fuzzy SMA with DCTI Confirmation[FibonacciFlux]FibonacciFlux: Advanced Fuzzy Logic System with Donchian Trend Confirmation
Institutional-grade trend analysis combining adaptive Fuzzy Logic with Donchian Channel Trend Intensity for superior signal quality
Conceptual Framework & Research Foundation
FibonacciFlux represents a significant advancement in quantitative technical analysis, merging two powerful analytical methodologies: normalized fuzzy logic systems and Donchian Channel Trend Intensity (DCTI). This sophisticated indicator addresses a fundamental challenge in market analysis – the inherent imprecision of trend identification in dynamic, multi-dimensional market environments.
While traditional indicators often produce simplistic binary signals, markets exist in states of continuous, graduated transition. FibonacciFlux embraces this complexity through its implementation of fuzzy set theory, enhanced by DCTI's structural trend confirmation capabilities. The result is an indicator that provides nuanced, probabilistic trend assessment with institutional-grade signal quality.
Core Technological Components
1. Advanced Fuzzy Logic System with Percentile Normalization
At the foundation of FibonacciFlux lies a comprehensive fuzzy logic system that transforms conventional technical metrics into degrees of membership in linguistic variables:
// Fuzzy triangular membership function with robust error handling
fuzzy_triangle(val, left, center, right) =>
if na(val)
0.0
float denominator1 = math.max(1e-10, center - left)
float denominator2 = math.max(1e-10, right - center)
math.max(0.0, math.min(left == center ? val <= center ? 1.0 : 0.0 : (val - left) / denominator1,
center == right ? val >= center ? 1.0 : 0.0 : (right - val) / denominator2))
The system employs percentile-based normalization for SMA deviation – a critical innovation that enables self-calibration across different assets and market regimes:
// Percentile-based normalization for adaptive calibration
raw_diff = price_src - sma_val
diff_abs_percentile = ta.percentile_linear_interpolation(math.abs(raw_diff), normLookback, percRank) + 1e-10
normalized_diff_raw = raw_diff / diff_abs_percentile
normalized_diff = useClamping ? math.max(-clampValue, math.min(clampValue, normalized_diff_raw)) : normalized_diff_raw
This normalization approach represents a significant advancement over fixed-threshold systems, allowing the indicator to automatically adapt to varying volatility environments and maintain consistent signal quality across diverse market conditions.
2. Donchian Channel Trend Intensity (DCTI) Integration
FibonacciFlux significantly enhances fuzzy logic analysis through the integration of Donchian Channel Trend Intensity (DCTI) – a sophisticated measure of trend strength based on the relationship between short-term and long-term price extremes:
// DCTI calculation for structural trend confirmation
f_dcti(src, majorPer, minorPer, sigPer) =>
H = ta.highest(high, majorPer) // Major period high
L = ta.lowest(low, majorPer) // Major period low
h = ta.highest(high, minorPer) // Minor period high
l = ta.lowest(low, minorPer) // Minor period low
float pdiv = not na(L) ? l - L : 0 // Positive divergence (low vs major low)
float ndiv = not na(H) ? H - h : 0 // Negative divergence (major high vs high)
float divisor = pdiv + ndiv
dctiValue = divisor == 0 ? 0 : 100 * ((pdiv - ndiv) / divisor) // Normalized to -100 to +100 range
sigValue = ta.ema(dctiValue, sigPer)
DCTI provides a complementary structural perspective on market trends by quantifying the relationship between short-term and long-term price extremes. This creates a multi-dimensional analysis framework that combines adaptive deviation measurement (fuzzy SMA) with channel-based trend intensity confirmation (DCTI).
Multi-Dimensional Fuzzy Input Variables
FibonacciFlux processes four distinct technical dimensions through its fuzzy system:
Normalized SMA Deviation: Measures price displacement relative to historical volatility context
Rate of Change (ROC): Captures price momentum over configurable timeframes
Relative Strength Index (RSI): Evaluates cyclical overbought/oversold conditions
Donchian Channel Trend Intensity (DCTI): Provides structural trend confirmation through channel analysis
Each dimension is processed through comprehensive fuzzy sets that transform crisp numerical values into linguistic variables:
// Normalized SMA Deviation - Self-calibrating to volatility regimes
ndiff_LP := fuzzy_triangle(normalized_diff, norm_scale * 0.3, norm_scale * 0.7, norm_scale * 1.1)
ndiff_SP := fuzzy_triangle(normalized_diff, norm_scale * 0.05, norm_scale * 0.25, norm_scale * 0.5)
ndiff_NZ := fuzzy_triangle(normalized_diff, -norm_scale * 0.1, 0.0, norm_scale * 0.1)
ndiff_SN := fuzzy_triangle(normalized_diff, -norm_scale * 0.5, -norm_scale * 0.25, -norm_scale * 0.05)
ndiff_LN := fuzzy_triangle(normalized_diff, -norm_scale * 1.1, -norm_scale * 0.7, -norm_scale * 0.3)
// DCTI - Structural trend measurement
dcti_SP := fuzzy_triangle(dcti_val, 60.0, 85.0, 101.0) // Strong Positive Trend (> ~85)
dcti_WP := fuzzy_triangle(dcti_val, 20.0, 45.0, 70.0) // Weak Positive Trend (~30-60)
dcti_Z := fuzzy_triangle(dcti_val, -30.0, 0.0, 30.0) // Near Zero / Trendless (~+/- 20)
dcti_WN := fuzzy_triangle(dcti_val, -70.0, -45.0, -20.0) // Weak Negative Trend (~-30 - -60)
dcti_SN := fuzzy_triangle(dcti_val, -101.0, -85.0, -60.0) // Strong Negative Trend (< ~-85)
Advanced Fuzzy Rule System with DCTI Confirmation
The core intelligence of FibonacciFlux lies in its sophisticated fuzzy rule system – a structured knowledge representation that encodes expert understanding of market dynamics:
// Base Trend Rules with DCTI Confirmation
cond1 = math.min(ndiff_LP, roc_HP, rsi_M)
strength_SB := math.max(strength_SB, cond1 * (dcti_SP > 0.5 ? 1.2 : dcti_Z > 0.1 ? 0.5 : 1.0))
// DCTI Override Rules - Structural trend confirmation with momentum alignment
cond14 = math.min(ndiff_NZ, roc_HP, dcti_SP)
strength_SB := math.max(strength_SB, cond14 * 0.5)
The rule system implements 15 distinct fuzzy rules that evaluate various market conditions including:
Established Trends: Strong deviations with confirming momentum and DCTI alignment
Emerging Trends: Early deviation patterns with initial momentum and DCTI confirmation
Weakening Trends: Divergent signals between deviation, momentum, and DCTI
Reversal Conditions: Counter-trend signals with DCTI confirmation
Neutral Consolidations: Minimal deviation with low momentum and neutral DCTI
A key innovation is the weighted influence of DCTI on rule activation. When strong DCTI readings align with other indicators, rule strength is amplified (up to 1.2x). Conversely, when DCTI contradicts other indicators, rule impact is reduced (as low as 0.5x). This creates a dynamic, self-adjusting system that prioritizes high-conviction signals.
Defuzzification & Signal Generation
The final step transforms fuzzy outputs into a precise trend score through center-of-gravity defuzzification:
// Defuzzification with precise floating-point handling
denominator = strength_SB + strength_WB + strength_N + strength_WBe + strength_SBe
if denominator > 1e-10
fuzzyTrendScore := (strength_SB * STRONG_BULL + strength_WB * WEAK_BULL +
strength_N * NEUTRAL + strength_WBe * WEAK_BEAR +
strength_SBe * STRONG_BEAR) / denominator
The resulting FuzzyTrendScore ranges from -1.0 (Strong Bear) to +1.0 (Strong Bull), with critical threshold zones at ±0.3 (Weak trend) and ±0.7 (Strong trend). The histogram visualization employs intuitive color-coding for immediate trend assessment.
Strategic Applications for Institutional Trading
FibonacciFlux provides substantial advantages for sophisticated trading operations:
Multi-Timeframe Signal Confirmation: Institutional-grade signal validation across multiple technical dimensions
Trend Strength Quantification: Precise measurement of trend conviction with noise filtration
Early Trend Identification: Detection of emerging trends before traditional indicators through fuzzy pattern recognition
Adaptive Market Regime Analysis: Self-calibrating analysis across varying volatility environments
Algorithmic Strategy Integration: Well-defined numerical output suitable for systematic trading frameworks
Risk Management Enhancement: Superior signal fidelity for risk exposure optimization
Customization Parameters
FibonacciFlux offers extensive customization to align with specific trading mandates and market conditions:
Fuzzy SMA Settings: Configure baseline trend identification parameters including SMA, ROC, and RSI lengths
Normalization Settings: Fine-tune the self-calibration mechanism with adjustable lookback period, percentile rank, and optional clamping
DCTI Parameters: Optimize trend structure confirmation with adjustable major/minor periods and signal smoothing
Visualization Controls: Customize display transparency for optimal chart integration
These parameters enable precise calibration for different asset classes, timeframes, and market regimes while maintaining the core analytical framework.
Implementation Notes
For optimal implementation, consider the following guidance:
Higher timeframes (4H+) benefit from increased normalization lookback (800+) for stability
Volatile assets may require adjusted clamping values (2.5-4.0) for optimal signal sensitivity
DCTI parameters should be aligned with chart timeframe (higher timeframes require increased major/minor periods)
The indicator performs exceptionally well as a trend filter for systematic trading strategies
Acknowledgments
FibonacciFlux builds upon the pioneering work of Donovan Wall in Donchian Channel Trend Intensity analysis. The normalization approach draws inspiration from percentile-based statistical techniques in quantitative finance. This indicator is shared for educational and analytical purposes under Attribution-NonCommercial-ShareAlike 4.0 International (CC BY-NC-SA 4.0) license.
Past performance does not guarantee future results. All trading involves risk. This indicator should be used as one component of a comprehensive analysis framework.
Shout out @DonovanWall
