Moon Scalper v3 + VSAMoon Scalper v3 is a high-precision scalping indicator optimized for the 15-minute chart. It delivers clean buy/sell signals with TP1 (1:1 risk-reward) exits using layered confirmations:
• **Volatility Bands** — SMA + multiplier detect expansion zones
• **EMA Filter (200)** — ensures trades align with trend
• **RSI Range Filter** — avoids extreme overbought/oversold traps (buy: 52–62, sell: 38–48)
• **Volume Spike Filter** — filters for institutional activity (vol > 1.4×SMA)
• **VSA Confirmation** — requires wide-spread, high-volume bars with reclaim (volume × 1.4, spread × 1.5, reclaim 50%)
**Usage Notes:**
Best used on 15m timeframe for liquid pairs (e.g., BTCUSDT, ETHUSDT). Signals appear as “BUY” / “SELL” labels on chart. Defaults yield high TP1 hit rate; use only during active sessions (e.g., London/NY) for best accuracy.
**Disclaimer:**
This indicator is for educational purposes only. Past performance is not a guarantee of future results. Always backtest before live trading and manage risk responsibly.
Buysellsignal

Trendline + Bull/Bear Flag + EMA 9/21 Buy-Sell Signalseasy scalping and buy sell signals on 9-21 ema cross and trendline breakout

Balanced Big Wicks (50/50) HighlighterThis open-source indicator highlights candles with balanced long wicks (50/50 style)—that is, candles where both upper and lower shadows are each at least 30–60% of the full range and within ~8% of each other, while retaining a substantial body. This specific structure often reflects indecision or liquidity sweeps and can precede strong breakout moves.
How It Works (Inputs and Logic)
Min wick % (each side): 30–60% of candle range
Max body %: up to 60% of range (preserves strong body presence)
Equality tolerance: wicks within 8% of each other
ATR filter (multiples of ATR14): ensures only significant-range candles are flagged
When a “50/50” candle forms, it’s visually colored and labeled; audibly alertable.
How to Use It
Long setup: price closes above the wick-high → potential long entry (SL below wick-low, TP = 1:1).
Short setup: price closes below wick-low → potential short entry (SL above wick-high, TP = 1:1).
Especially effective on 5–15 minute scalping charts when aligned with high-volume sessions or HTF trend context.
Why This Indicator Is Unique
Unlike standard wick or doji voters, this script specifically filters for candles with a strong body and symmetrical wicks, paired with a range filter, reducing noise significantly.
Important Notes
No unrealistic claims: backtested setups indicate high occurrence of clean breakouts, though performance depends on market structure.
Script built responsibly: uses real-time calculations only, no future-data lookahead.
Visuals on the published chart reflect default input values exactly.

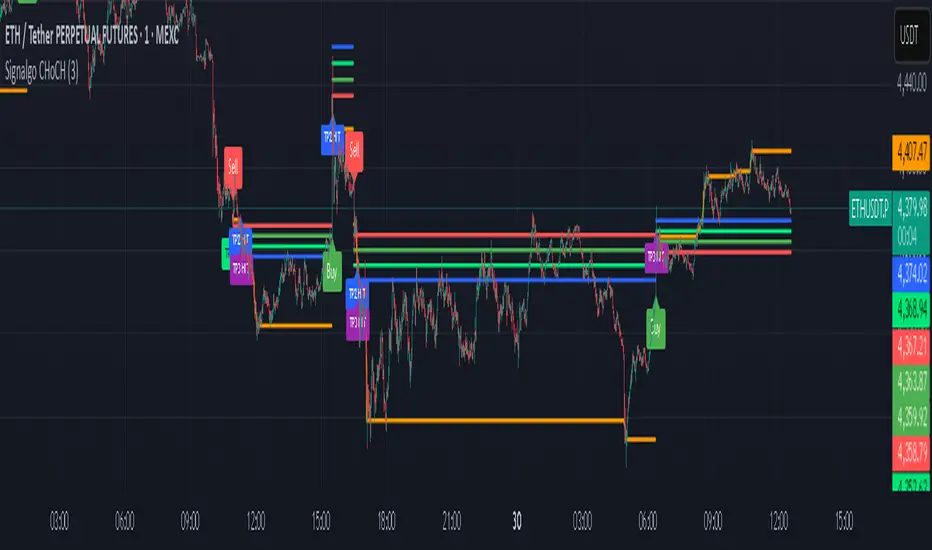
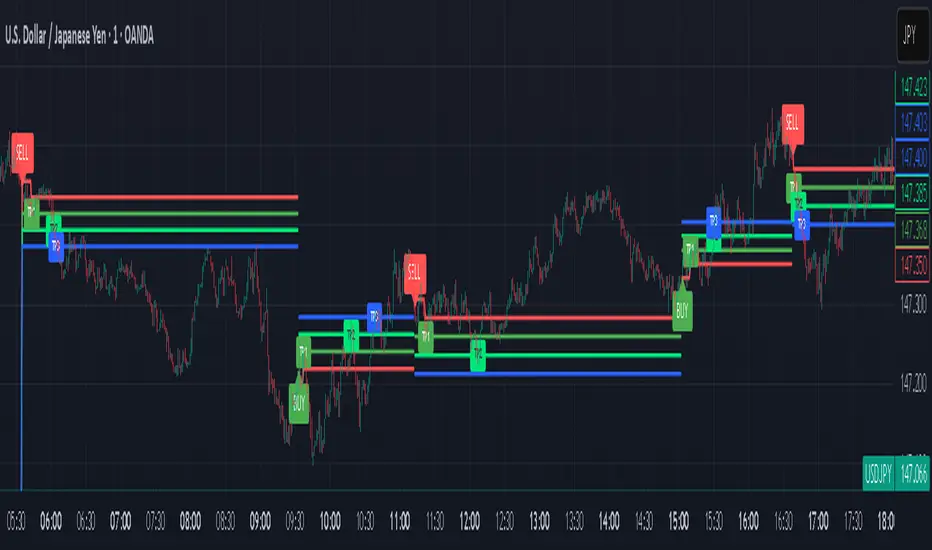
Signalgo CHoCHSignalgo CHoCH: Informative Technical Overview
Signalgo CHoCH is a multi-factor indicator designed for TradingView to detect “Change of Character” (CHoCH) shifts in market structure, signaling significant trend reversals and managing trades with risk control. This documentation details how it operates, its customizable parameters, signal methodology, what makes it different from traditional tools, and typical strategy applications.
How Signalgo CHoCH Works
1. Market Structure Detection
Swing High & Low Identification: The indicator uses an adaptive swing length to isolate important pivot highs and lows in price action. These pivots signal points where the market reversed direction or paused, forming the “swing structure” core to this strategy.
Body Strength Validation: Not every pivot break is meaningful. Signalgo CHoCH assesses price bar “body strength”—quantifying if the current candle’s body is disproportionately large compared to a recent average—to filter out weak or indecisive moves, retaining only those breaks likely to indicate genuine momentum.
2. Change of Character (CHoCH) Signal Logic
Bullish CHoCH: Triggered when price closes above the last significant swing low (the most recent support) with a strong candle body, indicating a transition from bearish to bullish market structure.
Bearish CHoCH: Triggered when price closes below the last significant swing high (key resistance) with a strong bearish candle, denoting a shift from bullish to bearish structure.
One-Time Event Recognition: Each break is tracked so that signals are issued only once per directional change, reducing repeated or redundant entries.
3. Higher Timeframe Confirmation
Multi-Timeframe Consistency: The indicator requires the CHoCH signal (on the current trading timeframe) to be confirmed by the market structure status of a selected higher timeframe. This adds an extra layer of validation, ensuring the signal aligns with broader trends.
Inputs
SwingLen: The number of bars used to define swing pivots.
bodyStrength & bodyLookback: Control sensitivity for body size validation, filtering which candle breaks are considered strong enough for signaling.
htfTf: Selects the higher timeframe for multi-timeframe checking.
show_tpsl: Toggle to show/hide automated Take Profit (TP) and Stop Loss (SL) levels on the chart.
ATR, TP/SL/RR/Trailing Settings: Determines how risk and reward are managed, using ATR for stop placement and multi-level profit targets with optional trailing stop activation after TP1.
Entry & Exit Strategy
Entry Logic
Long Entry: When a bullish CHoCH is detected, optionally confirmed by the higher timeframe, it marks a buy opportunity at the close of the breakout candle.
Short Entry: When a bearish CHoCH forms, also with optional higher timeframe confirmation, it identifies a sell entry at the close of the confirmation candle.
Exit & Trade Management
Stop Loss (SL): Automatically placed at a set ATR distance from entry, dynamically adapting to volatility.
Take Profits (TP1, TP2, TP3): Multiple reward targets are calculated and marked for systematic scaling out or profit-taking, based on a defined risk multiple.
Trailing Stop: Once the first profit target is hit, SL moves to breakeven, and a trailing stop engages, incrementally securing further gains if the trend continues.
State Tracking: All TP, SL, and trailing events are labeled on the chart for easy post-trade analysis.
Body Strength and Trend Filtering: Breakouts are only considered if the candle’s body confirms significant momentum, not just a fleeting spike, improving signal quality.
Event-Driven, Not Rolling: Each bullish or bearish “character change” is signaled only at the true point of structural shift, with strict per-event marking, not continuous signal generation as with typical MA cross strategies.
Integrated Multi-Timeframe Logic: higher timeframe validation minimizes false positives from short-term volatility noise, a capability not found in most indicator-based tools.
Automated, Dynamic Trade Management: This indicator overlays a complete trade management suite (TPs, SL, trailing) that moves with market conditions, allowing for risk handling directly from each signal.
Trading Strategy Application
Trend Reversal & Continuation: Suitable for identifying both sudden reversals and structural continuations, adaptable for intraday, swing, or positional trading styles.
Noise Filtering: Multiple checks (body strength, momentum, multi-timeframe) focus signals on genuine trend changes, filtering out most “whipsaws” seen in pure MA systems.
Visual Feedback: All transitions, TPs, SLs, and trailing events are visually annotated, enhancing the educational and review process.
Signalgo VSignalgo V: Technical Overview and Unique Aspects
Signalgo V is a technical indicator for TradingView that integrates multiple layers of analysis: moving averages, MACD, Bollinger Bands and RSI to deliver buy and sell signals. Below is an informational breakdown of how the indicator functions, its input parameters, signal logic, exit methodology, and how it stands apart from traditional moving average (MA) tools, without disclosing specifics that allow for code duplication.
How Signalgo V Works
1. Multi-Layered Technical Synthesis
Signalgo V processes several technical studies simultaneously:
Fast/Slow Moving Averages: Uses either EMA or SMA (user-selected) with adjustable periods. These are central to initial trend detection through crossovers.
MACD Filter: MACD line vs. signal line cross-check ensures trend direction is supported by both momentum and MA structure.
RSI Confirmation: The RSI is monitored to verify that signals are not excessively overbought or oversold, tuning the system to changing momentum regimes.
Bollinger Bands Context: Entry signals are only considered when price action is beyond the Bollinger Bands envelope, which further filters for unusually strong movements.
These strict, multi-indicator entry criteria are designed to ensure only the most robust signals are surfaced, each is contingent on the presence of aligned trend, momentum and volatility.
2. Exit Methodology
Take-Profit Levels: After entering a trade, the strategy automatically sets three predefined profit targets (TP1, TP2, TP3). If the price reaches any of these targets, the system marks it, helping you lock in profits at different stages.
Stop-Loss System: Simultaneously, a stop-loss (SL) value is set, protecting you from significant losses if the market moves against your position.
Dynamic Adjustment: When the first profit target (TP1) is hit, the system can automatically move the stop-loss to your entry price. This means your worst-case outcome is break-even from that point, reducing downside risk.
Trailing Stop-Loss: After TP1 is reached, a dynamic trailing stop can activate. This allows the stop-loss to follow the price as it moves in your favor, aiming to capture more profit if the trend continues, while still protecting your gains if the price reverses.
Visual Markers: The system plots all important exit levels (profit targets, stop-loss, trailing stop) directly on the chart. Optional labels also appear whenever a target or stop-loss is hit, making it easy to see progress.
Visual cues (labels) are plotted directly on the bar where a buy or sell signal triggers, clarifying entry points and aiding manual exit/risk management decisions.
Input Parameters
rsiLen: Lookback period for RSI calculation.
rsiOB and rsiOS: Overbought/oversold thresholds, adaptive to the indicator’s multi-layered logic.
maFastLen and maSlowLen: Periods for fast and slow MAs.
maType: EMA or SMA selectable for both MAs.
bbLen: Length for Bollinger Bands mean calculation.
bbMult: Standard deviation multiplier for BB width.
macdFast, macdSlow, macdSig: Standard MACD parameterization for nuanced momentum oversight.
What Separates Signalgo V from Traditional Moving Average Indicators
Composite Signal Architecture: Where traditional MA systems generate signals solely on MA crossovers, Signalgo V requires layered, cross-confirmational logic across trend (MAs), momentum (MACD), volatility (Bollinger Bands), and market strength (RSI).
Adaptive Volatility Context: MA signals only “count” when price is meaningfully breaking out of its volatility envelope, filtering out most unremarkable crosses that plague basic MA strategies.
Integrated Multi-Factor Filters: Strict compliance with all layers of signal logic is enforced. A marked improvement over MA strategies that lack secondary or tertiary confirmation.
Non-Redundant Event Limiting: Each entry is labeled as a unique event. The indicator does not repeat signals on subsequent bars unless all entry conditions are freshly met.
Trading Strategy Application
Trend Identification: By requiring concurrence among MA, MACD, RSI, and BB, this tool identifies only those trends with robust, multifactor support.
Breakout and Momentum Entry: Signals are bias-toward trades that initiate at likely breakout points (outside BB range), combined with fresh momentum and trend alignment.
Manual Discretion for Exits: The design is to empower traders with high-confidence entries and leave risk management or partial profit-taking adaptive to trader style, using visual cues from all component indicators.
Alert Generation: Each buy/sell event optionally triggers an alert, supporting systematic monitoring without constant chart watching.
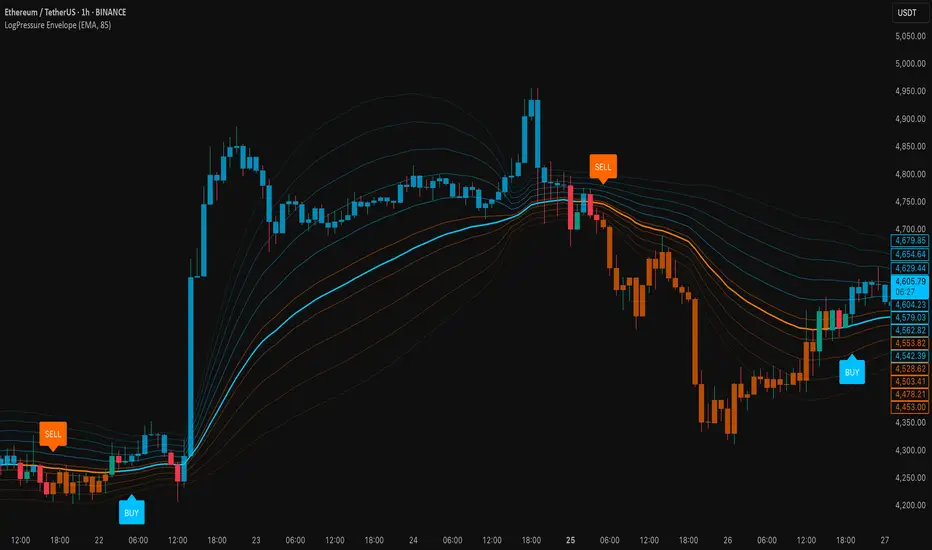
LogPressure Envelope [BOSWaves]LogPressure Envelope – Adaptive Volatility & Trend Visualizer
Overview
LogPressure Envelope is a specialized trading tool designed to normalize market behavior using logarithmic price scaling while providing an adaptive framework for volatility and trend detection. The indicator calculates a log-based moving average midline, surrounds it with asymmetric volatility envelopes, and replaces the conventional cloud with progressive fan lines to present price action in a more interpretable form.
By integrating rate-of-change midline coloring, fading trend strength, and structured buy/sell markers, LogPressure Envelope simplifies the reading of complex market dynamics. Its design makes it suitable for multiple trading approaches, including scalping, intraday, and swing trading, where volatility behavior and trend shifts must be understood quickly and objectively.
Unlike static envelope indicators, LogPressure Envelope adapts continuously to price scale and volatility conditions. It evaluates log-transformed prices, applies configurable moving average methods (EMA, SMA, WMA), and derives asymmetric standard-deviation bands for both upside and downside moves. These envelopes are projected as fan lines with adjustable opacity, producing a layered volatility map that evolves with the market.
This system ensures each visual element—midline shading, candle coloring, fan structure, and signal markers—reflects real-time market conditions, allowing traders to interpret volatility expansion, contraction, and directional bias with clarity.
How It Works
The foundation of LogPressure Envelope is the logarithmic transformation of price. By operating in log space, the indicator removes distortions caused by large nominal price differences across assets, enabling consistent analysis of both low-priced and high-priced instruments.
A moving average of log prices is calculated (EMA, SMA, or WMA depending on user input) and then re-converted to normal price scale, forming the log midline. Standard deviation of log prices is then measured over a separate period, with independent multipliers for upside and downside deviations. This asymmetry captures the fact that markets often expand differently in bullish versus bearish phases.
Instead of plotting a filled cloud, the envelope is expressed as ten equidistant fan lines stretching from the lower to upper boundary. Each line is shaded progressively to visualize volatility clustering and directional strength without overloading the chart.
Trend determination is smoothed using a fade mechanism: shifts in bias do not flip instantly but gradually move toward the new state, producing fewer false transitions. Buy and sell markers are generated when trend strength crosses confirmation thresholds, ensuring signals are event-driven and contextually meaningful.
Signals and Visuals
LogPressure Envelope provides multiple layers of structured signals:
Midline Bias – Central moving average colored by rate-of-change, reflecting directional acceleration or deceleration.
Volatility Fan – Ten progressive lines forming a gradient between lower and upper bands, visually encoding volatility spread.
Buy Signals – Labels below bars when upward trend strength is confirmed.
Sell Signals – Labels above bars when downward trend strength is confirmed.
Candle Coloring – Optional shading of candles based on trend alignment with the log midline, highlighting bullish, bearish, or neutral conditions.
These signals remain clear even during high-volatility phases, with visual hierarchy maintained through progressive opacity control.
Interpretation
Trend Analysis : Midline direction and candle coloring provide continuous feedback on prevailing bias. Upward-sloping midlines with blue shading indicate bullish phases, while downward slopes with orange shading confirm bearish conditions.
Volatility and Risk Assessment : Expansion of fan lines indicates rising volatility and potential breakout conditions; contraction indicates consolidation and possible mean reversion.
Signal Confirmation : Buy and sell markers validate transitions when trend strength thresholds are crossed, aligning with volatility envelope dynamics.
Market Context : Asymmetric envelopes allow traders to see where bearish acceleration differs from bullish expansion, improving interpretation of liquidity conditions and institutional pressure.
Strategy Integration
LogPressure Envelope can be applied across trading styles:
Trend Following : Enter trades in the direction of midline bias, confirmed by buy or sell markers.
Pullback Entries : Use midline retests during trending conditions as lower-risk continuation points.
Volatility Breakouts : Identify sharp expansions in fan line spacing as early signals of directional moves.
Reversal Strategies : Fade extreme envelope touches when momentum shows exhaustion and fan contraction begins.
Multi-Timeframe Confirmation : Align signals from higher and lower timeframes to reduce noise and validate trade setups.
Stop-loss levels can be set near the opposite envelope boundary, while targets may be managed through progressive volatility zones or midline convergence.
Advanced Techniques
For greater precision, LogPressure Envelope can be combined with other analytical tools:
Pair with volume or liquidity measures to validate breakout or reversal conditions.
Use momentum indicators to confirm ROC-based midline bias.
Track sequences of fan line expansions and contractions to anticipate regime shifts in volatility.
Apply across multiple timeframes to monitor how volatility clusters align at different market scales.
Adjusting parameters such as envelope multipliers, moving average type, and fade bars allows the indicator to adapt to diverse asset classes and volatility environments.
Inputs and Customization
Midline Type : Select EMA, SMA, or WMA.
Line Opacity : Control visibility of fan lines.
Enable Candle Coloring : Toggle trend-based bar shading.
MA Length / StdDev Length : Define periods for midline and volatility calculation.
Multipliers : Set asymmetric scaling for upside and downside envelopes.
Fade Bars : Control smoothness of trend strength transitions.
Fan Lines : Adjust number of envelope subdivisions for visualization granularity.
Why Use LogPressure Envelope
LogPressure Envelope translates complex volatility and trend interactions into a structured and adaptive framework. By combining logarithmic normalization, asymmetric standard deviation envelopes, and smoothed trend confirmation, it allows traders to:
Normalize price analysis across assets of different scales.
Visualize volatility expansion and contraction in real time.
Identify and confirm directional shifts with objective signal markers.
Apply a disciplined system for trend, breakout, and reversal strategies.
This indicator is designed for traders who want a systematic, visually clear approach to volatility-based market analysis without relying on static bands or arbitrary scaling.
Adaptive Rolling Quantile Bands [CHE] Adaptive Rolling Quantile Bands
Part 1 — Mathematics and Algorithmic Design
Purpose. The indicator estimates distribution‐aware price levels from a rolling window and turns them into dynamic “buy” and “sell” bands. It can work on raw price or on *residuals* around a baseline to better isolate deviations from trend. Optionally, the percentile parameter $q$ adapts to volatility via ATR so the bands widen in turbulent regimes and tighten in calm ones. A compact, latched state machine converts these statistical levels into high-quality discretionary signals.
Data pipeline.
1. Choose a source (default `close`; MTF optional via `request.security`).
2. Optionally compute a baseline (`SMA` or `EMA`) of length $L$.
3. Build the *working series*: raw price if residual mode is off; otherwise price minus baseline (if a baseline exists).
4. Maintain a FIFO buffer of the last $N$ values (window length). All quantiles are computed on this buffer.
5. Map the resulting levels back to price space if residual mode is on (i.e., add back the baseline).
6. Smooth levels with a short EMA for readability.
Rolling quantiles.
Given the buffer $X_{t-N+1..t}$ and a percentile $q\in $, the indicator sorts a copy of the buffer ascending and linearly interpolates between adjacent ranks to estimate:
* Buy band $\approx Q(q)$
* Sell band $\approx Q(1-q)$
* Median $Q(0.5)$, plus optional deciles $Q(0.10)$ and $Q(0.90)$
Quantiles are robust to outliers relative to means. The estimator uses only data up to the current bar’s value in the buffer; there is no look-ahead.
Residual transform (optional).
In residual mode, quantiles are computed on $X^{res}_t = \text{price}_t - \text{baseline}_t$. This centers the distribution and often yields more stationary tails. After computing $Q(\cdot)$ on residuals, levels are transformed back to price space by adding the baseline. If `Baseline = None`, residual mode simply falls back to raw price.
Volatility-adaptive percentile.
Let $\text{ATR}_{14}(t)$ be current ATR and $\overline{\text{ATR}}_{100}(t)$ its long SMA. Define a volatility ratio $r = \text{ATR}_{14}/\overline{\text{ATR}}_{100}$. The effective quantile is:
Smoothing.
Each level is optionally smoothed by an EMA of length $k$ for cleaner visuals. This smoothing does not change the underlying quantile logic; it only stabilizes plots and signals.
Latched state machines.
Two three-step processes convert levels into “latched” signals that only fire after confirmation and then reset:
* BUY latch:
(1) HLC3 crosses above the median →
(2) the median is rising →
(3) HLC3 prints above the upper (orange) band → BUY latched.
* SELL latch:
(1) HLC3 crosses below the median →
(2) the median is falling →
(3) HLC3 prints below the lower (teal) band → SELL latched.
Labels are drawn on the latch bar, with a FIFO cap to limit clutter. Alerts are available for both the simple band interactions and the latched events. Use “Once per bar close” to avoid intrabar churn.
MTF behavior and repainting.
MTF sourcing uses `lookahead_off`. Quantiles and baselines are computed from completed data only; however, any *intrabar* cross conditions naturally stabilize at close. As with all real-time indicators, values can update during a live bar; prefer bar-close alerts for reliability.
Complexity and parameters.
Each bar sorts a copy of the $N$-length window (practical $N$ values keep this inexpensive). Typical choices: $N=50$–$100$, $q_0=0.15$–$0.25$, $k=2$–$5$, baseline length $L=20$ (if used), adaptation strength $s=0.2$–$0.7$.
Part 2 — Practical Use for Discretionary/Active Traders
What the bands mean in practice.
The teal “buy” band marks the lower tail of the recent distribution; the orange “sell” band marks the upper tail. The median is your dynamic equilibrium. In residual mode, these tails are deviations around trend; in raw mode they are absolute price percentiles. When ATR adaptation is on, tails breathe with regime shifts.
Two core playbooks.
1. Mean-reversion around a stable median.
* Context: The median is flat or gently sloped; band width is relatively tight; instrument is ranging.
* Entry (long): Look for price to probe or close below the buy band and then reclaim it, especially after HLC3 recrosses the median and the median turns up.
* Stops: Place beyond the most recent swing low or $1.0–1.5\times$ ATR(14) below entry.
* Targets: First scale at the median; optional second scale near the opposite band. Trail with the median or an ATR stop.
* Symmetry: Mirror the rules for shorts near the sell band when the median is flat to down.
2. Continuation with latched confirmations.
* Context: A developing trend where you want fewer but cleaner signals.
* Entry (long): Take the latched BUY (3-step confirmation) on close, or on the next bar if you require bar-close validation.
* Invalidation: A close back below the median (or below the lower band in strong trends) negates momentum.
* Exits: Trail under the median for conservative exits or under the teal band for trend-following exits. Consider scaling at structure (prior swing highs) or at a fixed $R$ multiple.
Parameter guidance by timeframe.
* Scalping / LTF (1–5m): $N=30$–$60$, $q_0=0.20$, $k=2$–3, residual mode on, baseline EMA $L=20$, adaptation $s=0.5$–0.7 to handle micro-vol spikes. Expect more signals; rely on latched logic to filter noise.
* Intraday swing (15–60m): $N=60$–$100$, $q_0=0.15$–0.20, $k=3$–4. Residual mode helps but is optional if the instrument trends cleanly. $s=0.3$–0.6.
* Swing / HTF (4H–D): $N=80$–$150$, $q_0=0.10$–0.18, $k=3$–5. Consider `SMA` baseline for smoother residuals and moderate adaptation $s=0.2$–0.4.
Baseline choice.
Use EMA for responsiveness (fast trend shifts) and SMA for stability (smoother residuals). Turning residual mode on is advantageous when price exhibits persistent drift; turning it off is useful when you explicitly want absolute bands.
How to time entries.
Prefer bar-close validation for both band recaptures and latched signals. If you must act intrabar, accept that crosses can “un-cross” before close; compensate with tighter stops or reduced size.
Risk management.
Position size to a fixed fractional risk per trade (e.g., 0.5–1.0% of equity). Define invalidation using structure (swing points) plus ATR. Avoid chasing when distance to the opposite band is small; reward-to-risk degrades rapidly once you are deep inside the distribution.
Combos and filters.
* Pair with a higher-timeframe median slope as a regime filter (trade only in the direction of the HTF median).
* Use band width relative to ATR as a range/trend gauge: unusually narrow bands suggest compression (mean-reversion bias); expanding bands suggest breakout potential (favor latched continuation).
* Volume or session filters (e.g., avoid illiquid hours) can materially improve execution.
Alerts for discretion.
Enable “Cross above Buy Level” / “Cross below Sell Level” for early notices and “Latched BUY/SELL” for conviction entries. Set alerts to “Once per bar close” to avoid noise.
Common pitfalls.
Do not interpret band touches as automatic signals; context matters. A strong trend will often ride the far band (“band walking”) and punish counter-trend fades—use the median slope and latched logic to separate trend from range. Do not oversmooth levels; you will lag breaks. Do not set $q$ too small or too large; extremes reduce statistical meaning and practical distance for stops.
A concise checklist.
1. Is the median flat (range) or sloped (trend)?
2. Is band width expanding or contracting vs ATR?
3. Are we near the tail level aligned with the intended trade?
4. For continuation: did the 3 steps for a latched signal complete?
5. Do stops and targets produce acceptable $R$ (≥1.5–2.0)?
6. Are you trading during liquid hours for the instrument?
Summary. ARQB provides statistically grounded, regime-aware bands and a disciplined, latched confirmation engine. Use the bands as objective context, the median as your equilibrium line, ATR adaptation to stay calibrated across regimes, and the latched logic to time higher-quality discretionary entries.
Disclaimer
No indicator guarantees profits. Adaptive Rolling Quantile Bands is a decision aid; always combine with solid risk management and your own judgment. Backtest, forward test, and size responsibly.
The content provided, including all code and materials, is strictly for educational and informational purposes only. It is not intended as, and should not be interpreted as, financial advice, a recommendation to buy or sell any financial instrument, or an offer of any financial product or service. All strategies, tools, and examples discussed are provided for illustrative purposes to demonstrate coding techniques and the functionality of Pine Script within a trading context.
Any results from strategies or tools provided are hypothetical, and past performance is not indicative of future results. Trading and investing involve high risk, including the potential loss of principal, and may not be suitable for all individuals. Before making any trading decisions, please consult with a qualified financial professional to understand the risks involved.
By using this script, you acknowledge and agree that any trading decisions are made solely at your discretion and risk.
Enhance your trading precision and confidence 🚀
Best regards
Chervolino

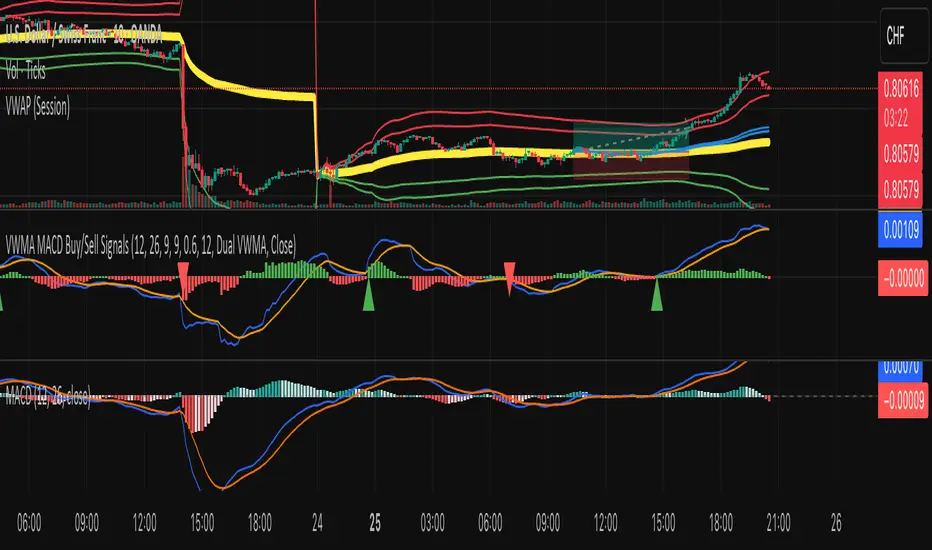
VWMA MACD Amanita Buy/Sell Signals VWMA MACD Amanita Buy/Sell Signals – Volume-Weighted Momentum Indicator
A twist on the classic MACD: this indicator uses Volume Weighted Moving Averages (VWMA) instead of EMAs, giving more weight to price moves backed by higher volume.
Features:
VWMA-based MACD line & signal line
Histogram highlights bullish/bearish momentum
Color-coded for easy visualization
Quick Guide:
MACD above Signal → bullish
MACD below Signal → bearish
Rising histogram → strengthening trend
Falling histogram → weakening trend
Perfect for traders who want momentum confirmed by volume.
Buy/Sell Indicator with Resistance/Support LevelsThis is a simple Multi-Indicator Analysis
Customizable moving averages (SMA, EMA, WMA)
RSI with overbought/oversold levels
MACD with signal line crossovers
Automatic support and resistance level detection
Smart Signal Generation
Strong signals: Require multiple indicators to align
Weak signals: Single indicator confirmations
Visual markers for different signal strengths
Advanced Features
Real-time info table showing current values
Automatic support/resistance line drawing
Multiple alert conditions
Clean, customizable display options

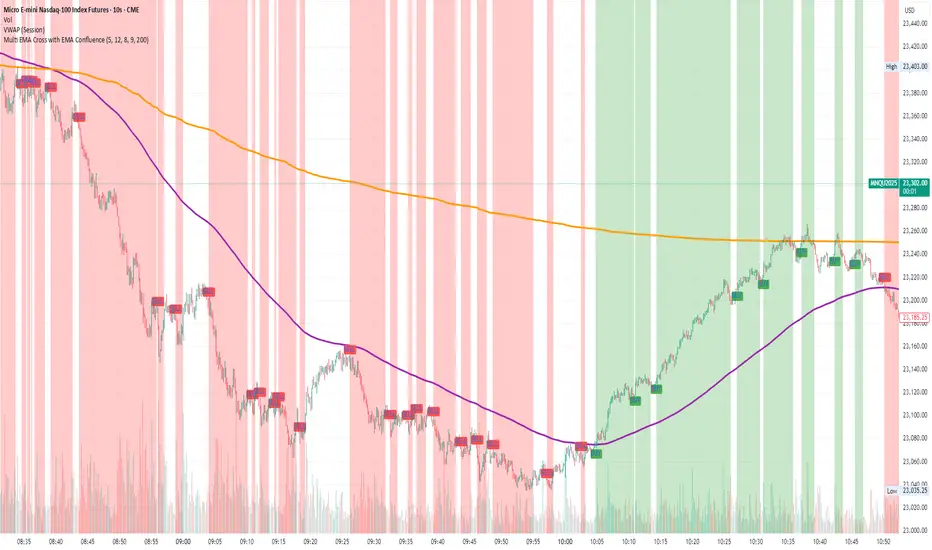
Multi EMA Cross with EMA ConfluenceMulti EMA Cross with EMA Confluence
This indicator combines the power of multiple EMA crossovers with a higher-timeframe confluence filter to help traders visualize potential bullish and bearish conditions on their charts.
Two groups of EMAs work together to establish alignment:
Group 1 (Fast / Slow Pair) – Shorter-term momentum shifts
Group 2 (Fast / Slow Pair) – Broader trend confirmation
On top of that, an optional Confluence EMA (default 200 EMA) acts as an additional filter, ensuring that signals align with the larger market trend.
Key features:
Customizable EMA lengths, colors, and confluence settings
Background highlighting when conditions align bullish or bearish
Clear buy/sell labels when new conditions trigger
Flexible enough to adapt across timeframes and trading styles
This tool is designed to enhance chart clarity and help you stay aligned with momentum and trend. It is not meant to replace your own analysis but rather to complement it.
Disclaimer: This script is for educational and informational purposes only. It is not financial advice. Trading involves risk, and you should always do your own research or consult with a licensed financial professional before making investment decisions.
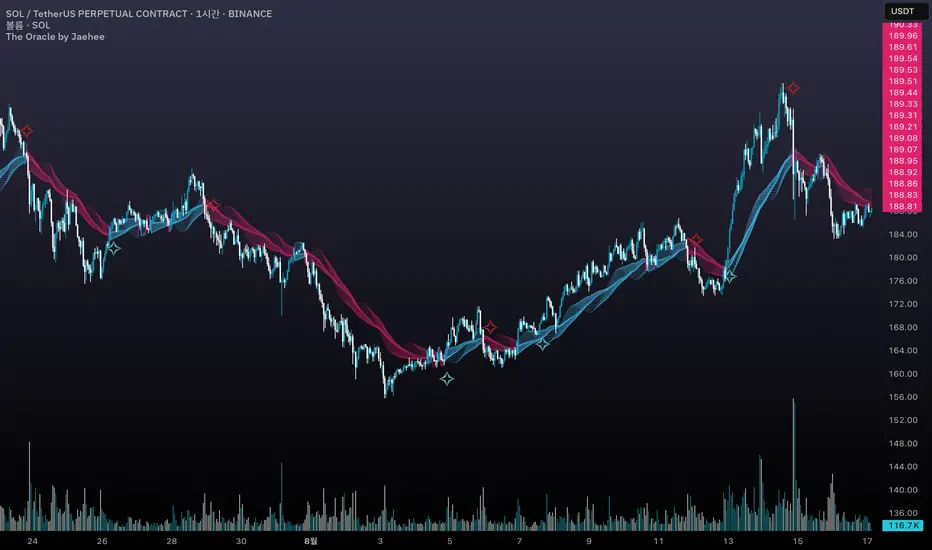
The Oracle by JaeheeThe Oracle
Summary
The Oracle is a volatility-adaptive trend indicator built on a smoothed range filter, persistence counters, and regime-flip logic. Signals appear only when price establishes a sustained move and flips from one regime to the other. An EMA(50)-anchored ribbon provides a flowing visual context but does not drive signals.
What it does
① Calculates a smoothed volatility-based range to adapt to market conditions
② Builds a filtered price path that reduces single-bar noise
③ Tracks persistence of upward or downward filter movement with counters
④ Confirms Buy/Sell signals only on regime flips, not on single ticks
⑤ Draws a multi-phase ribbon around EMA(50) to visualize slope and bias
How it works (concept level)
① Smoothed Range: Double EMA of absolute price change, scaled by multiplier
② Filtered Price: Range filter constrains price movement to reduce noise
③ Persistence Counters: Upward/Downward counters accumulate only if the filter continues in one direction
④ Signal Logic:
• Buy = price above filter AND prior regime was short
• Sell = price below filter AND prior regime was long
• Requires a full flip of state to confirm new signals
⑤ Ribbon: EMA(50) baseline with sinusoidal offsets creates a flowing ribbon, colored by EMA slope (visual only)
Why it is useful
① Noise resistance: Avoids whipsaws by requiring persistence + state flips
② Clarity: Ribbon visually encodes background trend for quick recognition
③ Balanced design: Combines volatility adaptation, persistence, and confirmation in one framework
④ Adaptable: Works across assets and timeframes without heavy parameter tuning
How to use it
① Signal reading:
• ✧ Buy marker = confirmed transition into an upward regime
• ✧ Sell marker = confirmed transition into a downward regime
• Use bar close confirmation
② Ribbon context: Align trades with ribbon slope/color to stay with the dominant trend
③ Timeframes:
• Higher (4H, Daily) = better swing bias
• Lower (5m, 15m) = faster signals but noisier
④ Combination: Pair with ATR stops, position sizing, or volume/momentum studies for added confirmation
Limitations
① Still possible to see false flips in choppy consolidations
② Smoothing introduces slight delay in regime confirmation
③ Signals can repaint intrabar — confirm on bar close
④ Indicator only — no built-in money management or strategy logic
Best Practices (Recommended Use)
① Confirm on bar close
• Signals can change intrabar; always make decisions after the bar has closed.
② Validate across multiple timeframes
• Although the tool adapts to volatility, reliability improves on higher timeframes.
• In practice, the 1-hour chart has shown the most stable balance between reactivity and noise.
③ Align with ribbon bias
• Trade in the same direction as the ribbon slope/color to reduce countertrend exposure.
④ Combine with independent risk management
• Use stop-losses, position sizing, or ATR-based targets outside the script.
• The indicator highlights transitions, but risk control must be user-defined.
⑤ Use as confirmation, not prediction
• Treat signals as confirmation of regime change, not as a forecast of future price.
Trader's Club IndicatorTrader’s Club Indicator
The Trader’s Club Indicator is an advanced confluence-based tool combining Bollinger Bands , Relative Strength Index (RSI) , VWAP with multi-band overlays , and an intelligent chained divergence detection engine. It identifies potential buy/sell setups by aligning price extremes with momentum shifts and volume-weighted trends. The “E” signal highlights enhanced entry opportunities based on RSI divergence and price candle behaviour — offering a timing edge for informed traders.
TRADING METHOD
This indicator works best on 1-Minute candles. Tested it successfully on XAUUSD.
Buy signal: 'E' in a Blue box.
Sell signal: 'E' in a Red box.
Chained Divergence: White dot on the top or bottom of a candle. This shows possibility of a reversal from that zone.
Use the Buy/Sell signals in conjunction with the VWAP levels. If the Buy/Sell Signals form at VWAP and a key support/resistance level, that is an additional confluence.
Disclaimer
This indicator is for informational and educational purposes only. Trading involves risk, and you are solely responsible for your decisions. Do not rely solely on the buy/sell ‘E’ signals — it’s crucial to use additional confirmation, context, and personal judgment before placing trades. Always practice proper risk management and consider combining this indicator with broader technical or fundamental confluences.

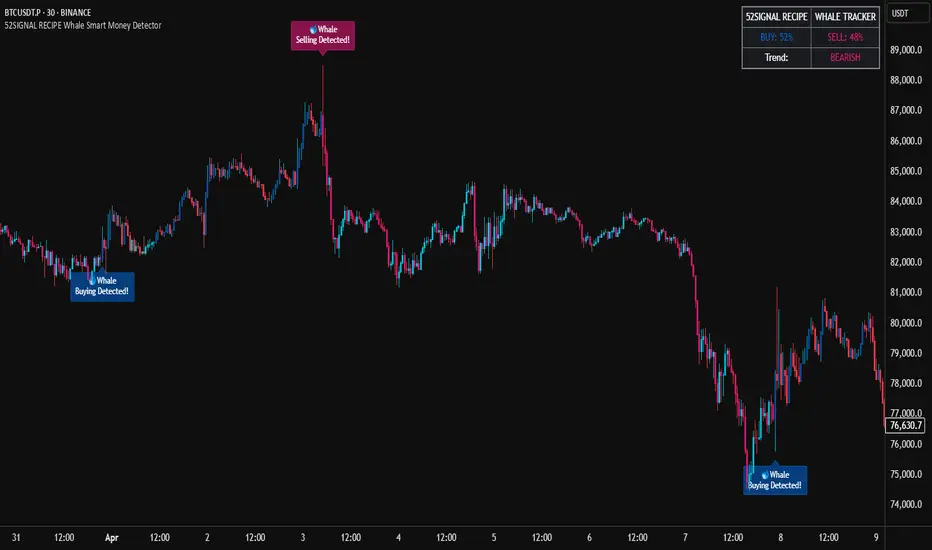
52SIGNAL RECIPE Whale Smart Money Detector52SIGNAL RECIPE Whale Smart Money Detector
◆ Overview
52SIGNAL RECIPE Whale Smart Money Detector is an innovative indicator that detects the movements of whales (large investors) in the cryptocurrency market in real-time. This powerful tool tracks large-scale trading activities that significantly impact the market, providing valuable signals before important market direction changes occur. It can be applied to any cryptocurrency chart, allowing traders to follow the movements of big money anytime, anywhere.
The unique strength of this indicator lies in its comprehensive analysis of volume surges, price volatility, and trend strength to accurately capture whale market entries and exits. By providing clear visual representation of large fund flow data that is difficult for ordinary traders to detect, you gain the opportunity to move alongside the big players in the market.
─────────────────────────────────────
◆ Key Features
• Whale Activity Detection System: Analyzes volume surges and price impacts to capture large investor movements in real-time
• Precise Volume Analysis: Distinguishes between regular volume and whale volume to track only meaningful market movements
• Market Impact Measurement: Quantifies and analyzes the real impact of whale buying/selling on the market
• Continuity Tracking: Follows market direction continuity after whale activity to confirm signal validity
• Intuitive Visualization: Easily identifies whale activity points through color bar charts and clear labels
• Trend Strength Display: Calculates and displays current market buy/sell strength in real-time in a table
• Whale Signal Filtering: Applies multiple filtering systems to detect only genuine whale activity
• Customizable Sensitivity Settings: Offers flexible parameters to adjust whale detection sensitivity according to market conditions
─────────────────────────────────────
◆ Understanding Signal Types
■ Whale Buy Signal
• Definition: Occurs when volume increases significantly above average, immediate volume impact is large, and price rises beyond normal volatility
• Visual Representation: Translucent blue bar coloring with "🐋Whale Buying Detected!" label on the candle where the buy signal occurs
• Market Interpretation: Indicates that large funds are actively buying the coin, which is likely to lead to price increases
■ Whale Sell Signal
• Definition: Occurs when volume increases significantly above average, immediate volume impact is large, and price falls beyond normal volatility
• Visual Representation: Translucent pink bar coloring with "🐋Whale Selling Detected!" label on the candle where the sell signal occurs
• Market Interpretation: Indicates that large funds are actively selling the coin, which is likely to lead to price decreases
─────────────────────────────────────
◆ Understanding Trend Analysis
■ Trend Analysis Method
• Definition: Measures current trend and strength by analyzing the ratio of up/down candles over a set period
• Visual Representation: Displayed in the table as "BUY" and "SELL" percentages, with the current trend clearly marked as "BULLISH", "BEARISH", or "NEUTRAL"
• Calculation Method:
▶ Buy ratio = (Number of up candles) / (Total analysis period)
▶ Sell ratio = (Number of down candles) / (Total analysis period)
▶ Current trend determined by the dominant ratio as "BULLISH" or "BEARISH"
■ Trend Utilization Methods
• Whale Signal Confirmation: Signal reliability increases when whale signals align with the current trend
• Reversal Point Identification: Opposing whale signals during strong trends may indicate important reversal points
• Market Strength Assessment: Understand the balance of power in the current market through buy/sell ratios
• Signal Context Understanding: Consider trend information alongside whale signals for interpretation in a broader market context
─────────────────────────────────────
◆ Indicator Settings Guide
■ Key Setting Parameters
• Volume Impact Factor:
▶ Purpose: Sets the minimum multiplier for immediate volume impact to be considered whale activity
▶ Lower values: Generate more signals, detect smaller whales
▶ Higher values: Fewer signals, detect only very large whales
▶ Recommended range: 2.0-4.0 (adjust according to market conditions)
• Sensitivity Factor:
▶ Purpose: Adjusts sensitivity of price movement relative to normal volatility
▶ Lower values: Increased sensitivity, more signals generated
▶ Higher values: Decreased sensitivity, only stronger price impacts detected
▶ Recommended range: 0.2-0.5 (set higher in highly volatile markets)
• Trend Analysis Period:
▶ Purpose: Sets the number of candles to calculate buy/sell ratios
▶ Lower values: More responsive to recent trends
▶ Higher values: More stable analysis considering longer-term trends
▶ Recommended range: 30-70 (adjust according to trading style)
─────────────────────────────────────
◆ Synergy with Other Indicators
• Key Support/Resistance Levels:
▶ Whale signals occurring near important technical levels have higher reliability
▶ Coincidence of weekly/monthly pivot points and whale signals confirms important price points
• Moving Averages:
▶ Pay attention to whale signals near key moving averages (50MA, 200MA)
▶ Simultaneous occurrence of moving average breakouts and whale signals indicates important technical events
• Volume Profile:
▶ Whale activity near high volume nodes confirms important price levels
▶ Whale signals at low volume nodes may indicate possibility of rapid price movements
• Volatility Indicators:
▶ Whale signals after periods of low volatility may mark the beginning of new market movements
▶ Whale signals after Bollinger Band contraction may be precursors to large movements
• Market Structure:
▶ Whale signals near key market structures (higher highs/lows, lower highs/lows) suggest structural changes
▶ Coincidence of market structure changes and whale activity may signal important trend changes
─────────────────────────────────────
◆ Conclusion
52SIGNAL RECIPE Whale Smart Money Detector tracks the trading activities of large investors in the cryptocurrency market in real-time, providing traders with valuable insights. Because it can be applied to any cryptocurrency chart, you can utilize it immediately on your preferred trading platform.
The core value of this indicator is providing intuitive visualization of large fund flows that are easily missed by ordinary traders. By comprehensively analyzing volume surges, immediate price impacts, and trend continuity to accurately capture whale activity, you gain the opportunity to move alongside the big players in the market.
Clear buy/sell signals and real-time trend strength measurements help traders quickly grasp market conditions and understand market direction. By integrating this powerful tool into your trading system, gain insights into where the market's smart money is flowing for better market understanding.
─────────────────────────────────────
※ Disclaimer: Like all trading tools, the 52SIGNAL RECIPE Whale Smart Money Detector should be used as a supplementary indicator and not relied upon exclusively for trading decisions. Past patterns of whale behavior may not guarantee future market movements. Always employ appropriate risk management strategies in your trading.
52SIGNAL RECIPE Whale Smart Money Detector
◆ 개요
52SIGNAL RECIPE Whale Smart Money Detector는 암호화폐 시장에서 고래(대형 투자자)의 움직임을 실시간으로 감지하는 혁신적인 지표입니다. 이 강력한 도구는 시장에 큰 영향을 미치는 대규모 트레이딩 활동을 추적하여 중요한 시장 방향 전환이 일어나기 전에 귀중한 신호를 제공합니다. 모든 암호화폐 차트에 적용 가능하여 트레이더들이 언제 어디서든 대형 자금의 움직임을 따라갈 수 있게 해줍니다.
이 지표의 독보적인 강점은 거래량 급증, 가격 변동성, 그리고 추세 강도를 종합적으로 분석하여 고래의 시장 진입과 퇴출을 정확히 포착한다는 점입니다. 일반 트레이더들이 놓치기 쉬운 대형 자금의 흐름 데이터를 시각적으로 명확하게 제공함으로써, 여러분은 시장의 큰 손들과 함께 움직일 수 있는 기회를 얻게 됩니다.
─────────────────────────────────────
◆ 주요 특징
• 고래 활동 감지 시스템: 거래량 급증과 가격 임팩트를 분석하여 대형 투자자의 움직임을 실시간으로 포착
• 정밀한 거래량 분석: 일반 거래량과 고래 거래량을 구분하여 의미 있는 시장 움직임만 추적
• 시장 영향력 측정: 고래의 매수/매도가 시장에 미치는 실질적 영향력을 수치화하여 분석
• 연속성 추적: 고래 활동 이후 시장 방향의 지속성을 추적하여 신호의 유효성 확인
• 직관적 시각화: 컬러 바 차트와 명확한 라벨을 통해 고래 활동 지점을 쉽게 식별
• 추세 강도 표시: 현재 시장의 매수/매도 강도를 실시간으로 계산하여 테이블에 표시
• 고래 신호 필터링: 진정한 고래 활동만 감지하도록 다중 필터링 시스템 적용
• 맞춤형 감도 설정: 시장 상황에 따라 고래 감지 감도를 조절할 수 있는 유연한 파라미터 제공
─────────────────────────────────────
◆ 신호 유형 이해하기
■ 고래 매수 신호
• 정의: 거래량이 평균보다 크게 증가하고, 즉각적인 거래량 충격이 크며, 가격이 정상 변동성을 초과하여 상승할 때 발생
• 시각적 표현: 매수 신호가 발생한 캔들에 반투명 파란색 바 컬러링과 함께 "🐋Whale Buying Detected!" 라벨 표시
• 시장 해석: 대형 자금이 적극적으로 코인을 매수하고 있으며, 이는 곧 가격 상승으로 이어질 가능성이 높음을 의미
■ 고래 매도 신호
• 정의: 거래량이 평균보다 크게 증가하고, 즉각적인 거래량 충격이 크며, 가격이 정상 변동성을 초과하여 하락할 때 발생
• 시각적 표현: 매도 신호가 발생한 캔들에 반투명 분홍색 바 컬러링과 함께 "🐋Whale Selling Detected!" 라벨 표시
• 시장 해석: 대형 자금이 적극적으로 코인을 매도하고 있으며, 이는 곧 가격 하락으로 이어질 가능성이 높음을 의미
─────────────────────────────────────
◆ 추세 분석 이해하기
■ 추세 분석 방식
• 정의: 설정된 기간 동안의 상승/하락 캔들 비율을 분석하여 시장의 현재 추세와 강도를 측정
• 시각적 표현: 테이블에 "BUY"와 "SELL" 비율이 백분율로 표시되며, 현재 추세가 "BULLISH", "BEARISH" 또는 "NEUTRAL"로 명확하게 표시됨
• 계산 방식:
▶ 매수 비율 = (상승 캔들 수) / (전체 분석 기간)
▶ 매도 비율 = (하락 캔들 수) / (전체 분석 기간)
▶ 우세한 비율에 따라 "BULLISH" 또는 "BEARISH" 추세 결정
■ 추세 활용 방법
• 고래 신호 확인: 고래 신호가 현재 추세와 일치할 때 신호의 신뢰도가 높아짐
• 반전 포인트 식별: 강한 추세 속에서 발생하는 반대 방향의 고래 신호는 중요한 반전 포인트일 수 있음
• 시장 강도 평가: 매수/매도 비율을 통해 현재 시장의 세력 균형 파악
• 신호 발생 맥락 이해: 추세 정보와 고래 신호를 함께 고려하여 더 넓은 시장 컨텍스트에서 해석
─────────────────────────────────────
◆ 지표 설정 가이드
■ 주요 설정 매개변수
• Volume Impact Factor (거래량 임팩트 요소):
▶ 목적: 고래 활동으로 간주할 즉각적인 거래량 충격의 최소 배수 설정
▶ 낮은 값: 더 많은 신호 생성, 작은 고래도 감지
▶ 높은 값: 더 적은 신호, 매우 큰 고래만 감지
▶ 권장 범위: 2.0-4.0 (시장 상황에 따라 조정)
• Sensitivity Factor (민감도 요소):
▶ 목적: 정상 변동성 대비 가격 변동의 민감도 조절
▶ 낮은 값: 민감도 증가, 더 많은 신호 생성
▶ 높은 값: 민감도 감소, 더 강한 가격 충격만 감지
▶ 권장 범위: 0.2-0.5 (변동성이 높은 시장에서는 높게 설정)
• Trend Analysis Period (추세 분석 기간):
▶ 목적: 매수/매도 비율을 계산할 캔들 수 설정
▶ 낮은 값: 최근 추세에 더 민감하게 반응
▶ 높은 값: 더 긴 기간의 추세를 고려하여 안정적인 분석
▶ 권장 범위: 30-70 (트레이딩 스타일에 따라 조정)
─────────────────────────────────────
◆ 다른 지표와의 시너지
• 주요 지지/저항 레벨:
▶ 중요한 기술적 레벨 근처에서 발생하는 고래 신호는 더 높은 신뢰도를 가짐
▶ 주간/월간 피봇 포인트와 고래 신호의 일치는 중요한 가격 지점을 확인해줌
• 이동평균선:
▶ 주요 이동평균선(50MA, 200MA) 근처에서 발생하는 고래 신호에 주목
▶ 이동평균선 돌파와 고래 신호가 동시 발생 시 중요한 기술적 이벤트 확인
• 볼륨 프로필:
▶ 높은 볼륨 노드 근처에서의 고래 활동은 중요한 가격 레벨 확인
▶ 낮은 볼륨 노드에서 발생하는 고래 신호는 급격한 가격 이동 가능성 암시
• 변동성 지표:
▶ 낮은 변동성 구간 이후 발생하는 고래 신호는 새로운 시장 움직임의 시작일 수 있음
▶ 볼린저 밴드 수축 후 발생하는 고래 신호는 큰 움직임의 전조일 수 있음
• 시장 구조:
▶ 주요 시장 구조(높은 고점/저점, 낮은 고점/저점) 근처에서 발생하는 고래 신호는 구조 변화 암시
▶ 시장 구조 변화와 고래 활동의 일치는 중요한 트렌드 변화 신호일 수 있음
─────────────────────────────────────
◆ 결론
52SIGNAL RECIPE Whale Smart Money Detector는 암호화폐 시장에서 대형 투자자들의 거래 활동을 실시간으로 추적하여 트레이더들에게 귀중한 통찰력을 제공합니다. 모든 암호화폐 차트에 적용 가능하기 때문에, 여러분이 선호하는 트레이딩 플랫폼에서 바로 활용할 수 있습니다.
이 지표의 핵심 가치는 일반 트레이더들이 놓치기 쉬운 대형 자금의 흐름을 직관적으로 시각화하여 제공한다는 점입니다. 거래량 급증, 즉각적인 가격 충격, 그리고 추세 지속성을 종합적으로 분석하여 고래의 활동을 정확히 포착함으로써, 여러분은 시장을 움직이는 큰 손들과 함께할 수 있는 기회를 얻게 됩니다.
명확한 매수/매도 신호와 실시간 추세 강도 측정은 트레이더들이 시장 상황을 한눈에 파악하고 시장의 방향성을 이해하는 데 도움을 줍니다. 이 강력한 도구를 여러분의 트레이딩 시스템에 통합함으로써, 시장의 스마트 머니가 어디로 흘러가는지 파악하고 더 나은 통찰력을 얻으세요.
─────────────────────────────────────
※ 면책 조항: 모든 트레이딩 도구와 마찬가지로, 52SIGNAL RECIPE Whale Smart Money Detector는 보조 지표로 사용해야 하며 트레이딩 결정을 전적으로 의존해서는 안 됩니다. 과거의 고래 행동 패턴이 미래 시장 움직임을 보장하지는 않습니다. 항상 적절한 리스크 관리 전략을 트레이딩에 활용하세요.
Ultimate Scalping Strategy v2Strategy Overview
This is a versatile scalping strategy designed primarily for low timeframes (like 1-min, 3-min, or 5-min charts). Its core logic is based on a classic EMA (Exponential Moving Average) crossover system, which is then filtered by the VWAP (Volume-Weighted Average Price) to confirm the trade's direction in alignment with the market's current intraday sentiment.
The strategy is highly customizable, allowing traders to add layers of confirmation, control trade direction, and manage exits with precision.
Core Strategy Logic
The strategy's entry signals are generated when two primary conditions are met simultaneously:
Momentum Shift (EMA Crossover): It looks for a crossover between a fast EMA (default length 9) and a slow EMA (default length 21).
Buy Signal: The fast EMA crosses above the slow EMA, indicating a potential shift to bullish momentum.
Sell Signal: The fast EMA crosses below the slow EMA, indicating a potential shift to bearish momentum.
Trend/Sentiment Filter (VWAP): The crossover signal is only considered valid if the price is on the "correct" side of the VWAP.
For a Buy Signal: The price must be trading above the VWAP. This confirms that, on average, buyers are in control for the day.
For a Sell Signal: The price must be trading below the VWAP. This confirms that sellers are generally in control.
Confirmation Filters (Optional)
To increase the reliability of the signals and reduce false entries, the strategy includes two optional confirmation filters:
Price Action Filter (Engulfing Candle): If enabled (Use Price Action), the entry signal is only valid if the crossover candle is also an "engulfing" candle.
A Bullish Engulfing candle is a large green candle that completely "engulfs" the body of the previous smaller red candle, signaling strong buying pressure.
A Bearish Engulfing candle is a large red candle that engulfs the previous smaller green candle, signaling strong selling pressure.
Volume Filter (Volume Spike): If enabled (Use Volume Confirmation), the entry signal must be accompanied by a surge in volume. This is confirmed if the volume of the entry candle is greater than its recent moving average (default 20 periods). This ensures the move has strong participation behind it.
Exit Strategy
A position can be closed in one of three ways, creating a comprehensive exit plan:
Stop Loss (SL): A fixed stop loss is set at a level determined by a multiple of the Average True Range (ATR). For example, a 1.5 multiplier places the stop 1.5 times the current ATR value away from the entry price. This makes the stop dynamic, adapting to market volatility.
Take Profit (TP): A fixed take profit is also set using an ATR multiplier. By setting the TP multiplier higher than the SL multiplier (e.g., 2.0 for TP vs. 1.5 for SL), the strategy aims for a positive risk-to-reward ratio on each trade.
Exit on Opposite Signal (Reversal): If enabled, an open position will be closed automatically if a valid entry signal in the opposite direction appears. For example, if you are in a long trade and a valid short signal occurs, the strategy will exit the long position immediately. This feature turns the strategy into more of a reversal system.
Key Features & Customization
Trade Direction Control: You can enable or disable long and short trades independently using the Allow Longs and Allow Shorts toggles. This is useful for trading in harmony with a higher-timeframe trend (e.g., only allowing longs in a bull market).
Visual Plots: The strategy plots the Fast EMA, Slow EMA, and VWAP on the chart for easy visualization of the setup. It also plots up/down arrows to mark where valid buy and sell signals occurred.
Dynamic SL/TP Line Plotting: A standout feature is that the strategy automatically draws the exact Stop Loss and Take Profit price lines on the chart for every active trade. These lines appear when a trade is entered and disappear as soon as it is closed, providing a clear visual of your risk and reward targets.
Alerts: The script includes built-in alertcondition calls. This allows you to create alerts in TradingView that can notify you on your phone or execute trades automatically via a webhook when a long or short signal is generated.

Signalgo MASignalgo MA is a TradingView indicator based on moving average (MA) trading by combining multi-timeframe logic, trend strength filtering, and adaptive trade management. Here’s a deep dive into how it works, its features, and why it stands apart from traditional MA indicators.
How Signalgo MA Works
1. Multi-Timeframe Moving Average Analysis
Simultaneous EMA & SMA Tracking: Signalgo MA calculates exponential (EMA) and simple (SMA) moving averages across a wide range of timeframes—from 1 minute to 3 months.
Layered Cross Detection: It detects crossovers and crossunders on each timeframe, allowing for both micro and macro trend detection.
Synchronized Signal Mapping: Instead of acting on a single crossover, the indicator requires agreement across multiple timeframes to trigger signals, filtering out noise and false positives.
2. Trend Strength & Quality Filtering
ADX Trend Filter: Trades are only considered when the Average Directional Index (ADX) confirms a strong trend, ensuring signals are not triggered during choppy or directionless markets.
Volume & Momentum Confirmation: For the strongest signals, the system requires:
A significant volume spike
Price above/below a longer-term EMA (for buys/sells)
RSI momentum confirmation
One-Time Event Detection: Each crossover event is flagged only once per occurrence, preventing repeated signals from the same move.
Inputs
Preset Parameters:
EMA & SMA Lengths: Optimized for both short-term and long-term analysis.
ADX Length & Minimum: Sets the threshold for what is considered a “strong” trend.
Show Labels/Table: Visual toggles for displaying signal and trade management information.
Trade Management:
Show TP/SL Logic: Toggle to display or hide take-profit (TP) and stop-loss (SL) levels.
ATR Length & Multipliers: Fine-tune how SL and TP levels adapt to market volatility.
Enable Trailing Stop: Option to activate dynamic stop movement after TP1.
Entry & Exit Strategy
Entry Logic
Long (Buy) Entry: Triggered when multiple timeframes confirm bullish EMA/SMA crossovers, ADX confirms trend strength, and all volume/momentum filters align.
Short (Sell) Entry: Triggered when multiple timeframes confirm bearish crossunders, with the same strict filtering.
Exit & Trade Management
Stop Loss (SL): Automatically set based on recent volatility (ATR), adapting to current market conditions.
Take Profits (TP1, TP2, TP3): Three profit targets at increasing reward multiples, allowing for flexible trade management.
Trailing Stop: After TP1 is hit, the stop loss moves to breakeven and a trailing stop is activated to lock in further gains.
Event Markers: Each time a TP or SL is hit, a visual label is placed on the chart for full transparency.
Strict Signal Quality Filters: Signals are only generated when volume spikes, momentum, and trend strength all align, dramatically reducing false positives.
Adaptive, Automated Trade Management: Built-in TP/SL and trailing logic mean you get not just signals, but a full trade management suite, rarely found in standard MA indicators.
Event-Driven, Not Static: Each signal is triggered only once per event, eliminating repetitive or redundant entries.
Visual & Alert Integration: Every signal and trade event is visually marked and can trigger TradingView alerts, keeping you informed in real time.
Trading Strategy Application
Versatility: Suitable for scalping, day trading, swing trading, and longer-term positions thanks to its multi-timeframe logic.
Noise Reduction: The layered filtering logic means you only see the highest-probability setups, helping you avoid common MA “fakeouts” and overtrading.
So basically what separates Signalgo MA from traditional MA indicators?
1. Multi-Timeframe Analysis
Traditional MA indicators: Usually measure crossovers or signals within a single timeframe.
Signalgo MA: simultaneously calculates fast/slow EMAs & SMAs for multiple periods. This enables it to create signals based on synchronized or stacked momentum across multiple periods, offering broader trend confirmation and reducing noise from single-timeframe signals.
2. Combinatorial Signal Logic
Traditional: A basic crossover is typically “if fast MA crosses above/below slow MA, signal buy/sell.”
Signalgo MA: Generates signals only when MA crossovers align across several timeframes, plus takes into consideration the presence or absence of conflicting signals in shorter or longer frames. This reduces false positives and increases selectivity.
3. Trend Strength Filtering (ADX Integration)
Traditional: Many MA indicators are “blind” to trend intensity, potentially triggering signals in low volatility or ranging conditions.
Signalgo MA: Employs ADX as a minimum trend filter. Signals will only fire if the trend is sufficiently strong, reducing whipsaws in choppy or sideways markets.
4. Volume & Strict Confirmation Layer
Traditional: Few MA indicators directly consider volume or require confluence with other major indicators.
Signalgo MA: Introduces a “strict signal” filter that requires not only MA crossovers and trend strength, but also (on designated frames):
Significant volume spike,
Price positioned above/below a higher timeframe EMA (trend anchor),
RSI momentum confirmation.
5. Persistent, Multi-Level TP/SL Automated Trade Management
Traditional: Separate scripts or manual management for stop-loss, take-profit, and trailing-stops, rarely fully integrated visually.
Signalgo MA: Auto-plots up to three take-profit levels, initial stop, and a trailing stop (all ATR-based) on the chart. It also re-labels these as they are hit and resets for each new entry, supporting full trade lifecycle visualization directly on the chart.
6. Higher Timeframe SMA Crosses for Long-Term Context
Traditional: Focuses only on the current chart’s timeframe.
Signalgo MA: Incorporates SMA cross logic for weekly, monthly, and quarterly periods, which can contextualize lower timeframe trades within broader cycles, helping filter against counter-trend signals.
7. “Signal Once” Logic to Prevent Over-Trading
Traditional: Will often re-fire the same signal repeatedly as long as the condition is true, possibly resulting in signal clusters and over-trading.
Signalgo MA: Fires each signal only once per condition—prevents duplicate alerts for the same trade context.

Signalgo BBSignalgo BB: Technical Overview
Signalgo BB is a Bollinger Bands (BB) indicator for TradingView, designed to provide a multi-dimensional view of volatility, trend, and trading opportunities within a single overlay. Below is a detailed, impartial explanation of its workings, inputs, and trading logic.
Core Mechanics
Signalgo BB operates on the principle of nested volatility bands and moving averages. It calculates:
Fast & Slow Bands: Two sets of Bollinger Bands (BB), using different moving average types (EMA or SMA), lengths, and standard deviation multipliers.
Volatility Cloud: A dynamic visual layer indicating when price is inside both, one, or neither band.
Filtering: A short-term RSI is used to confirm trend direction and filter out weak signals.
Inputs & Components
MA Type: Choice between EMA, SMA for both fast and slow MA calculations.
Fast/Slow Lengths
Fast/Slow Deviations
RSI Length/Thresholds
Show Cloud: Toggle for the visual volatility cloud.
Signal Mode: Band Break.
Prevent Repeated Signals: Option to suppress duplicate signals in the same direction.
TP/SL & Trailing Logic: Advanced, automated trade management with ATR-based distances, three take-profit levels, and a dynamic trailing stop.
Signal Generation
Band Break: Triggers when price crosses the fast BB band.
RSI Filter: All signals require RSI confirmation.
Prevent Repeated Signals: Optionally only marks the first breakout in a series to reduce overtrading.
Entry/Exit Marks: Labels are plotted for visual clarity, and signals can trigger TradingView alerts.
Trade Management
Stop Loss (SL): Set at a multiple of ATR from the entry price, adapting to current volatility.
Take Profits (TP1, TP2, TP3): Three levels scaled by risk-reward ratios, supporting partial exits.
Trailing Stop: After the first TP is hit, SL moves to breakeven and then trails at a user-defined multiple of ATR, locking in further gains.
Event Markers: Each TP, SL, and trailing stop event is labeled on the chart.
Direction State: The indicator tracks active trades, allowing for only one open position per direction at a time.
Cloud Visualization: The background color changes depending on whether price is inside both, one, or no bands, making it easier to visualize market conditions.
Multiple Signal Logics: It doesn’t just look at breakouts, it includes cloud crossings, mean reversion, and a choice of how to combine them.
Rigorous Filtering: Signals require RSI trend confirmation, reducing false entries during weak phases.
Automated Trade Management: Built-in TP/SL and trailing logic, dynamically adapting to volatility.
Signal Suppression: Option to prevent repeated signals, reducing noise and overtrading.
Customizable MA Types: Supports EMA, SMA, and a selection algorithm for future expansion.
Trading Strategy Application
Volatility Regimes: The cloud’s color indicates whether price is inside, between, or outside the bands, helping traders identify trending, ranging, or breakout conditions.
Signals: entries can be based on breakouts filtered by RSI trend strength.
Risk Management: All active trades are managed by TP/SL logic, trailing stops after TP1, and visual feedback on exits.
Visual Alerts: Both signals and TP/SL events are marked on the chart for manual review.
Flexibility: Users can switch modes or suppress repeated signals as needed, depending on trading style.
Practical Usage
Intraday to Swing: Suitable for timeframes from minutes to days, depending on the MA periods and volatility profile.
Manual or Automated: The visual overlay and alerts support both manual trading and automated strategies.
Education & Review: The colored cloud and event markers make it easy to review past price action and learn from signals.
What separates this indicator from traditional ones:
1. Dual Bollinger Bands
Traditional: Most indicators use a single set of Bollinger Bands (two standard deviations above/below a moving average).
Signalgo BB: Implements two sets of bands—a "fast" set (shorter moving average, narrower deviation) and a "slow" set (longer moving average, wider deviation). This provides both immediate (fast) and broader context (slow) for volatility and price action.
2. Volatility Cloud Visualization
Traditional: Standard Bollinger Bands display as two lines, with the area between sometimes shaded as a "band" but without dynamic color changes.
Signalgo BB: The background is colored differently depending on whether price is within both, one, or neither band, offering a visual "cloud" that distinguishes trending, ranging, or breakout regimes at a glance.
3. RSI Filtering
Traditional: Many indicators either don’t filter signals, or if they do, it’s not always configurable.
Signalgo BB: Adds an optional RSI filter, requiring signals to be confirmed by short-term RSI overbought/oversold conditions. This reduces false signals in range-bound or low-trend environments.
4. Prevention of Repeated Signals
Traditional: Most indicators will keep firing signals as long as conditions are met, which can cause overtrading.
Signalgo BB: Offers a user-toggleable option to suppress repeated signals in the same direction until the opposite signal occurs. This reduces noise for discretionary traders.
5. Integrated Trade Management
Traditional: Manual or separate coding is required for stop-loss, take-profit, and trailing stop logic.
Signalgo BB: Builds in dynamic, ATR-based stop-loss; up to three take-profit levels and a trailing stop that activates after the first TP is hit. All levels are visually plotted on the chart, and events (TP/SL hits) are labeled, aiding strategy review and automation.
6. Event Labeling and Alerts
Traditional: Alerts may exist for entry/exit, but rarely for each TP/SL event.
Signalgo BB: Places labels for every entry, exit, and TP/SL event. It also provides TradingView alertconditions for each event, enabling automated notifications or integration with trading bots.
7. Directional State Tracking
Traditional: Indicators typically do not track the "state" of a trade (e.g., active long/short/flat) beyond simple signals.
Signalgo BB: Maintains persistent variables for entry price, SL, TP, trailing stop, and trade direction, ensuring only one active signal per direction. This prevents overlapping entries and mimics realistic trade management.
8. User Customization
Traditional: Default settings are often hardcoded, or customization is limited.
Signalgo BB: Offers extensive user inputs for MA type and TP/SL logic—making the tool adaptable to many strategies and timeframes.

Diamond Peaks [EdgeTerminal]The Diamond Peaks indicator is a comprehensive technical analysis tool that uses a few mathematical models to identify high-probability trading opportunities. This indicator goes beyond traditional support and resistance identification by incorporating volume analysis, momentum divergences, advanced price action patterns, and market sentiment indicators to generate premium-quality buy and sell signals.
Dynamic Support/Resistance Calculation
The indicator employs an adaptive algorithm that calculates support and resistance levels using a volatility-adjusted lookback period. The base calculation uses ta.highest(length) and ta.lowest(length) functions, where the length parameter is dynamically adjusted using the formula: adjusted_length = base_length * (1 + (volatility_ratio - 1) * volatility_factor). The volatility ratio is computed as current_ATR / average_ATR over a 50-period window, ensuring the lookback period expands during volatile conditions and contracts during calm periods. This mathematical approach prevents the indicator from using fixed periods that may become irrelevant during different market regimes.
Momentum Divergence Detection Algorithm
The divergence detection system uses a mathematical comparison between price series and oscillator values over a specified lookback period. For bullish divergences, the algorithm identifies when recent_low < previous_low while simultaneously indicator_at_recent_low > indicator_at_previous_low. The inverse logic applies to bearish divergences. The system tracks both RSI (calculated using Pine Script's standard ta.rsi() function with Wilder's smoothing) and MACD (using ta.macd() with exponential moving averages). The mathematical rigor ensures that divergences are only flagged when there's a clear mathematical relationship between price momentum and the underlying oscillator momentum, eliminating false signals from minor price fluctuations.
Volume Analysis Mathematical Framework
The volume analysis component uses multiple mathematical transformations to assess market participation. The Cumulative Volume Delta (CVD) is calculated as ∑(buying_volume - selling_volume) where buying_volume occurs when close > open and selling_volume when close < open. The relative volume calculation uses current_volume / ta.sma(volume, period) to normalize current activity against historical averages. Volume Rate of Change employs ta.roc(volume, period) = (current_volume - volume ) / volume * 100 to measure volume acceleration. Large trade detection uses a threshold multiplier against the volume moving average, mathematically identifying institutional activity when relative_volume > threshold_multiplier.
Advanced Price Action Mathematics
The Wyckoff analysis component uses mathematical volume climax detection by comparing current volume against ta.highest(volume, 50) * 0.8, while price compression is measured using (high - low) < ta.atr(20) * 0.5. Liquidity sweep detection employs percentage-based calculations: bullish sweeps occur when low < recent_low * (1 - threshold_percentage/100) followed by close > recent_low. Supply and demand zones are mathematically validated by tracking subsequent price action over a defined period, with zone strength calculated as the count of bars where price respects the zone boundaries. Fair value gaps are identified using ATR-based thresholds: gap_size > ta.atr(14) * 0.5.
Sentiment and Market Regime Mathematics
The sentiment analysis employs a multi-factor mathematical model. The fear/greed index uses volatility normalization: 100 - min(100, stdev(price_changes, period) * scaling_factor). Market regime classification uses EMA crossover mathematics with additional ADX-based trend strength validation. The trend strength calculation implements a modified ADX algorithm: DX = |+DI - -DI| / (+DI + -DI) * 100, then ADX = RMA(DX, period). Bull regime requires short_EMA > long_EMA AND ADX > 25 AND +DI > -DI. The mathematical framework ensures objective regime classification without subjective interpretation.
Confluence Scoring Mathematical Model
The confluence scoring system uses a weighted linear combination: Score = (divergence_component * 0.25) + (volume_component * 0.25) + (price_action_component * 0.25) + (sentiment_component * 0.25) + contextual_bonuses. Each component is normalized to a 0-100 scale using percentile rankings and threshold comparisons. The mathematical model ensures that no single component can dominate the score, while contextual bonuses (regime alignment, volume confirmation, etc.) provide additional mathematical weight when multiple factors align. The final score is bounded using math.min(100, math.max(0, calculated_score)) to maintain mathematical consistency.
Vitality Field Mathematical Implementation
The vitality field uses a multi-factor scoring algorithm that combines trend direction (EMA crossover: trend_score = fast_EMA > slow_EMA ? 1 : -1), momentum (RSI-based: momentum_score = RSI > 50 ? 1 : -1), MACD position (macd_score = MACD_line > 0 ? 1 : -1), and volume confirmation. The final vitality score uses weighted mathematics: vitality_score = (trend * 0.4) + (momentum * 0.3) + (macd * 0.2) + (volume * 0.1). The field boundaries are calculated using ATR-based dynamic ranges: upper_boundary = price_center + (ATR * user_defined_multiplier), with EMA smoothing applied to prevent erratic boundary movements. The gradient effect uses mathematical transparency interpolation across multiple zones.
Signal Generation Mathematical Logic
The signal generation employs boolean algebra with multiple mathematical conditions that must simultaneously evaluate to true. Buy signals require: (confluence_score ≥ threshold) AND (divergence_detected = true) AND (relative_volume > 1.5) AND (volume_ROC > 25%) AND (RSI < 35) AND (trend_strength > minimum_ADX) AND (regime = bullish) AND (cooldown_expired = true) AND (last_signal ≠ buy). The mathematical precision ensures that signals only generate when all quantitative conditions are met, eliminating subjective interpretation. The cooldown mechanism uses bar counting mathematics: bars_since_last_signal = current_bar_index - last_signal_bar_index ≥ cooldown_period. This mathematical framework provides objective, repeatable signal generation that can be backtested and validated statistically.
This mathematical foundation ensures the indicator operates on objective, quantifiable principles rather than subjective interpretation, making it suitable for algorithmic trading and systematic analysis while maintaining transparency in its computational methodology.
* for now, we're planning to keep the source code private as we try to improve the models used here and allow a small group to test them. My goal is to eventually use the multiple models in this indicator as their own free and open source indicators. If you'd like to use this indicator, please send me a message to get access.
Advanced Confluence Scoring System
Each support and resistance level receives a comprehensive confluence score (0-100) based on four weighted components:
Momentum Divergences (25% weight)
RSI and MACD divergence detection
Identifies momentum shifts before price reversals
Bullish/bearish divergence confirmation
Volume Analysis (25% weight)
Cumulative Volume Delta (CVD) analysis
Volume Rate of Change monitoring
Large trade detection (institutional activity)
Volume profile strength assessment
Advanced Price Action (25% weight)
Supply and demand zone identification
Liquidity sweep detection (stop hunts)
Wyckoff accumulation/distribution patterns
Fair value gap analysis
Market Sentiment (25% weight)
Fear/Greed index calculation
Market regime classification (Bull/Bear/Sideways)
Trend strength measurement (ADX-like)
Momentum regime alignment
Dynamic Support and Resistance Detection
The indicator uses an adaptive algorithm to identify significant support and resistance levels based on recent market highs and lows. Unlike static levels, these zones adjust dynamically to market volatility using the Average True Range (ATR), ensuring the levels remain relevant across different market conditions.
Vitality Field Background
The indicator features a unique vitality field that provides instant visual feedback about market sentiment:
Green zones: Bullish market conditions with strong momentum
Red zones: Bearish market conditions with weak momentum
Gray zones: Neutral/sideways market conditions
The vitality field uses a sophisticated gradient system that fades from the center outward, creating a clean, professional appearance that doesn't overwhelm the chart while providing valuable context.
Buy Signals (🚀 BUY)
Buy signals are generated when ALL of the following conditions are met:
Valid support level with confluence score ≥ 80
Bullish momentum divergence detected (RSI or MACD)
Volume confirmation (1.5x average volume + 25% volume ROC)
Bull market regime environment
RSI below 35 (oversold conditions)
Price action confirmation (Wyckoff accumulation, liquidity sweep, or large buying volume)
Minimum trend strength (ADX > 25)
Signal alternation check (prevents consecutive buy signals)
Cooldown period expired (default 10 bars)
Sell Signals (🔻 SELL)
Sell signals are generated when ALL of the following conditions are met:
Valid resistance level with confluence score ≥ 80
Bearish momentum divergence detected (RSI or MACD)
Volume confirmation (1.5x average volume + 25% volume ROC)
Bear market regime environment
RSI above 65 (overbought conditions)
Price action confirmation (Wyckoff distribution, liquidity sweep, or large selling volume)
Minimum trend strength (ADX > 25)
Signal alternation check (prevents consecutive sell signals)
Cooldown period expired (default 10 bars)
How to Use the Indicator
1. Signal Quality Assessment
Monitor the confluence scores in the information table:
Score 90-100: Exceptional quality levels (A+ grade)
Score 80-89: High quality levels (A grade)
Score 70-79: Good quality levels (B grade)
Score below 70: Weak levels (filtered out by default)
2. Market Context Analysis
Use the vitality field and market regime information to understand the broader market context:
Trade buy signals in green vitality zones during bull regimes
Trade sell signals in red vitality zones during bear regimes
Exercise caution in gray zones (sideways markets)
3. Entry and Exit Strategy
For Buy Signals:
Enter long positions when premium buy signals appear
Place stop loss below the support confluence zone
Target the next resistance level or use a risk/reward ratio of 2:1 or higher
For Sell Signals:
Enter short positions when premium sell signals appear
Place stop loss above the resistance confluence zone
Target the next support level or use a risk/reward ratio of 2:1 or higher
4. Risk Management
Only trade signals with confluence scores above 80
Respect the signal alternation system (no overtrading)
Use appropriate position sizing based on signal quality
Consider the overall market regime before taking trades
Customizable Settings
Signal Generation Controls
Signal Filtering: Enable/disable advanced filtering
Confluence Threshold: Adjust minimum score requirement (70-95)
Cooldown Period: Set bars between signals (5-50)
Volume/Momentum Requirements: Toggle confirmation requirements
Trend Strength: Minimum ADX requirement (15-40)
Vitality Field Options
Enable/Disable: Control background field display
Transparency Settings: Adjust opacity for center and edges
Field Size: Control the field boundaries (3.0-20.0)
Color Customization: Set custom colors for bullish/bearish/neutral states
Weight Adjustments
Divergence Weight: Adjust momentum component influence (10-40%)
Volume Weight: Adjust volume component influence (10-40%)
Price Action Weight: Adjust price action component influence (10-40%)
Sentiment Weight: Adjust sentiment component influence (10-40%)
Best Practices
Always wait for complete signal confirmation before entering trades
Use higher timeframes for signal validation and context
Combine with proper risk management and position sizing
Monitor the information table for real-time market analysis
Pay attention to volume confirmation for higher probability trades
Respect market regime alignment for optimal results
Basic Settings
Base Length (Default: 25)
Controls the lookback period for identifying support and resistance levels
Range: 5-100 bars
Lower values = More responsive, shorter-term levels
Higher values = More stable, longer-term levels
Recommendation: 25 for intraday, 50 for swing trading
Enable Adaptive Length (Default: True)
Automatically adjusts the base length based on market volatility
When enabled, length increases in volatile markets and decreases in calm markets
Helps maintain relevant levels across different market conditions
Volatility Factor (Default: 1.5)
Controls how much the adaptive length responds to volatility changes
Range: 0.5-3.0
Higher values = More aggressive length adjustments
Lower values = More conservative length adjustments
Volume Profile Settings
VWAP Length (Default: 200)
Sets the calculation period for the Volume Weighted Average Price
Range: 50-500 bars
Shorter periods = More responsive to recent price action
Longer periods = More stable reference line
Used for volume profile analysis and confluence scoring
Volume MA Length (Default: 50)
Period for calculating the volume moving average baseline
Range: 10-200 bars
Used to determine relative volume (current volume vs. average)
Shorter periods = More sensitive to volume changes
Longer periods = More stable volume baseline
High Volume Node Threshold (Default: 1.5)
Multiplier for identifying significant volume spikes
Range: 1.0-3.0
Values above this threshold mark high-volume nodes with diamond shapes
Lower values = More frequent high-volume signals
Higher values = Only extreme volume events marked
Momentum Divergence Settings
Enable Divergence Detection (Default: True)
Master switch for momentum divergence analysis
When disabled, removes divergence from confluence scoring
Significantly impacts signal generation quality
RSI Length (Default: 14)
Period for RSI calculation used in divergence detection
Range: 5-50
Standard RSI settings apply (14 is most common)
Shorter periods = More sensitive, more signals
Longer periods = Smoother, fewer but more reliable signals
MACD Settings
Fast (Default: 12): Fast EMA period for MACD calculation (5-50)
Slow (Default: 26): Slow EMA period for MACD calculation (10-100)
Signal (Default: 9): Signal line EMA period (3-20)
Standard MACD settings for divergence detection
Divergence Lookback (Default: 5)
Number of bars to look back when detecting divergences
Range: 3-20
Shorter periods = More frequent divergence signals
Longer periods = More significant divergence signals
Volume Analysis Enhancement Settings
Enable Advanced Volume Analysis (Default: True)
Master control for sophisticated volume calculations
Includes CVD, volume ROC, and large trade detection
Critical for signal accuracy
Cumulative Volume Delta Length (Default: 20)
Period for CVD smoothing calculation
Range: 10-100
Tracks buying vs. selling pressure over time
Shorter periods = More reactive to recent flows
Longer periods = Broader trend perspective
Volume ROC Length (Default: 10)
Period for Volume Rate of Change calculation
Range: 5-50
Measures volume acceleration/deceleration
Key component in volume confirmation requirements
Large Trade Volume Threshold (Default: 2.0)
Multiplier for identifying institutional-size trades
Range: 1.5-5.0
Trades above this threshold marked as large trades
Lower values = More frequent large trade signals
Higher values = Only extreme institutional activity
Advanced Price Action Settings
Enable Wyckoff Analysis (Default: True)
Activates simplified Wyckoff accumulation/distribution detection
Identifies potential smart money positioning
Important for high-quality signal generation
Enable Supply/Demand Zones (Default: True)
Identifies fresh supply and demand zones
Tracks zone strength based on subsequent price action
Enhances confluence scoring accuracy
Enable Liquidity Analysis (Default: True)
Detects liquidity sweeps and stop hunts
Identifies fake breakouts vs. genuine moves
Critical for avoiding false signals
Zone Strength Period (Default: 20)
Bars used to assess supply/demand zone strength
Range: 10-50
Longer periods = More thorough zone validation
Shorter periods = Faster zone assessment
Liquidity Sweep Threshold (Default: 0.5%)
Percentage move required to confirm liquidity sweep
Range: 0.1-2.0%
Lower values = More sensitive sweep detection
Higher values = Only significant sweeps detected
Sentiment and Flow Settings
Enable Sentiment Analysis (Default: True)
Master control for market sentiment calculations
Includes fear/greed index and regime classification
Important for market context assessment
Fear/Greed Period (Default: 20)
Calculation period for market sentiment indicator
Range: 10-50
Based on price volatility and momentum
Shorter periods = More reactive sentiment readings
Momentum Regime Length (Default: 50)
Period for determining overall market regime
Range: 20-100
Classifies market as Bull/Bear/Sideways
Longer periods = More stable regime classification
Trend Strength Length (Default: 30)
Period for ADX-like trend strength calculation
Range: 10-100
Measures directional momentum intensity
Used in signal filtering requirements
Advanced Signal Generation Settings
Enable Signal Filtering (Default: True)
Master control for premium signal generation system
When disabled, uses basic signal conditions
Highly recommended to keep enabled
Minimum Signal Confluence Score (Default: 80)
Required confluence score for signal generation
Range: 70-95
Higher values = Fewer but higher quality signals
Lower values = More frequent but potentially lower quality signals
Signal Cooldown (Default: 10 bars)
Minimum bars between signals of same type
Range: 5-50
Prevents signal spam and overtrading
Higher values = More conservative signal spacing
Require Volume Confirmation (Default: True)
Mandates volume requirements for signal generation
Requires 1.5x average volume + 25% volume ROC
Critical for signal quality
Require Momentum Confirmation (Default: True)
Mandates divergence detection for signals
Ensures momentum backing for directional moves
Essential for high-probability setups
Minimum Trend Strength (Default: 25)
Required ADX level for signal generation
Range: 15-40
Ensures signals occur in trending markets
Higher values = Only strong trending conditions
Confluence Scoring Settings
Minimum Confluence Score (Default: 70)
Threshold for displaying support/resistance levels
Range: 50-90
Levels below this score are filtered out
Higher values = Only strongest levels shown
Component Weights (Default: 25% each)
Divergence Weight: Momentum component influence (10-40%)
Volume Weight: Volume analysis influence (10-40%)
Price Action Weight: Price patterns influence (10-40%)
Sentiment Weight: Market sentiment influence (10-40%)
Must total 100% for balanced scoring
Vitality Field Settings
Enable Vitality Field (Default: True)
Controls the background gradient field display
Provides instant visual market sentiment feedback
Enhances chart readability and context
Vitality Center Transparency (Default: 85%)
Opacity at the center of the vitality field
Range: 70-95%
Lower values = More opaque center
Higher values = More transparent center
Vitality Edge Transparency (Default: 98%)
Opacity at the edges of the vitality field
Range: 95-99%
Creates smooth fade effect from center to edges
Higher values = More subtle edge appearance
Vitality Field Size (Default: 8.0)
Controls the overall size of the vitality field
Range: 3.0-20.0
Based on ATR multiples for dynamic sizing
Lower values = Tighter field around price
Higher values = Broader field coverage
Recommended Settings by Trading Style
Scalping (1-5 minutes)
Base Length: 15
Volume MA Length: 20
Signal Cooldown: 5 bars
Vitality Field Size: 5.0
Higher sensitivity for quick moves
Day Trading (15-60 minutes)
Base Length: 25 (default)
Volume MA Length: 50 (default)
Signal Cooldown: 10 bars (default)
Vitality Field Size: 8.0 (default)
Balanced settings for intraday moves
Swing Trading (4H-Daily)
Base Length: 50
Volume MA Length: 100
Signal Cooldown: 20 bars
Vitality Field Size: 12.0
Longer-term perspective for multi-day moves
Conservative Trading
Minimum Signal Confluence: 85
Minimum Confluence Score: 80
Require all confirmations: True
Higher thresholds for maximum quality
Aggressive Trading
Minimum Signal Confluence: 75
Minimum Confluence Score: 65
Signal Cooldown: 5 bars
Lower thresholds for more opportunities

Signalgo S/RSignalgo S/R
Signalgo S/R is a cutting-edge TradingView indicator engineered for traders who want to leverage support and resistance (S/R) in a way that goes far beyond traditional methods. This overview will help you understand its unique approach, inputs, entry and exit strategies, and what truly sets it apart.
How Signalgo S/R Works
Multi-Timeframe S/R Detection
Layered Analysis: Signalgo S/R continuously scans price action across a wide spectrum of timeframes, from 1 minute up to 3 months. This multi-layered approach ensures that both short-term and long-term S/R levels are dynamically tracked and updated.
Advanced Pivot Recognition: Instead of simply plotting static lines, the indicator uses a sophisticated pivot recognition system to identify only the most relevant and recent S/R levels, adapting as the market evolves.
Synchronized Structure: By aligning S/R levels across timeframes, it builds a robust market structure that highlights truly significant zones—areas where price is most likely to react.
Intelligent Breakout & Reversal Signals
Close Confirmation: The indicator only triggers a breakout or breakdown signal when price not just touches, but closes beyond a key S/R level, dramatically reducing false signals.
Multi-Timeframe Confirmation: True buy or sell signals require agreement across several timeframes, filtering out noise and improving reliability.
One-Time Event Detection: Each breakout or breakdown is recognized only once per occurrence, eliminating repetitive signals from the same event.
Inputs & User Controls
Preset Parameters:
Pivot Length: Adjusts how sensitive the S/R detection is to price swings.
Label Offset: Fine-tunes the placement of visual labels for clarity.
Trade Management Controls:
Show TP/SL Logic: Toggle to display or hide take-profit (TP) and stop-loss (SL) levels.
ATR Length & Multipliers: Adapt SL and TP distances to current volatility.
Enable Trailing Stop: Option to activate dynamic stop movement after TP1 is reached.
Entry & Exit Strategy
Entry Logic
Long (Buy) Entry: Triggered when multiple timeframes confirm a breakout above resistance, signaling strong upward momentum.
Short (Sell) Entry: Triggered when multiple timeframes confirm a breakdown below support, indicating strong downward momentum.
Exit & Trade Management
Stop Loss (SL): Automatically set based on recent volatility, always adapting to current market conditions.
Take Profits (TP1, TP2, TP3): Three profit targets are set at increasing reward multiples, allowing for partial exits or scaling out.
Trailing Stop: After the first profit target is reached, the stop loss moves to breakeven and a trailing stop is activated, locking in gains as the trade continues.
Event Markers: Each time a TP or SL is hit, a visual label is placed on the chart for full transparency.
What Separates Signalgo S/R from Traditional S/R Indicators?
True Multi-Timeframe Synchronization: Most S/R tools only look at a single timeframe or plot static levels. Signalgo S/R dynamically aligns levels across all relevant timeframes, providing a comprehensive market map.
Event-Driven, Not Static: Instead of plotting every minor swing, it intelligently filters for only the most actionable S/R levels and signals—reducing chart clutter and focusing attention on what matters.
Breakout Confirmation Logic: Requires a close beyond S/R, not just a wick, to validate breakouts or breakdowns. This greatly reduces false positives.
Automated, Adaptive Trade Management: Built-in TP/SL and trailing logic mean you get not just signals, but a full trade management suite—something rarely found in standard S/R indicators.
Visual & Alert Integration: Every signal, TP/SL event, and trailing stop is visually marked and can trigger TradingView alerts, keeping you informed in real time.
Trading Strategy Application
Scalping to Swing Trading: The multi-timeframe logic makes it suitable for all trading styles, from fast intraday moves to longer-term position trades.
Systematic, Disciplined Execution: By automating entries, exits, and risk management, Signalgo S/R helps you trade with confidence and consistency, removing emotion from the process.
Noise Reduction: The advanced filtering logic means you only see the highest-probability setups, helping you avoid common S/R “fakeouts.”

Signalgo XSignalgo X
Signalgo X is a sophisticated indicator crafted for traders who demand a disciplined, multi-layered approach to market analysis and trade management. This overview will help you understand its capabilities, logic, and how it can elevate your trading.
Core Concept
Signalgo X is built to:
Scan multiple timeframes simultaneously for price, volume, and volatility patterns.
Filter out unreliable signals during periods of market hype or manipulation.
Automate trade management with dynamic take-profit (TP), stop-loss (SL), and trailing logic.
Deliver actionable, visual signals and alerts for timely, confident decisions.
Inputs & Controls
Preset System Parameters:
News Sensitivity: Determines how responsive the indicator is to price moves.
Hype Filter Strength: Sets how aggressively the system avoids volatile, manipulated, or news-driven periods.
User-Configurable:
Show TP/SL Logic: Turn on/off the display of take-profit and stop-loss levels directly on your chart.
How Signalgo X Works
1. Multi-Timeframe Market Analysis
Signalgo X continuously monitors:
Closing price
Trading volume
Volatility (ATR)
across six distinct timeframes, from 1 hour to 3 months. This layered approach ensures that signals are validated by both short-term momentum and long-term trends.
2. Price, Volume, and Volatility Synthesis
Price Change: The system tracks percentage changes over each timeframe to gauge momentum.
Volume Ratio: By comparing current volume to a moving average, it detects unusual spikes that may signal institutional activity or manipulation.
Volatility: Measures the intensity of price movements relative to average ranges, helping to identify breakout or exhaustion scenarios.
3. Proprietary Anti-Hype Filter
A unique scoring mechanism evaluates:
Volume spikes without corresponding price action
Sudden jumps in volatility
Conflicting signals across timeframes
Social hype proxies (e.g., sharp moves on low volume)
If the market is deemed “hyped,” all trading signals are suppressed and a clear warning is shown, keeping you out of unpredictable conditions.
4. Signal Classification & Mapping
Significant Moves: Only price actions that exceed a sensitivity threshold and are confirmed by volume/volatility are considered.
Bullish/Bearish Signals: Generated for each timeframe.
Signal Strength: Categorized as regular, or strong based on multi-timeframe agreement.
Entry & Exit Strategy
Entry Logic
Long (Buy) Entry: Triggered when bullish signals are detected (of any strength) and no hype is present.
Short (Sell) Entry: Triggered when bearish signals are detected and no hype is present.
Exit & Trade Management
Stop Loss (SL): Placed at a calculated distance from entry, adapting to recent volatility.
Take Profits (TP1, TP2, TP3): Three profit targets, each at a greater reward multiple.
Trailing Stop: After the first take-profit is hit, the stop-loss moves to breakeven and a trailing stop is activated to protect further gains.
Event Tracking: The indicator visually marks when each TP or SL is hit, providing real-time feedback.
Chart Plots: All relevant SL, TP, and trailing stop levels are clearly marked for both long and short trades.
Labels: Entry, exit, and signal strength events are color-coded and visually prominent.
Alerts: Built-in alert conditions allow you to set up TradingView notifications for strong/regular buy/sell signals and hype warnings.
Trading Strategy Application
Multi-Timeframe Confirmation: Only strong signals confirmed by several timeframes are acted upon, reducing false positives.
Volume & Volatility Awareness: The indicator avoids low-quality, “fakeout” signals by requiring confirmation from both price and volume/volatility.
Hype Avoidance: Keeps you out of the market during news-driven or manipulated periods, helping to protect your capital.
Automated Discipline: The TP/SL logic enforces a rules-based exit strategy, helping you lock in profits and limit losses without emotional interference.
Who Should Use Signalgo X?
Signalgo X is ideal for traders who want:
Systematic, high-confidence signals
Automated and disciplined trade management
Protection against unpredictable market events
Clear, actionable visuals and alerts

UT Bot + LinReg Candles (Dual Sensitivity)
Script Description:
This indicator combines the popular UT Bot Alerts system with Linear Regression Candles (open source) for enhanced trend detection and trading signals in one singel script. The UT Bot features independent, then 2 x ATR sensitivity and periods controls for buy and sell signals, allowing you to fine-tune entries and exits to match your strategy. The script also overlays colored Linear Regression Candles with an optional signal line, helping you visually identify trend strength and direction. All calculations are performed on standard chart prices (no Heikin Ashi). Suitable for all asset classes and timeframes.
Eample setting for usdjpy 5 min chart for repeated buy and sell singnals based on trend:
BUY ATR period 300 multiplier 1
SELL ATR period 1 multiplier 2
Disclaimer:
This script is for informational and educational purposes only. It is not financial advice. Use at your own risk; the author assumes no responsibility for any trading results or losses.
Credits goes to to Ugurvu for linreg candles and quantnomad for UT Bot alerts that make this script possible.
Author: Patrick

Future is hereOverview
"Future is Here" is an original, multi-faceted Pine Script indicator designed to provide traders with a comprehensive toolset for identifying high-probability trading opportunities. By integrating volatility-based entry zones, trend-based price targets, momentum confirmation, dynamic support/resistance levels, and risk-reward ratio (RRR) calculations, this indicator offers a cohesive and actionable trading framework. Each feature is carefully designed to complement the others, ensuring a synergistic approach that enhances decision-making across various market conditions. This script is unique in its ability to combine these elements into a single, streamlined interface with clear visual cues and customizable alerts, making it suitable for both novice and experienced traders.
Key Features and How They Work Together
Volatility-Based Entry Zones
Purpose: Identifies overbought and oversold conditions using a volatility-adjusted moving average, helping traders spot potential reversal zones.
Mechanism: Utilizes a user-defined volatility length and multiplier to calculate dynamic overbought/oversold thresholds based on the standard deviation of price. Crossovers and crossunders of these levels trigger "Buy Zone" or "Sell Zone" labels.
Synergy: These zones act as the foundation for entry signals, which are later confirmed by momentum and trend filters to reduce false signals.
Trend-Based Price Targets
Purpose: Projects potential price targets based on the prevailing trend, giving traders clear objectives for profit-taking.
Mechanism: Combines a fast and slow moving average to determine trend direction, then calculates target prices using a multiplier of the price deviation from the slow MA. Labels display bullish or bearish targets when the fast MA crosses the slow MA.
Synergy: Works in tandem with entry zones and momentum signals to align targets with market conditions, ensuring traders aim for realistic price levels supported by trend strength.
Momentum Confirmation
Purpose: Validates entry signals by assessing momentum strength, filtering out weak setups.
Mechanism: Uses the momentum indicator to detect bullish or bearish momentum crossovers, labeling them as "Strong" or "Weak" based on a comparison with a smoothed momentum average.
Synergy: Enhances the reliability of buy/sell signals by ensuring momentum aligns with volatility zones and trend direction, reducing the risk of premature entries.
Dynamic Support/Resistance Levels
Purpose: Highlights key price levels where the market is likely to react, aiding in trade planning and risk management.
Mechanism: Detects pivot highs and lows over a user-defined lookback period, drawing horizontal lines for the most recent support and resistance levels (limited to two each for clarity). Labels mark these levels with price values.
Synergy: Complements entry zones and price targets by providing context for potential reversal or continuation points, helping traders set logical stop-losses or take-profits.
Buy/Sell Signals with Risk-Reward Ratios
Purpose: Generates precise buy/sell signals with integrated take-profit (TP), stop-loss (SL), and RRR calculations for disciplined trading.
Mechanism: Combines volatility zone crossovers, trend confirmation, and positive momentum to trigger signals. ATR-based TP and SL levels are calculated, and the RRR is displayed in labels for quick assessment.
Synergy: This feature ties together all previous components, ensuring signals are only generated when volatility, trend, and momentum align, while providing clear risk-reward metrics for trade evaluation.
Customizable Alerts
Purpose: Enables traders to stay informed of trading opportunities without constant chart monitoring.
Mechanism: Alert conditions are set for buy and sell signals, delivering notifications with the entry price for seamless integration into trading workflows.
Synergy: Enhances usability by allowing traders to act on high-probability setups identified by the indicator’s combined logic.
Originality
"Future is Here" is an original creation that distinguishes itself through its holistic approach to technical analysis. Unlike single-purpose indicators, it integrates volatility, trend, momentum, and support/resistance into a unified system, reducing the need for multiple scripts. The inclusion of RRR calculations directly in signal labels is a unique feature that empowers traders to evaluate trade quality instantly. The script’s design emphasizes clarity and efficiency, with cooldowns to prevent label clutter and a limit on support/resistance lines to maintain chart readability. This combination of features, along with its customizable parameters, makes it a versatile and novel tool for traders seeking a robust, all-in-one solution.
How to Use
Setup: Add the indicator to your TradingView chart and adjust input parameters (e.g., Volatility Length, Trend Length, TP/SL Multipliers) to suit your trading style and timeframe.
Interpretation:
Look for "Buy Zone" or "Sell Zone" labels to identify potential entry points.
Confirm entries with "Bull Mom" or "Bear Mom" labels and trend direction (Bull/Bear Target labels).
Use Support/Resistance lines to set logical TP/SL levels or anticipate reversals.
Evaluate Buy/Sell signals with TP, SL, and RRR for high-probability trades.
Alerts: Set up alerts for Buy/Sell signals to receive real-time notifications.
Customization: Fine-tune multipliers and lengths to adapt the indicator to different markets (e.g., stocks, forex, crypto) or timeframes.

LON Super Tiangong Index## LON Super Heavenly Palace Indicator
### Description
The LON Super Heavenly Palace indicator is a sophisticated multi-line oscillator that identifies potential trading opportunities through a combination of momentum and trend analysis. It features four distinct lines that work together to provide comprehensive market insights.
### Key Features
- **Four Main Lines**: Short, Mid, Mid-Long, and Long lines with distinct colors
- **Adaptive Signals**: Uses both absolute and relative value analysis for better market adaptation
- **Visual Alerts**: Background highlighting and shape markers for clear signal identification
- **Multiple Signal Types**: Comprehensive signal system for various market conditions
### Trading Signals
#### Bullish Signals
- **Dragon's Treasure**: Blue background when all lines are in relative bottom territory
- **Golden Signal**: Cyan circles when all lines are below 20
- **Bounce Signal**: Pink triangles when long-term momentum turns positive
- **Perfect Opportunity**: Purple triangles for optimal entry conditions
#### Bearish Signals
- **Heaven's Treasure**: Yellow background when mid and long lines reach relative top territory
- **Top Signal**: Yellow circles when mid line exceeds 80
#### Confirmation Signals
- **Bottom Signal**: Magenta circles for oversold conditions
- **Strong Bottom**: Large purple triangles for major reversal opportunities
### How to Use
#### Entry Strategy
1. **Wait for Dragon's Treasure** (blue background) - indicates oversold conditions
2. **Look for Golden Signal** (cyan circles) - confirms bottom formation
3. **Confirm with Bounce Signal** (pink triangles) - momentum turning positive
4. **Enter on Perfect Opportunity** (purple triangles) - optimal timing
#### Exit Strategy
1. **Monitor Heaven's Treasure** (yellow background) - overbought conditions
2. **Watch for Top Signal** (yellow circles) - exit signal
3. **Use reference lines** (20, 80) for additional confirmation
#### Risk Management
- Use the 15 and 80 reference lines as support/resistance
- Combine multiple signals for higher probability trades
- Avoid trading against strong trend signals
- Use the -90 reference line for extreme oversold conditions
### Best Practices
- **Timeframe**: Works best on 1H, 4H, and Daily charts
- **Markets**: Effective on stocks, forex, and crypto
- **Confirmation**: Always wait for multiple signals to align
- **Patience**: Don't force trades - wait for clear signal combinations
### Visual Reference
- **Blue background** = Potential buying opportunity
- **Yellow background** = Potential selling opportunity
- **Colored circles** = Confirmation signals
- **Triangles** = Entry/exit points
- **Dotted lines** = Key reference levels
This indicator excels at identifying oversold/overbought conditions and potential reversal points, making it ideal for swing trading and medium-term position management.

Intraday BUY/SELL & AUTO SL (5-min timeframe only) by chaitu50c)Intraday BUY/SELL & AUTO SL (5-min timeframe only) by chaitu50c
This indicator provides intraday traders with BUY/SELL reversal signals and automated SL (Stoploss) tracking, based on a 3-candle reversal block logic — designed to work exclusively on the 5-min timeframe.
Key Features:
• 3-Candle Reversal Logic — Signals are generated when a defined 3-candle reversal pattern is detected (body-close breakout).
• Current Session Only — All signals and SL lines are valid only for the current session and automatically reset at session start.
• BUY/SELL Signal Labels — Visual ▲ and ▼ labels mark valid reversal signals on the chart.
• Dynamic Auto SL Lines — Plots dashed SL lines based on the reversal block's low/high.
• SL HIT Tracking — If SL is broken, the line stops extending and a ‘SL HIT’ label is displayed at the midpoint of the SL line.
• Adjustable Visual Settings — Customize signal label size, SL line width, colors, and more.
• Clean & Lightweight — Optimized for intraday use without cluttering the chart.
How to Use:
You can trade this indicator in two ways:
1. Direct Signal Entry — Take a BUY or SELL trade when a valid ▲/▼ reversal signal forms.
2. SL HIT Re-entry — If an existing SL line is broken and ‘SL HIT’ appears, you can optionally take an opposite side trade in the direction of the SL HIT.
Example:
A BUY signal is generated and an SL line is plotted below.
If price breaks the SL (SL HIT appears), you may consider entering a SELL trade at that point — as it indicates weakness.
Important Notes:
• Works only on 5-min timeframe — Set your chart to 5-min for correct behavior.
• Designed for intraday trading — all signals and SL levels reset at session start.
• Does not carry signals between sessions.
• SL lines and HIT labels provide a clear and simple visual aid for trade management.
---
