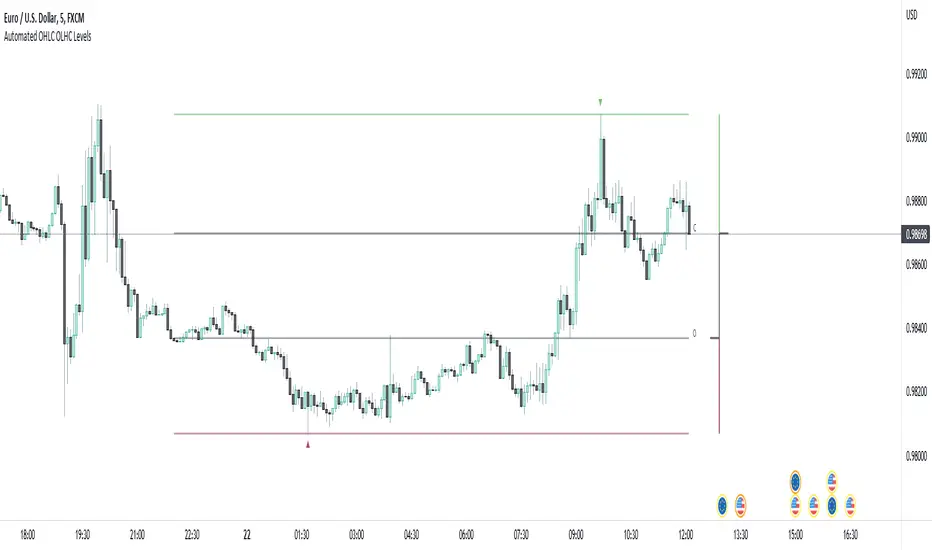
Automated OHLC OLHC LevelsA simple, clean, effective visualization tool, for the OHLC or OLHC of a chosen candle/timeframe.
Apply this indicator using a higher timeframe, in conjunction with other levels and the directional bias, to easily recognize trading opportunities at lower timeframes.
Candle
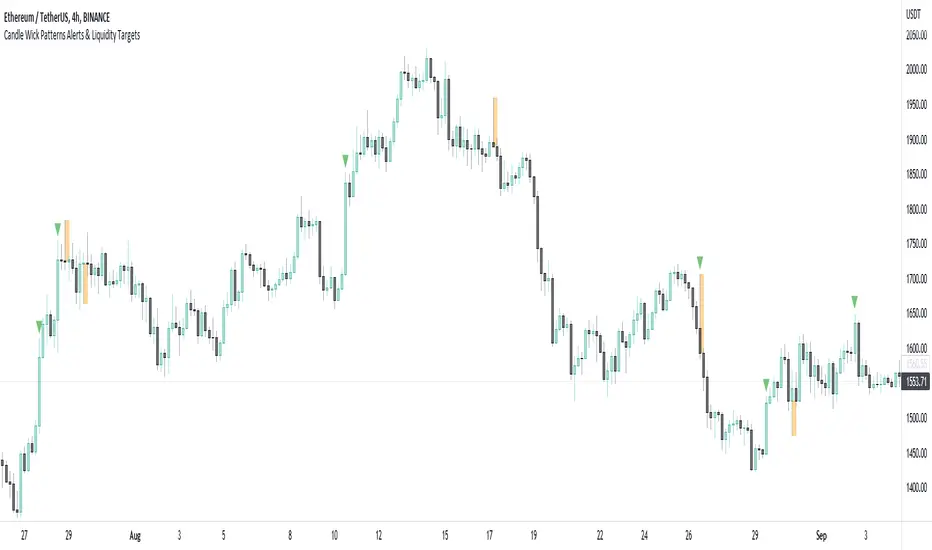
Candle Wick Patterns Alerts & Liquidity TargetsCandle wicks provide incredibly useful confluence and confirmation of price action and technical analysis.
Quite simply a wick is formed by price being moved to an extreme by one side, then price being pushed back by the other side.
This can show increased pressure by one side, reduced or increased momentum, or exhaustion by another side.
This indicator while simple, is extremely powerful and versatile and can be set up to recognize numerous types of candle wick and therefore suit numerous trading styles.
The settings as to how wicks are highlighted are:
- Timeframe - view wicks on a higher timeframe while trading on a lower timeframe
- Minimum Wick to Body Ratio - increasing this value will look for wicks who are at least n times larger than the candle body. The most obvious examples here are Doji's - hammer, gravestone, dragonfly, etc. These can indicate trend reversals, indecision and changing momentum.
- Minimum Candle Body as percent of price - this value makes sure that any wick highlighted, belongs to a candle with a body that is at least n% of the price. A higher value is likely to show price momentum is stronger in a particular direction, good for confirming a trend.
- Minimum Candle Wick as percent of price - similar to candle bodies, this value will make sure the candle wick is at least n% of the price. This will identify large fluctuations in price, and if you are familiar with smart money concepts, an increasingly popular strategy is to target 50% of the wick being filled (liquidity).
- Show half fill level of wick - As above, this can provide a good target, which price will be drawn to, depending on the wick.
Finally, the indicator can be used to create alerts when a new wick that meets your settings criteria, is formed.
And don't forget you can add the indicator multiple times, with different settings to cover multiple scenarios and timeframes!
Regression Channel, Candles and Candlestick Patterns by MontyRegression Candles by ugurvu
Regression Channel by Tradingview
All Candlestick Patterns By Tradingview
This script was combined for a friend of mine who needed this.
This Script has regression candles by ugurvu, Regression channel and Candlestick patterns by tradingview.
The intention was to fuse these together so more information can be processed on the cost of a single indicator.

Candle Info by MontyThis indicator was made to help my friend.
This indicator basically calculates the MOVE in percentage and shows the OHLC of candle in a label.
-> Panel Index: How much index you want the label to be.
-> Show Candle OHLC: Shows Open High Low and Close of the candle in the panel/label
-> % Calculation Mode:
1: Calculated by Candle Wick Low to Candle Wick High for Green candle and Vice Versa for Red Candle
2: Calculated by Open of a candle to the current price.
-> Label Text Color: Used to change the color of the Label Text
-> Label Background Color: Used to change the color of Label background
Join the free Discord: discord.gg/chuffgang

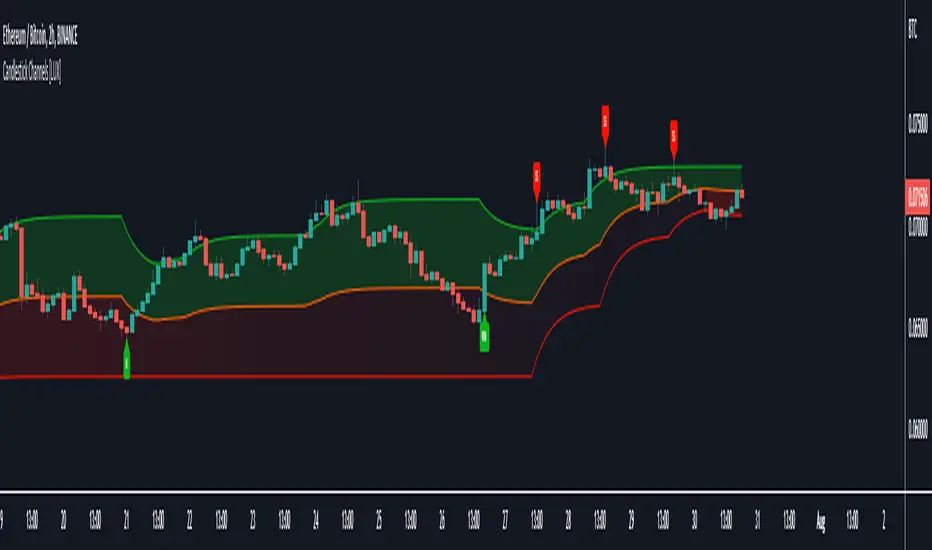
Candlestick Channels [LuxAlgo]Candlestick Channels return channels whose extremities converge towards the price when a corresponding candlestick pattern is detected. This allows for us to obtain more reactive extremities in the presence of a cluster of candlestick patterns.
The detected candlestick patterns are also highlighted with labels on your chart automatically.
Settings
Trend Length: Period of the stochastic oscillator used to determine trend sentiment; this sentiment is used to detect certain candlestick patterns.
Convergence: Convergence percentage of the channel extremities used during the occurrence of a candlestick pattern. A lower value will return extremities converging more slowly toward the price.
Smooth: Determines the degree of smoothness of the channel extremities.
Patterns
This category determines which patterns are detected by the indicator. Patterns toggled off will not be detected and won't affect the channels.
Usage
Candlesticks patterns are commonly used by traders to detect potential reversals or continuation periods in the price. It can be of interest to use them as core elements in the calculation of more classical indicators, this can allow us to filter out potential false signals returned by candlestick patterns by shifting the source of interpretation towards the channel extremities instead.
In this indicator extremities converge towards the price when a corresponding pattern is detected. As such bullish patterns will make the upper extremity converge towards the price, facilitating a cross with price. Using a lower convergence percentage will require a greater number of patterns to make the extremity converge closer towards the price.
Users can use the channel like most indicators returning extremities, with an uptrend being detected when price cross over the upper extremity and a downtrend being detected when price cross under the lower extremity.
An approach solely making use of crosses between the price and the average line can be used but the user should expect further whipsaws signals.
Users can eventually use the candlestick patterns as entries and use the extremities for confirmation. For example, users can follow a candlestick pattern return an indication in accordance with the detected trend by the channels.
This approach would lead to the following of bullish patterns when they occur in an uptrend, that is when the price is above the average line (in orange). The same logic applies to bearish patterns.
The chart above highlights the candlesticks patterns in accordance with a detected trend.
Notes
- Bullish/Bearish engulfing patterns are turned off by default due their more frequent appearance.
- Candlestick patterns relying on gaps were not included, since they would be more uncommon in cryptocurrencies, thus leading to a disparity between the indicator performance on the cryptocurrency and stock market.
Line Chart with circles on sub chart / LineChart no CandlesLine Chart with circles as a subchart. The circle will appear only after the candle has been confirmed.
Things you can change:
- Source: open, high, low, close, hl2, hlc3, ohlc4, hlcc4
- Color: change the color of the line and the circles
have fun with it!

Sneaky VolumeSneaky Volume
An experimental script that marks the highest and lowest candle of the day with above average volume.
New candles that meet the criteria will repaint until daily close
How to use
They can be interpreted in a number of ways. Potential sign of consolidation, reversal, continuation or retest zones. Use on own discretion.
In action

Real-time price distribution in candlesThis indicator splits the candle time into 30 units to indicate where the price was at each time.
In the case of a 1-hour time zone, 60 minutes / 30 = 2 minutes, so this display the location of the price every 2 minutes.
In case of 1 minute time zone, it is displayed every 2 seconds.
CAUTION
If a transaction does not occur, the display may be omitted.
You can change the color of the opening and closing prices and the size of the dots.

Percent above or Below Moving Average Candle colourFilter:
If green candle is 'x' % above moving average than colour of candle is turn in blue colour.
If red candle is 'x' % below moving average than colour of candle is turn in orange colour.

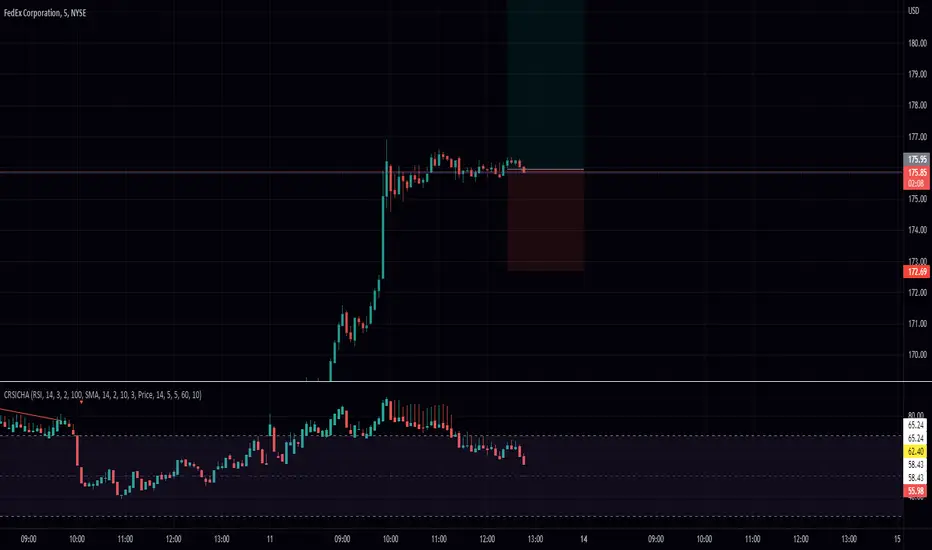
RSI Candle with Connors RSI and Heikin Ashi (CRSICHA)This script was designed to work and feel like the built in RSI script but with a lot of added feature that traders might enjoy. You get to see the RSI represented as candle sticks OR Heikin Ashi. I have added in Connors RSI as a bonus so you can see what this lesser used study looks like in candle form. Just like in the original script I have moving averages and Bollinger Bands. I must say, Heikin Ashi really excells in this situation because you don't need to know an exact price! As always I hope every one finds this useful! Enjoy!
Candle Strength IndicatorThe candle strength indicator depicts the average strength of the price action by evaluating bullish vs bearish candles.
The scale is relative to price fluctuation and the size of the candles for the particular ticker / market, so there are no significant levels.
A cross on the zero line would generally indicate a change in trend / sentiment.
This indicator may be useful as a filter for entries and use in confluence with other indicators.

Candle Stick UpdateHeikin ashi chart so powerful that you can understand trend direction easily. But sometimes, this type of chart doesn't update properly and make no sense on real time. So I made this script. You can now change candle stick style default to heikin ashi (default / modified version) on the real time default chart without switching heikin ashi chart. Enjoy traders!!! And don't forget to press the like button :)

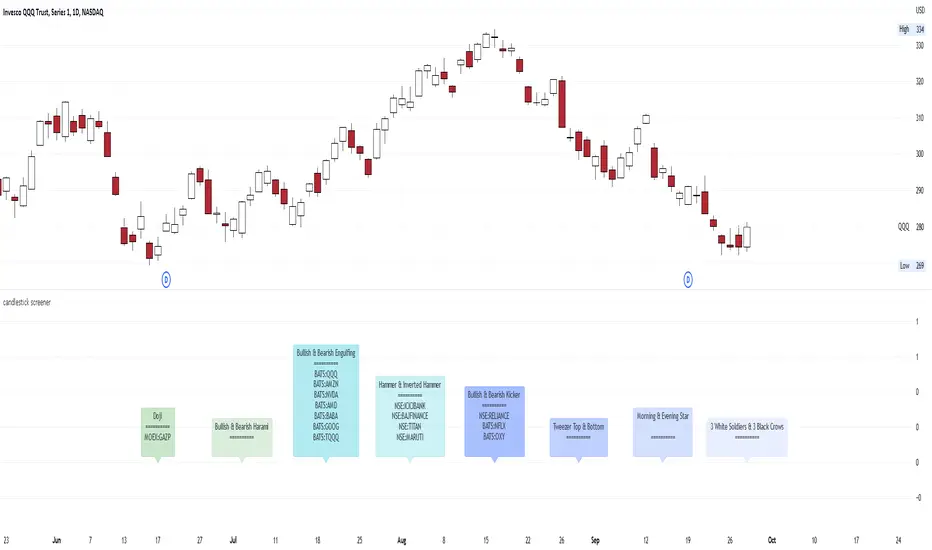
candlestick screenerhello traders..
I think it would be awesome if traders using a candlestick price action have a candlestick pattern screener.
so you just have to screen the securities, crypto, forex, commodities, spot the candlestick pattern easily and then you can set up trades..
This is a multi time frame candlestick screener, consist of:
1. Bullish & Bearish Kicker
2. Morning & Evening Star
3. Three White Soldiers & Three Black Crows
4. Tweezer Top & Bottom
5. Doji
6. Spinning Top & Bottom
7. Bullish & Bearish Harami
8. Bullish & Bearish Engulfing
9. Hanging Man & Shooting Star
10. Hammer & Inverted Hammer
the time frame of the screener, follows the Main Chart Time Frame;
- if your main chart in M5, then the result is in M5
- if your main chart in M15, then the result is in M15
- if your main chart in H1, then the result is in H1
- if your main chart in Daily, then the result is in Daily
- if your main chart in Weekly, then the result is in Weekly
- if your main chart in Monthly, then the result is in Monthly
Here are some the examples in multi time frame:
M5
M15
M30
H1
H4
Daily
Weekly
Monthly
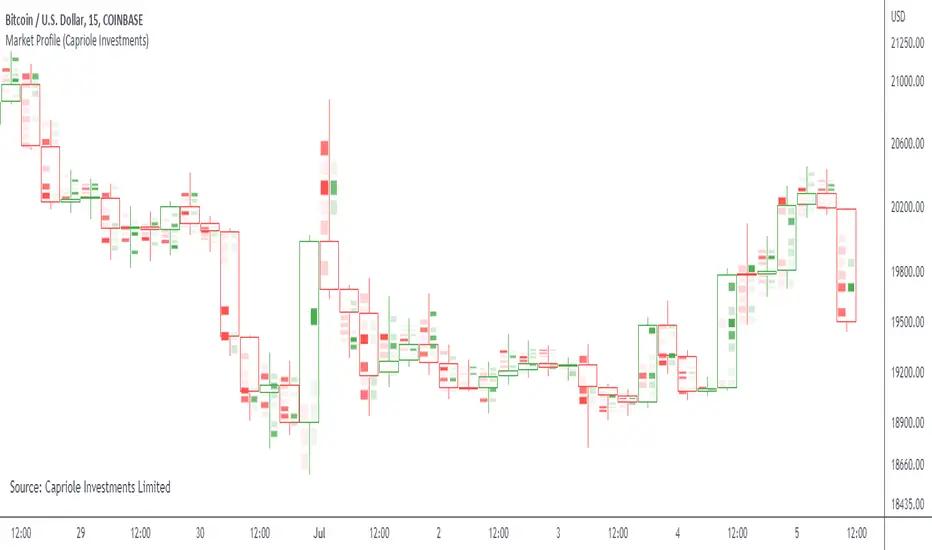
Market ProfileSimple "Market Profile" script to help visualize where high volume nodes are occurring on higher-time frame candles.
Historical lookback is visually limited based on the number of candles TradingView provides on the chosen timeframe.
The script calculates the buy/sell pressure on the timeframe chosen, and aggregates volume up to the higher timeframe of choice (default: 4hr).
The volume for each candle is then normalized to assess how many standard deviations away from the mean it is. The color gradient on the chart is stronger for readings with more extreme z-scores.
Readings which are less than 2-standard deviations from the mean are not colored (white) - making it easier to visualize where the extremities of volume occur only.
Recommend using on default settings, on the 5-min of 15-min chart. Then hide the normal price data by clicking the "eye" symbol.
If you want to visualize historic periods, you can change the lookback settings.
Candle Overlay and Change From Open PercentCandle Overlay and Change from Open Percentage
This script is free for all to use was designed to be non-cluttering for those who like their charts clean. This script features two things:
1) An option to allow a candle overlay over the existing stock/security in a charting window.
- By default, the additional candle overlay uses the same ticker you're currently looking at
- By default, the chart resolution for the additional candle overlay uses the same chart resolution as the current charting window you're using
- Please note that if you enable an additional candle overlay for a stock/security that has a wider gap in the stock price between the two different stock/securities, the additional candle overlay may not be visible, due to the big variances in stock price (unless you zoom out to get both charts to fit).
- The benefit to having this feature, is the ability to use a line chart as the primary and the candle chart as the secondary (each overlaying another)
2) An information window showing the percentage change from the market open
- If the market is not currently open, you will see a message, which reads "MARKET CLOSED" and underneath it, the stock/security price from the prior trading day
- If the market is open, you will see a couple of things:
a) The information window will either be green or red and geared towards mostly day traders. This color is based on whether the current price is above or below the market open price. The default color if the current price is at or above market open price is green and the default color if the current price is below the market open price is red. Although, not always the case, you can generally assume if the stock price is above the market open price that the overall trend is generally bullish (but again, not always the case, as there's other varying factors that come into play).
b) There's two lines displayed on the information window and these information automatically changes depending on the color of the information window.
c) The first line that starts with a star symbol begins with the current percentage change/move from the market open price and the secondary number on the same line is either the absolute highest (or lowest) percentage change uncovered during the current trading day. If the information window is green, this percentage number is the highest percentage uncovered. If the information window is red, this percentage number is the lowest percentage uncovered. Please note that nobody knows the absolute highest and lowest price of any particular stock on any particular day; therefore, sometimes the only way to have a better sense of what the absolute highest (or lowest) percentage possible on a stock/security is when the day progresses into power hour and into the market close.
d) The second line that starts with either an UP and DOWN arrow indicates the estimated projected max percentage (again depending on whether the information window is green or red). Please note that this feature is completely experimental and subject to future code changes. If the information window is green, this percentage number guesses what the max percentage change the stock price will go up to. If the information window is red, this percentage number guesses what the max percentage change the stock price will go down to.
e) Please note that the second line which provides the estimated max percentage (either up to down) should not be used as an indicator for your trading, but rather just for entertainment. The estimated percentage max change can auto-adjust itself throughout the day. Stock news, unexpected high trading volume, etc... can cause a stock/security price to exceed (or shortfall) this estimated max percentage.
* Please note that this script is in its early beta stage and there could be bugs. This is being provided as is and the information provided by this script is meant for informational/entertainment purposes only.

Equivolume - volume as candle widthDo price action and volume really need to be on separate graphs? Why not display them both on a single graph and reduce the clutter? Presenting Equivolume candles here on TradingView - inspired by the NinjaTrader implementation
This indicator allows you to view traditional OHLC candles but with the additional ability to see relative volume through variations of width and/or transparency
Explanation
- Wide and/or full colour candles have the highest volume
- Thin and/or highly transparent candles have the lowest volume
- The following diagram shows the Equivolume indicator as well as a traditional volume graph along the bottom. You can see that when the volume is highest, the candle is widest and also the most intense color.
- The `Lookback candle count` user parameter specifies the number of candles to use in order to locate the highest volume within that range. All other candle widths in the range will be adjusted relative to this highest volume
Tips
- Toggle off the visibility of the original graph for the instrument to get the best view of the candles when using variable transparency
Gotchas
- Due to a Pine Script limitation a maximum of 500 variable width candles can be drawn on the chart
- If `Lookback candle count` is higher than the total number of available candles for the instrument, then the indicator will fail and not display anything. I’m still investigating how to handle this case better
- Be aware if you are using the `High` setting for the `Transparency range` parameter, candles with the lowest volume will be virtually invisible

Master CandleMaster Candle
Definition
A master candle can only exist when 4 consecutive candles after it consolidate within the candle’s range (high and low). Basically, a master candle should engulf the 4 following candles
Common Belief
Literature suggests it be used as a breakout strategy. When a master candle is formed, they assume the 5th,6th or 7th candle are the candidates for a potential breakout.
If the there is no breakout after the 7th candle, the master candle should be disregarded. There are many scenarios where it does work, but just as many when they don’t.
Interpretation
The idea of the master candle does hold some significance, but I see the break of the master candle as a sign of a potential continuation, retracement, or reversal.
The indicator
I have kept the original theory as default (minimum criteria which is MC=C1234+B123) but have allowed the option to edit the parameters.
Another option I’ve added is to allow wicks to breach the Master Candle as long as they open and close within its range. The only time the range is broken (5th candle onwards) is when a candle body closes above or below the master candle range.
Since I did not want to define the break as a breakout, I’ve named it a ‘Swish’. So, it’s either a Swish High or a Swish Low. Traders should make their own judgement on the intended direction based on their own analysis. A retracement entry into the intended direction is all I can advise.
Examples:

Heikin Ashi CandlesLibrary "heikin_ashi_candles"
This library is programmed to calculate the Heikin Ashi candles using the standard formula of Heikin Ashi Candles.
Notice the Heikin Ashi chart type isn't 100% like the results from this calculation.
You can import this library in your code to use it as a smoothing method for your strategy which operates on the standard chart type.
_close()
_open()
_high()
_low()
_ohlc4()
_hlcc4()
_hlc3()
_hl2()

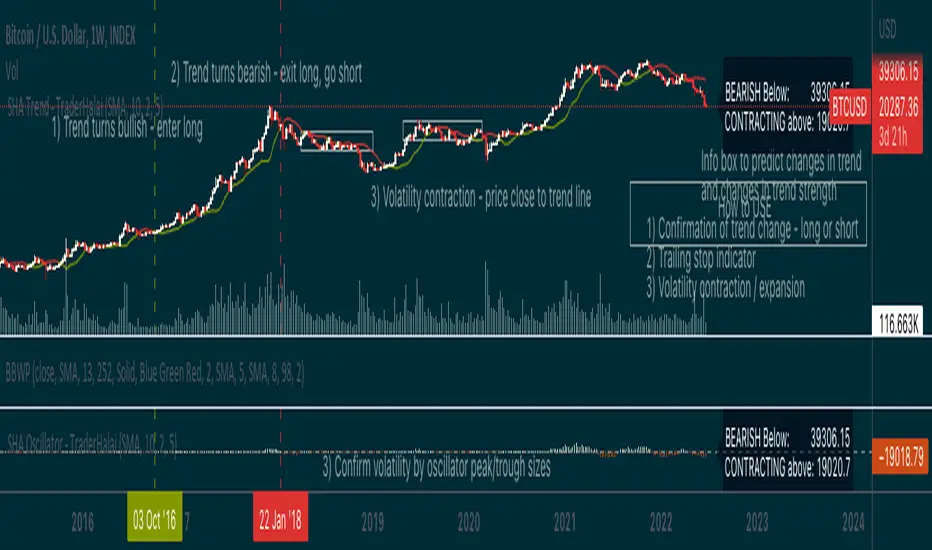
Smoothed Heikin Ashi Trend on Chart - TraderHalaiThis indicator is a predictive tool using Heikinashi to calculate shifts in trade direction.
It works by reverse-engineering the regular candle stick closing price required, to flip the Heiken Ashi candle from Red to Green and vice-versa.
Below, is an earlier indicator that I released and created. This plots this price as an oscillator, which allows traders to get a predictive indicator of a trend change.
This indicator extends upon this functionality by adding a smoothing function to the reverse-engineered regular candle stick closing price, to reduce the choppiness of signals. It also plots the indicator on the chart to allow for easier visual confirmation.
How to use
1) As a directional bias - Bullish or bearish
2) Volatility expansion/contraction - further distance from line means volatility expansion - am planning to release an oscillator version also
3) Trailing stop loss - once you are in a trade
Other Features
Select a moving average period and smoothing calculation method (e.g. SMA / EMA)
Non-repaint mode for backtesting and use/integration with higher timeframes
Final note - Open Source
I am releasing this as open-source for the benefit of the community and to allow further development, scrutiny and criticism. Please feel free to use this indicator as you see fit. If you do use this indicator to create another script, feel free to drop me a note, as I would be highly interested in your idea.
Thanks, and Enjoy!
Intrabar Polarity DivergencesTradingview Pinescript just introduced a new exciting ability to get intrabars candle information from a higher time frame chart!
This indicator is based on Tradingview example but with enhanced capabilities to show the percentage of intrabars opposite bars with the ability to display the mid-day candle close price drawn by a blue line.
This indicator can show you that in some cases a GREEN candle on the daily chart, for example, can have more red candles in a lower time frame. which may or may not indicate on a change of direction :)
This is an ongoing experiment and I plan to release more indicators based on these new pinescript capabilities.
Like if you like and Follow to stay updated!

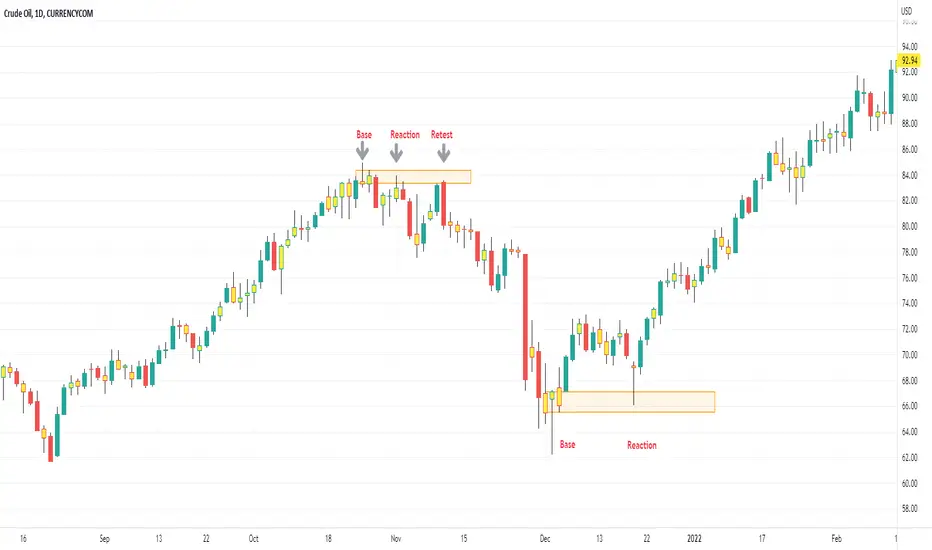
Base Candle NewBase / Imbalance Candle
It automatically highlights the candle color to yellow (default) where there is imbalance between buyers and sellers or in other words, a base or fight between buyers and sellers. When you identify this base candle, you can mark the demand and supply zones easily.
[_ParkF]HeikinAshi
In the Input menu, the default value of Location is 1, and HeikinAshi can be seen overlapping the candle.
If you modify the Location value, you can overlay it separately with candle to compare.
(In this case, the HeikinAshi value is different from the actual value, so it is recommended to use it to identify the trend.)
Also, if you move HeikinAshi to a new pane, you can use it as an auxiliary indicator at the bottom.
--------------------------------------------------------------------------------------------------------------------------------------------------------------------------------------------------
Input 메뉴에서 Location의 기본값은 1이며, 헤이킨아시를 캔들과 겹쳐서 볼 수 있게 되어 있습니다.
Location 값을 수정하면 캔들과 따로 overlay 시켜 비교할 수 있습니다.
(이 경우 헤이킨아시의 값은 실제값과 다르니 추세 파악을 위해 사용하시길 권장합니다.)
또, 헤이킨아시를 새 페인으로 옮기면 하단의 보조지표처럼 사용할 수 있습니다.

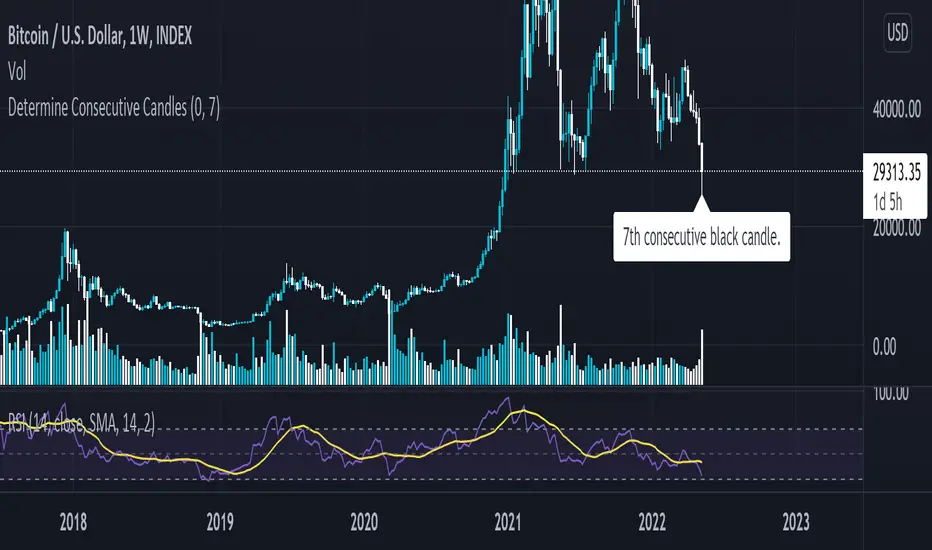
Determine Consecutive Candles█ OVERVIEW
This is a simple script that will plot labels over or under candles to show where there had been consecutive candles that closed in a similar fashion. This script was inspired by a Tweet about Bitcoin experiencing its first 7th-consecutive weekly black candle and I sought out to test that.
█ INPUTS
There are three inputs for this script.
"offset" ( integer ) - (Can be 0 or 1) Allows the user to apply this script at the currently closing candle or the most recently closed candle.
"Number of Candles" ( integer ) - (From 3 to 100*) Allows the user to select how many candles to back test for consecutive-ness.
"Black or White" ( boolean ) - Allows the user to select what kinds of candles to look for in this script. (true - Black , false - White ).
*Publishing open-sourced, this selection was arbitrary and can be modified at will.
█ USAGE
Because I had created this in a little over an hour, this is just a simple experiment that I wanted to share with others. Its applications are unknown to me, but I am interested in hearing how others may find what this script does useful.