First 5-Minute ORB Levels with Hour Offset### Indicator Overview: First 5-Minute ORB Levels with Hour Offset
This indicator is designed for traders who want to track the high and low of the first 5-minute candle of a trading session, specifically starting at 9:30 am EST (New York time) by default. The lines representing these levels, known as the "Opening Range Breakout" (ORB) levels, are extended across the trading session until the market close at 4:00 pm EST. The indicator provides the following features:
1. **Real-Time Updates**:
- As the first 5-minute candle of the session forms (from 9:30 am to 9:35 am EST), the indicator dynamically updates the high and low lines.
- After the candle completes, the lines are locked in place and extend horizontally across the chart until market close.
2. **Customizable Hour Offset**:
- Users can adjust the start time of the session by specifying an hour offset. This feature is particularly useful for traders operating in different time zones or those who want to analyze custom session times.
- For example, if you trade in a time zone where the session starts at 8:30 am local time instead of 9:30 am EST, you can set the hour offset to `-1` to adjust the start time accordingly.
3. **Visual Labels**:
- The indicator places labels at the end of the lines, clearly marking the "5m ORB High" and "5m ORB Low" levels. These labels are updated in real-time as the first 5-minute candle forms and are fixed in place once the candle closes.
### How to Adjust the Settings:
1. **Hour Offset**:
- **Description**: The hour offset allows you to shift the start time of the session. The default start time is 9:30 am EST, but you can change this using the hour offset.
- **How to Adjust**:
- Open the indicator settings.
- Locate the "Hour Offset" field.
- Enter a positive or negative integer value to shift the session start time.
- **Example**:
- `0` (default): Start at 9:30 am EST.
- `-1`: Start at 8:30 am EST.
- `+1`: Start at 10:30 am EST.
- The indicator will then track the first 5-minute candle starting at the adjusted time and plot the high and low accordingly.
2. **Line and Label Appearance**:
- The lines representing the ORB levels are green by default, and the labels are also green with white text for clear visibility on the chart. The labels are positioned to the right of the lines to avoid cluttering the chart.
### Use Cases:
- **Opening Range Breakout Strategy**: Traders often use the ORB strategy to identify potential breakout points during the trading day. By marking the high and low of the first 5-minute candle, this indicator helps traders quickly identify key levels where price might break out or reverse.
- **Custom Session Analysis**: If you trade in a different time zone or need to analyze a different session (e.g., pre-market or after-hours), the hour offset feature allows you to adapt the indicator to your needs.
This indicator is particularly valuable for intraday traders who rely on the initial volatility of the trading session to make informed decisions.
K線分析

Multi-Asset Cross Timeframe Divergence Ind. (MACDI) // AlgoFyreThe Multi-Asset Cross Timeframe Divergence Indicator (MACDI) identifies divergences in momentum like RSI across multiple assets and timeframes. It visually highlights lagging correlated asset momentum divergences, helping traders spot inefficiencies and potential trade opportunities in the following asset.
🔶 KEY FEATURES
🔸Average Momentum Trendline for Each Timeframe
The Average Momentum Trendline feature calculates the average momentum of multiple assets over specified timeframes. It uses smoothed values to determine the momentum trend for each timeframe on the average aggregated momentum of both assets. This trendline helps traders identify the overall direction of the market momentum, providing a clearer picture of potential price movements.
🔸Real-time Divergence Indication and Alert Table
The Real-time Divergence Indications and Alert Table feature visualizes detected divergences between the momentum values of the two assets across different timeframes. It identifies both bullish and bearish divergences, signaling lagging reversals in the the following asset and potential trading opportunities. When a divergence is detected, the system generates real-time visual indications on the chart and in an overview table for traders to act promptly. The alert table provides a comprehensive overview of all detected divergences, making it easier for traders to monitor and respond to market changes.
🔸Color and Size Based Labels on Price Chart based on Divergence Type
The Color and Size Based Labels feature visually represents divergences directly on the price chart. Bullish and bearish divergences are marked with distinct colors and sizes, making them easily identifiable at a glance. Larger labels indicate higher timeframes and thus generally more significance.
🔶 INSTRUCTION GUIDELINES
🔸Identify Divergence Clusters
The more divergences align, the higher the probability of a potential trend reversal in the asset. When multiple multi-timeframe divergences occur in both lower and higher timeframes within a local cluster, the probability of a reversal increases. This is valid for both for bullish and bearish divergences.
🔸Spot Low Probability Divergences
To further increase the probability, analyze the current state of the average momentum trendline. For a bullish reversal, a relatively low level of the average momentum trendline is preferred, whereas for a bearish reversal, a relatively high level is preferred.
🔶 INDIVIDUAL CONFIGURATION
🔸Leading Asset
This input allows the user to select the leading asset for the divergence analysis.
🔸Following Asset
This input allows the user to select the following asset for the divergence analysis.
🔸Higher Timeframe
This input sets the higher timeframe for the analysis.
🔸Lower Timeframe
This input sets the lower timeframe for the analysis.
🔸Show RSI Divergence
This input enables or disables the display of RSI divergence signals.
🔸RSI Length
This input sets the length of the RSI calculation.
🔸RSI Source
This input sets the source data for the RSI calculation (e.g., close price).
🔸RSI Smoothing Length
This input sets the length of the smoothing applied to the RSI values.
🔸Smoothing Method
This input sets the method used for smoothing the RSI values.
🔶 CONCLUSION
The Multi-Asset Cross Timeframe Divergence Indicator (MACDI) is a powerful tool for identifying momentum divergences across multiple assets and timeframes. Its visual cues and customizable table make it easy to use and interpret, providing valuable insights for trading decisions.

[ROC3] Rate of Change Candle ColorROC is a statistical indicator which tracks how much a security's price has changed over a certain period, showing whether momentum is picking up or slowing down. It’s a handy tool because it helps traders spot trend changes and understand how strong a trend is.
My ROC3 indicator will color the candlesticks based on the Rate of Change (ROC) and its Exponential Moving Average (EMA). This indicator helps traders visually identify bullish and bearish trends by applying color to the candles, making it easier to spot momentum shifts and trend changes.
How It Works:
Rate of Change (ROC): Calculates the percentage change in the price over a specified number of bars. This indicator measures the speed at which price changes.
EMA of ROC: Applies an Exponential Moving Average to the ROC values to provide a smoothed benchmark. The EMA helps to reduce noise and make trend identification more reliable.
Coloring Logic:
Bullish Candles (Green): When the current ROC is higher than the EMA of the ROC.
Bearish Candles (Red): When the current ROC is lower than the EMA of the ROC.
Settings:
ROC Length (Default: 60): The number of bars used to calculate the Rate of Change. Adjust this parameter to change the sensitivity of the ROC calculation.
ROC EMA Length (Default: 7): The number of bars used to calculate the Exponential Moving Average of the ROC. This length determines how smooth the EMA is. A shorter length reacts faster to price changes, while a longer length provides a smoother, slower response.
How to Use:
Apply the Indicator: Add the Rate of Change Candle Color indicator to your TradingView chart.
Interpret the Colors:
Green Candles: Indicate bullish momentum. The current ROC is greater than its EMA, suggesting upward pressure.
Red Candles: Indicate bearish momentum. The current ROC is less than its EMA, suggesting downward pressure.
Adjust Settings: Customize the ROC Length and ROC EMA Length based on your trading strategy. Shorter ROC lengths may capture more short-term trends, while longer lengths provide a broader view.
Combine with Other Indicators: Use the in conjunction with other technical indicators or chart patterns to enhance your trading analysis.
Example Use Case:
Trend Confirmation: Use the color changes to confirm bullish or bearish trends. Green candles can confirm uptrends, while red candles may signal downtrends or potential reversals.
Momentum Analysis: Monitor how frequently the ROC crosses above or below its EMA to gauge momentum strength and make informed trading decisions.
Note:
This indicator is designed to assist with trend analysis and should be used as part of a broader trading strategy. Always conduct your own research and analysis before making trading decisions.
Cherio...

[DarkTrader] 3 Candle EG ZoneThe 3 Candle EG Zone indicator identifies engulfing patterns and plots dynamic boxes around these zones. The engulfing patterns are key reversal signals where one candle's body completely engulfs the body of the previous candle, indicating a shift in market sentiment. This indicator identifies both bullish and bearish engulfing patterns and draws visual boxes around them, which extend to the right on the chart to show how the zones evolve over time.
EG Calculation by @moamenmostafa Script.
Indicator In Use :
Customization Parameters :
Max EG Box Showing: Defines the maximum number of engulfing (EG) boxes that can be displayed on the chart simultaneously. This helps to limit chart clutter by ensuring that only a specified number of zones are visible.
Pivot EG Box Offset: Sets how far to extend the engulfing box to the right from the current candle. This makes the box continue into future price action, highlighting the significance of the engulfing zone.
Zone Color: Customizes the color and transparency of the engulfing zone box, allowing users to set their preferred color to differentiate bullish and bearish zones.
Bullish Engulfing (Bullish EG):
The code checks if the last three candles have been bearish (open higher than close), and then the current candle is bullish (close higher than open) with a strong upward move. Additionally, the bullish candle must engulf the previous bearish candle, indicating a potential upward reversal. If this condition is true, a box is drawn around the low and high of the last candle.
Bearish Engulfing (Bearish EG):
Similarly, the code checks for three consecutive bullish candles (open lower than close), followed by a bearish candle (open higher than close) that engulfs the previous bullish candle. This signifies a possible downward reversal, and a box is drawn around the last candle's range.
The script continuously checks for bullish or bearish engulfing patterns and dynamically draws boxes around those zones. The boxes remain visible as long as the price stays within the engulfing zone's range. If the price exceeds the zone, the box is deleted, ensuring that only valid and current zones are shown on the chart.

APB candle(Average Price Bar)
APB Candle (Average Price Bar) with Heikin Ashi and Default Candle ON/OFF Control
Description (日本語解説は下記):
The APB Candle (Average Price Bar) provides a smoother and clearer visualization of market trends compared to standard candlesticks or Heikin Ashi. Unlike regular candlesticks, which display raw price data, APB candles calculate the average of open, high, low, and close prices, effectively filtering out short-term noise and minor fluctuations. This allows traders to focus on overall trends rather than being distracted by small, unpredictable price movements.
Why APB is superior:
・Better Trend Identification: APB candles smooth price data more effectively than standard candlesticks, making it easier to spot sustained trends.
・Reduced Market Noise: While Heikin Ashi also filters noise, APB provides a clearer view of actual price averages, offering a better balance between smoothing and staying close to the real price.
・Clear Entry and Exit Signals: By smoothing out minor fluctuations, APB candles can provide clearer signals for entering and exiting trades, particularly in volatile markets.
Key Features:
1.APB Candle ON/OFF: Display smoothed average price bars that filter out minor fluctuations, making trends clearer.
2.Heikin Ashi Candle ON/OFF: Remove market noise and visualize smoother trends using Heikin Ashi candles.
3.Default Candle ON/OFF: Compare APB and Heikin Ashi candles with the standard TradingView candles.
4.Customizable Colors: Personalize the colors of bullish and bearish candles, including the body, wick, and border.
5.Color Shift Threshold: Adjust the transparency of APB candles based on a user-defined threshold for smaller body sizes.
6.Countdown Timer: See how much time remains before the next candle forms, with customizable size, position, and color.
Trading Strategy:
・Trend Following with APB: Use APB candles to identify smoother trends by filtering out minor price fluctuations. This can be useful for trend-following strategies in volatile markets.
・Heikin Ashi for Reversals: Heikin Ashi candles help to smooth out trends, making it easier to spot potential reversals. When switching from red to green (or vice versa), it could signal a change in direction.
・Compare APB, Heikin Ashi, and Default Candles: For confirmation, compare APB and Heikin Ashi signals with default candlesticks to ensure reliability before entering a trade.
Benefits:
・Customizable Visualization: You can quickly switch between different candle types, depending on your strategy, without changing your chart setup.
・Clear Trend Identification: APB and Heikin Ashi candles help filter out noise, making it easier to see trends and reversals.
・Multiple Timeframes: Works well on multiple timeframes, allowing for flexible trading strategies.
Drawbacks:
・Smoothing May Hide Important Details: While APB and Heikin Ashi smooth price action, they might obscure key price points or signals on smaller timeframes.
・Potential Over-Reliance on Visuals: Relying too much on smoothed candles might cause traders to miss underlying market conditions or important price levels visible in traditional candlesticks.
APBキャンドル(平均価格バー)とヘイキンアシ、デフォルトローソク足のON/OFF制御
説明:
**APBキャンドル(平均価格バー)**は、標準のローソク足やヘイキンアシに比べ、よりスムーズで明確なトレンドの視覚化を提供します。通常のローソク足が生データをそのまま表示するのに対し、APBキャンドルはオープン、高値、安値、終値の平均を計算してノイズを除去し、小さな価格変動をフィルタリングします。これにより、短期的なノイズに惑わされることなく、全体的なトレンドに集中することが可能です。
APBが優れている理由:
・トレンドの把握が容易: APBキャンドルは標準のローソク足よりも価格データを滑らかにし、持続的なトレンドを見つけやすくします。
・市場ノイズの削減: ヘイキンアシもノイズをフィルタリングしますが、APBは実際の価格平均に基づいており、スムージングと実際の価格データのバランスが優れています。
・エントリー・エグジットの明確化: 小さな変動を滑らかにすることで、特にボラティリティの高い市場でのエントリー・エグジットシグナルが明確になります。
主な機能:
1.APBキャンドルのON/OFF: 小さな価格変動をフィルタリングし、トレンドを明確に表示します。
2.ヘイキンアシキャンドルのON/OFF: ノイズを取り除き、スムーズなトレンドを視覚化します。
3.デフォルトローソク足のON/OFF: 標準のローソク足との比較を容易にし、戦略に応じて使用可能です。
4.色のカスタマイズ: 上昇時と下降時のローソク足の色を自由に設定可能。
色変化のしきい値設定: APBキャンドルのボディサイズが小さい場合に色を薄くするしきい値を設定できます。
5.カウントダウンタイマー: 各ローソク足の下に、次のローソク足が形成されるまでの残り時間を表示します。
トレード戦略:
・APBでのトレンドフォロー: APBキャンドルを使って、スムーズなトレンドを確認し、ボラティリティの高い市場でトレンドフォロー戦略を取る。
・ヘイキンアシでの反転シグナル確認: ヘイキンアシを使い、上昇(緑)から下降(赤)への色変化を反転シグナルとして利用。
・3種類のローソク足の比較: APB、ヘイキンアシ、デフォルトローソク足を比較し、トレンドや反転の信頼性を確認してからエントリーする。
メリット:
・カスタマイズ性が高い: 戦略に応じて3種類のローソク足を自由に切り替え可能。
・トレンドの把握が容易: ノイズを除去してトレンドや反転を明確に把握できる。
・複数タイムフレームで効果的: 複数のタイムフレームで利用可能なため、柔軟な戦略が立てられる。
デメリット:
・重要な情報の隠蔽の可能性: APBやヘイキンアシのスムージングにより、小さな価格変動や重要な価格ポイントが隠れる可能性がある。
・視覚的な判断に依存しすぎるリスク: スムーズなローソク足に頼りすぎることで、標準的なローソク足で確認できる重要な情報を見逃す可能性があります。
注意書き:
1.インジケーターの突然の変更や削除の可能性: このインジケーターは今後予告なく変更や削除される場合がありますのでご注意ください。
2.損失の責任について: このインジケーターを使用したことによる損失に関して、作者は一切の責任を負いません。トレードは自己責任で行ってください。

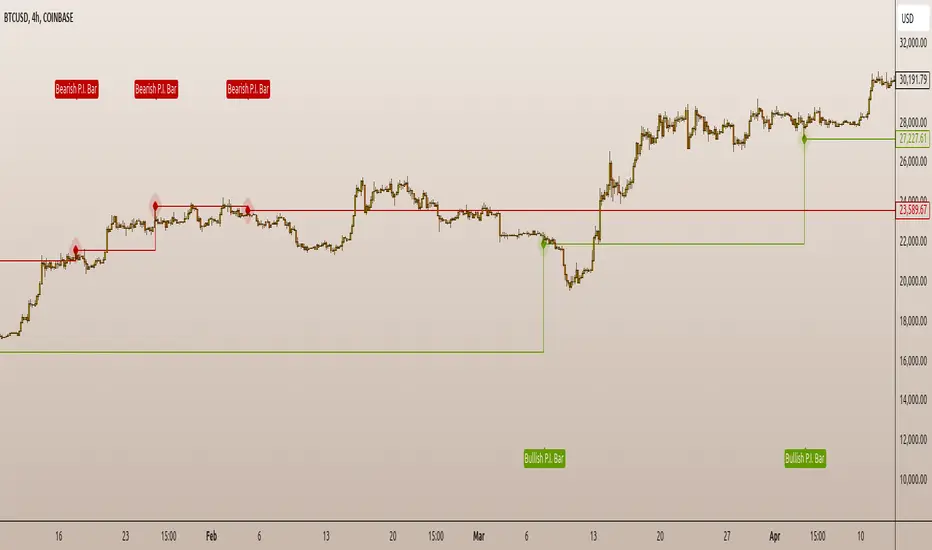
P.I.B. System (Pin Bar | Inside Bar) // AlgoFyreThe "P.I.B. System (Pin Bar | Inside Bar)" identifies bullish and bearish pin bars and inside bars on a price chart. It highlights potential market reversals by plotting labels and colorizing bars, providing traders with visual cues for better decision-making.
Description
The "P.I.B. System (Pin Bar | Inside Bar)" script is designed to help traders identify potential reversal points in the market by detecting bullish and bearish pin bars and inside bars. A pin bar is a candlestick pattern that indicates a potential reversal, characterized by a small body and a long wick. Inside bars are candlestick patterns where the current bar's high and low are within the previous bar's range, indicating potential consolidation before a breakout.
This script allows customization of various parameters to fine-tune the identification of pin bars and inside bars. When a pin bar or an inside bar is detected, the script plots a label on the chart and colorizes the bars to highlight these patterns. This tool is useful for traders looking to identify potential reversal points and make informed trading decisions.
Explanation of All Options
Pin-Wick Size Ratio Minimum Value : The minimum ratio of the wick size to the total candle size for a pin bar to be considered valid. Default is 0.66.
Candle Body Size Ratio Maximum Value : The maximum ratio of the body size to the total candle size for a pin bar to be considered valid. Default is 0.4.
Handle-Wick Wick Size Ratio Maximum Value : The maximum ratio of the opposite wick size to the total candle size for a pin bar to be considered valid. Default is 0.4.
Filter Out Small Candles : Option to filter out small candles based on the previous candle's size. Default is true.
Small Candle Size Ratio : The ratio used to determine if a candle is considered small compared to the previous candle. Default is 2.0.
Identify Inside Bars : Option to identify inside bars following a pin bar. Default is true.
Show Only P.I.B. : Option to show only the bars where a pin bar is followed by an inside bar. Default is true.
Hide Horizontal Rays : Option to hide horizontal rays drawn from the last identified pin bars. Default is false.
How to Use
To use this script, add it to your chart. Customize the input parameters to match your trading strategy. The script will automatically identify and highlight bullish and bearish pin bars and inside bars on the chart. Use the visual cues provided by the labels and colorized bars to make informed trading decisions.
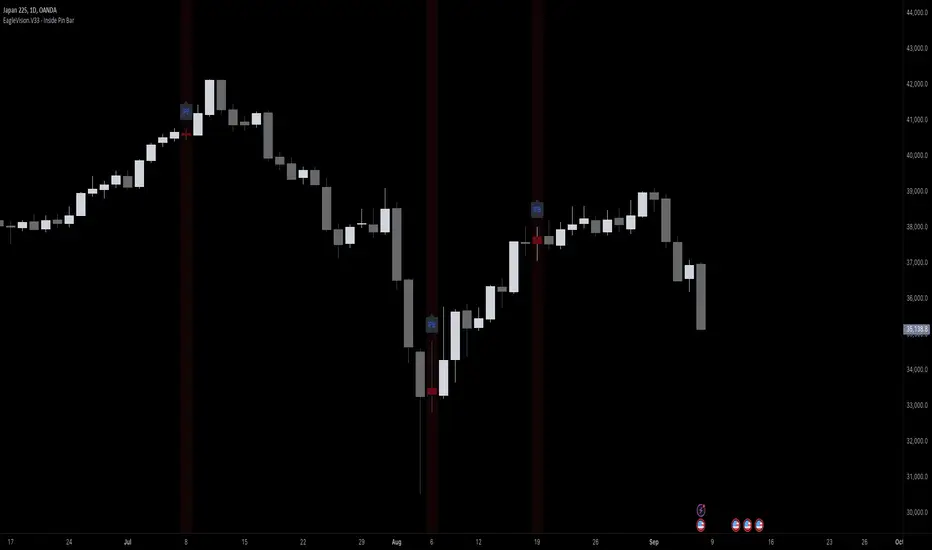
EagleVision.V33 - Inside Pin Bar EagleVision.V33 is a specialized indicator designed for traders who focus on price action. It detects and highlights the Inside Pin Bar candle pattern, a key signal that can indicate potential market reversals or trend continuations. This tool is invaluable for traders who rely on precise candlestick patterns to make data-driven decisions.
Features:
• Customizable Pattern Highlighting: EagleVision.V33 allows traders to choose custom colors to highlight Inside Pin Bar patterns directly on the chart. This makes identifying critical trading signals straightforward, even in busy market conditions.
• Pin Bar Candle Customization: Beyond just highlighting, the indicator enables users to change the color of the detected pin bar itself, ensuring that crucial patterns are immediately visible and easy to track.
• Versatile Timeframe Application: The indicator can be applied across various timeframes, from intraday (1 minute, 5 minutes) to longer-term charts (daily, weekly). Users can easily switch between timeframes within the settings, making it adaptable to different trading strategies.
• Enhanced Visual Clarity with Background Highlighting: For traders who prefer additional emphasis, EagleVision.V33 offers an option to apply a background color that highlights the entire region where the Inside Pin Bar pattern is detected.
How It Works:
• Inside Bar Identification: The indicator first identifies an Inside Bar, where a candle’s high and low fall within the range of the preceding candle (the mother bar). This is a foundational pattern in price action trading.
• Pin Bar Detection: It then checks if the candle is a Pin Bar, characterized by a small body and a prominent wick (either upper or lower), which typically signals potential market turning points.
• Pattern Highlighting & Visualization: Upon detecting both conditions (Inside Bar and Pin Bar), EagleVision.V33 highlights the pattern using customizable shapes and colors, and optionally applies a background shade to further enhance visibility.
Use Cases:
• Reversals at Key Levels: The Inside Pin Bar pattern often appears at significant support or resistance levels, signaling potential reversals. EagleVision.V33 helps traders spot these opportunities early.
• Trend Continuations: In trending markets, this pattern can confirm the continuation of a trend, providing traders with the confidence to hold positions or enter new ones.
Customization Options:
• Pattern Highlight Color: Choose a distinct color for the label or shape that marks the Inside Pin Bar pattern, making it stand out against other chart elements.
• Pin Bar Candle Color: Customize the color of the Pin Bar itself, ensuring that it is immediately recognizable on the chart.
• Background Highlighting: Optionally apply a background color to the chart area where the pattern is detected, further enhancing visual clarity and making it easier to spot potential trading opportunities.
Why EagleVision.V33 Stands Out:
EagleVision.V33 is not just another pattern detection tool; it’s engineered for precision and clarity, with highly customizable features that cater to the unique needs of price action traders. By combining both Inside Bar and Pin Bar detection, it offers a powerful edge, providing traders with actionable insights directly on their charts.
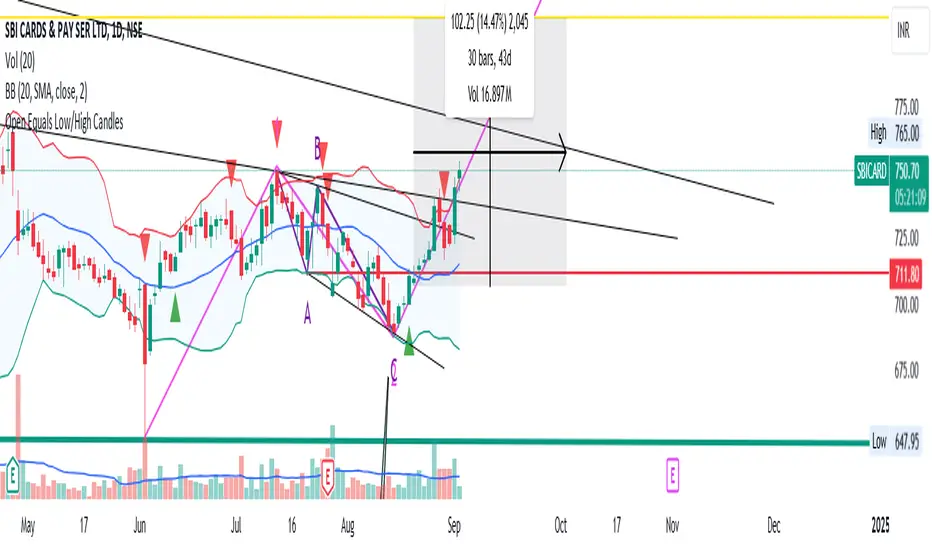
Open Equals Low/High Candles
This Indicator basically helps us to get the candles where Open = Low & Open =High.
Significance:
1) Open = Low Candles
----> Such candles are very powerful, as the Open = Low marks that there aren't any sellers left below the price on that day. Denoting BULLS power and aggression.
2) Open = High Candles
----> Open = High Candles signify that as soon as the markets opened, Bears were very strong, and no buyers left above the opening price for that candle. Denoting Strong BEARISH sentiment and aggression.
PS: This indicator can be used across all timeframes and indices. As it is purely based on Price-Action study.
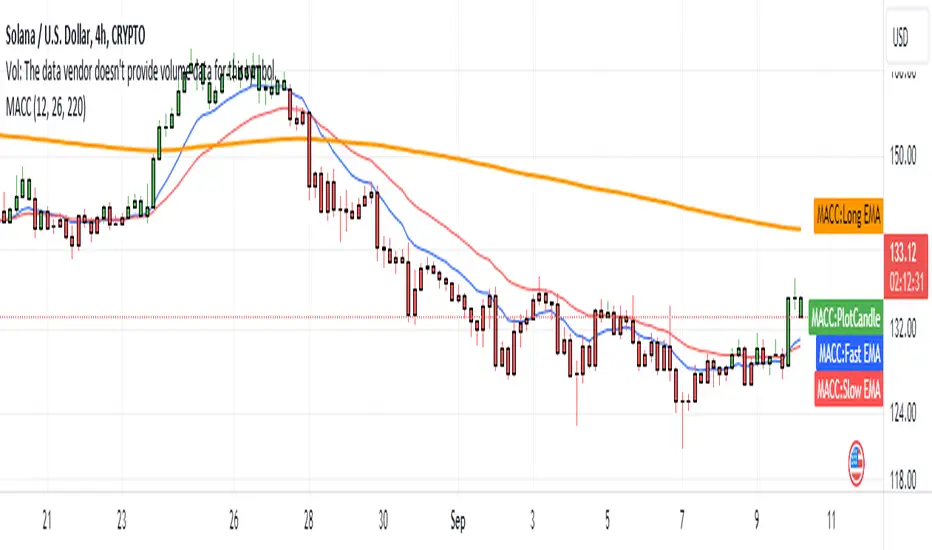
[MACC] Moving Average Candle ColorThe simplest trading framework is using moving average. This indicator is harnessing that very method.
What It Does:
This indicator helps you see market trends at a glance by changing the color of the candlesticks based on the relationship between two Exponential Moving Averages (EMAs). When the 9-period EMA is above the 21-period EMA, candlesticks turn green, suggesting a bullish trend. When the 9 EMA is below the 21 EMA, candlesticks turn red, indicating a bearish trend.
Why You'll Love It:
Easy Trend Visualization: Quickly spot trends and potential reversals with color-coded candlesticks.
Customizable Settings: Adjust the lengths of the EMAs to fit your trading style. Just change the values in the settings panel and watch the indicator update in real-time.
Optional EMA Lines: See the EMA lines plotted on your chart for added context and trend confirmation.
How to Use It:
Green Candlesticks: It’s a sign that the trend is likely upward.
Red Candlesticks: signaling a potential downward trend.
Customization:
EMA Lengths: You can set the lengths for the 9 EMA and 21 EMA to whatever fits your trading strategy best.
Colors: Adjust the colors if you want to match your chart’s theme.
Get Started: Add this indicator to your TradingView chart and tweak the settings to see how it helps you track market trends more effectively.
Cherio...
Custom Opening Price Levels (PO3)This indicator is designed to assist the trader in identifying the Power of Three through the opens of the candles.
-------------------------
The PO3 is a concept introduced by ICT. First, you need to have a directional bias for the month or the specific candle in question. It should be of high time frame (HTF BIAS).
At the open of the specific candle, the market will generate interest in the direction opposite to the HTF BIAS, accumulating positions. It will then manipulate the positions of less informed traders to generate the necessary liquidity to fill informed operators positions.
Finally, positions are distributed in favor of the bias.
-------------------------
The PO3 is a phenomenon that repeats across all timeframes. This indicator is highly customizable and allows the user to choose from a range of timeframes: 3 months, 1 month, 1 week, 1 day, and 3 hours. The indicator displays the last 3 opens for the selected period.
-------------------------
The script is open-source, so feel free to add more timeframes or open levels if you have coding skills.

Morning & Evening Star Pro (Candle Pattern)Hello Traders!
The Morning & Evening Star Pro indicator often catches the absolute top or bottom of a move and is a reliable reversal indicator. It also provides excellent entries in a strong trending market. For example, in an uptrend you can use a morning star as a pullback entry signal.
The indicator is an advanced tool for identifying powerful reversal patterns in the market. It combines traditional candlestick analysis with modern technical indicators to provide traders with high-probability entry and exit signals.
Key features:
Accurate pattern detection:
Utilizes sophisticated algorithms to identify genuine Morning Star and Evening Star patterns, filtering out false signals.
Trend filter:
Incorporates a customizable Simple Moving Average (SMA) to align signals with the overall market trend, enhancing trade quality.
Volatility awareness:
Integrates Average True Range (ATR) calculations to ensure detected patterns are significant relative to recent price action.
Visual clarity:
Highlights Morning Star and Evening Star patterns with customizable colors and shapes, making them easy to spot on the chart.
Flexible customization:
Offers a wide range of user inputs to tailor the indicator to various trading styles and preferences.
Filtered signal display:
Option to show filtered-out signals, providing insight into the indicator's decision-making process.
Morning Star
Is a bearish reversal (or continuation) pattern consisting of three candles:
A large bearish candle
A small-bodied candle like a Doji or Pin bar
A bullish candle
Evening Star
Is a bullish reversal (or continuation) pattern consisting of three candles:
A large bullish candle
A small-bodied candle like a Doji or Pin bar
A bearish candle
Key differences in this implementation
The middle candle can be either a Doji or a Pin bar, expanding the traditional definition.
The second candle can be a Pin bar, and the third candle can be an outside bar reversal, allowing for more flexibility in pattern recognition.
What makes this indicator unique
Comprehensive pattern analysis:
Goes beyond simple price action by considering multiple factors such as candle body ratios, wick lengths, and relative positions to previous candles.
Adaptive to market conditions:
Uses dynamic thresholds based on recent volatility (ATR) to adjust pattern detection criteria.
Educational value:
The option to display filtered signals helps traders understand why some patterns are rejected, aiding in skill development.
How to Trade with this Indicator:
This indicator often catches the absolute top or bottom of a move and is a reliable reversal indicator. It also provides excellent entries in a trending market. For example, in a strong uptrend you can use morning star signals to enter in a pullback.
Bullish Opportunities:
Look for Morning Star patterns (aqua-colored candles and labels) as potential buy signals.
Bearish Opportunities:
Watch for Evening Star patterns (orange-colored candles and labels) as potential sell signals.
Entry: At next bar open (after the aqua-colored candle for bullish or orange-colored candle for bearish completes)
Stop loss: 2 ticks below/above the pattern's low/high.
Stop loss alternative: If the colored candle is a very strong candle (e.g. for morning star a candle with almost no down wick and a close near the top) the stop goes 2 ticks below/above the colored candle.
Take profit: 3R or use a trailing stop.
Trend Alignment:
For conservative trading, only take trades in the direction of the overall trend as indicated by the SMA.
Note: if you want to see candle coloring of the morning and evening star, you must put the indicator to the top of the object tree.

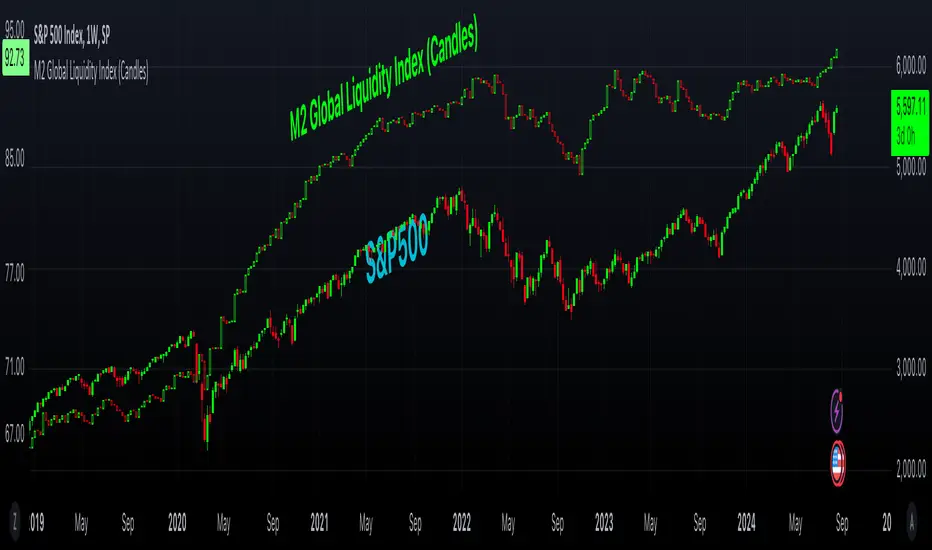
M2 Global Liquidity Index (Candles)M2 Global Liquidity Index (Candles)
In this enhanced version of the original M2 Global Liquidity Index script by Mik3Christ3ns3n , I've taken the foundational concept and expanded its capabilities for more in-depth analysis and user flexibility. This updated script aggregates M2 money supply data from major global economies—China, the U.S., the Eurozone, Japan, and the U.K.—adjusted by their respective exchange rates, into a customizable global liquidity index.
Key Enhancements:
Candlestick Visualization:
• Instead of a simple line chart, I've implemented a candlestick chart, providing a more detailed representation of liquidity trends with open, high, low, and close values for each period. This allows traders to analyze the index with the same technical tools used for price charts.
Customizable Components:
• Users can now select which components (M2 data and exchange rates) to include in the index calculation, giving you the flexibility to tailor the index to specific economic factors or regions of interest.
Dynamic Color Coding:
• Candles are color-coded based on their performance (bullish or bearish), with customized wick and border colors to enhance visual clarity, making it easier to spot liquidity trends at a glance.
Overlay Option:
• This script is designed to be an overlay, allowing you to plot the Global Liquidity Index directly on your price charts, facilitating comparison between liquidity trends and asset prices.
This enhanced script is ideal for traders and analysts who want a deeper understanding of global liquidity trends and their impact on financial markets.
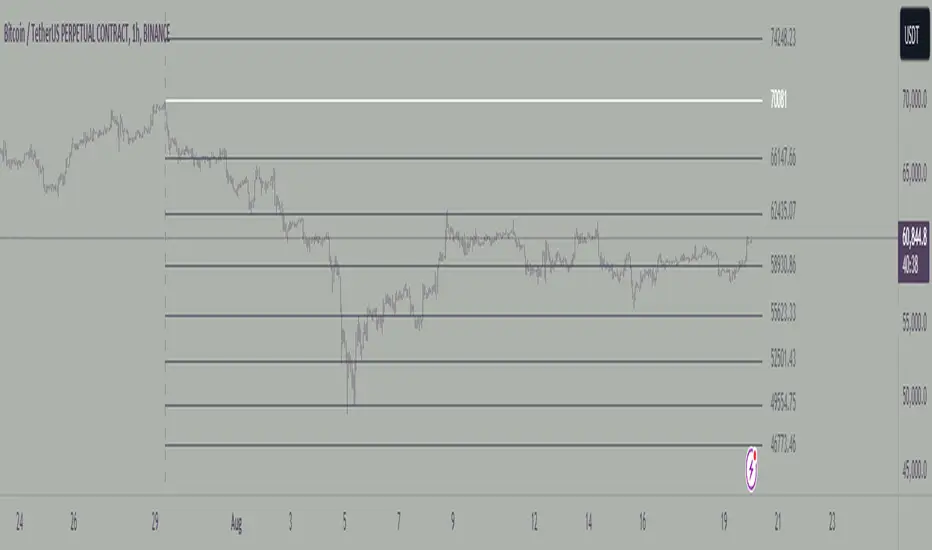
Octave Scale - AnchoredDescription
The Octave Scale indicator identifies key market levels by multiplying each price point by the twelfth root of 2 (approximately 1.05946), a concept derived from the equal tempered scale in music where each note is spaced evenly to create a consistent step up in frequency. The twelfth root of 2 is used because it represents the precise mathematical interval needed to divide an octave into 12 equal parts, ensuring a balanced progression between each level.
Inspired by the teachings of Michael S. Jenkins, this approach helps traders mark important support and resistance levels, providing a harmonically balanced perspective on market movements. By stepping through these calculated levels, traders can anticipate potential turning points in the market, whether assessing retracement zones or projecting future price targets. The Octave Scale indicator integrates ancient harmonic principles offering a unique tool for understanding and navigating market dynamics.
How to use
Anchor significant highs or lows and edit the source in settings to reflect the swing.
Indicator in use
OHLC, Sessions & Key Levels [Orderflowing]Multi-Timeframe (+) OHLC, Sessions & Key Levels | Custom-Timeframe OHLC | Sessions Analysis | Market Key Levels
Built using Pine Script V5.
Introduction
The OHLC, Sessions & Key Levels Indicator is a tool designed for traders who want to integrate Multi-Timeframe (MTF) OHLC Data, Sessions Analysis, and Key Market Levels into their trading system.
This Indicator can help traders by automatically marking the OHLC, Sessions & Key Levels directly on the price chart, saving time furthermore potentially allowing for better judgement in their trading and risk management process.
Innovation and Inspiration
The Indicator draws from multiple concepts;
The OHLC levels across different timeframes, session-based analysis, and plotting potentially important and pivotal market levels.
Concept Inspiration from ICT-Traders / Market Maker Model Traders.
Use of Open-Source Code
Specific parts of this Indicator's code have been inspired by & further developed from publicly available code originally developed for the MetaTrader platform.
All such integrations have been wired to work within the TradingView environment, specifically using Pine Script Version 5.
Elements have been made to benefit the overall functionality, the code logic, to make sure it offers unique value to TradingView's users.
Core Features
OHLC MTF Analysis
Foundation
This component allows traders to track the Open, High, Low, and Close levels across different timeframes, ranging from intraday periods to yearly data.
Customization
Traders can adjust the bar offset, width, and colors of the OHLC bars, as well as display options. Option to highlight the Open/Close with labels and the High/Low with marks.
Application
The OHLC MTF component gives traders a clear view of important price levels, which can serve as support, resistance, or potential entry/exit points.
Main Trading Sessions & Custom Sessions
Starting Point
The Sessions component relies on the user-inputted key market sessions, defaults include New York, London, Asia, and optionally Sydney. Session Defaults to UTC.
Please Note: Adjust Time Zone in TradingView's Desktop App or Web Interface to use the sessions in correct local time.
Customization
Traders can adjust session names, session times, time zone, visibility, session colors, and session-specific high and low markers.
This allows us to visualize price movements during these selected periods.
Application
By highlighting different trading sessions, traders can potentially better time their trades, understanding when significant price movements usually occur. This can potentially be used to try and find patterns in a time-based method.
Key Levels
Customization
Traders can choose which key levels to display and adjust the visual style of these levels, including line width, style, and color.
Application
The Key Levels feature can help traders identify support and resistance levels that can serve as potential entry or exit points. Can be useful in market structure analysis by marking significant price levels based on different timeframes.
Designed for multi-timeframe analysis, allowing traders to track OHLC levels, session ranges, and key market levels.
It’s highly customizable, making it suitable across trading styles and charting setups, whether scalping, day trading, swing trading or longer term investing.
Multi-Timeframe (MTF) OHLC
Can be plotted as a Candlestick or Bar-Chart or Both
These can help traders keep an eye on price levels across multiple timeframes while allowing the actual chart to be on another timeframe than the displayed OHLC.
Example - OHLC on the Weekly Candle/Bar - Chart 4 Hourly Candles
While being on lower timeframes, the trader can keep an eye on how the OHLC candle is developing. ICT-Traders find the Daily (Default Setting) OHLC useful in analysis.
It can be customized to any timeframe the trader wishes to use.
Inspired by ICT-Traders / Market Maker Model Traders and Top-Down Analysis Style.
Combined with Session Analysis to view into the price behavior during specific trading sessions, could potentially be very useful for finding trading setups.
OHLC Levels
Creates lines based on user input - Can potentially be important reference points for trade setups / invalidation / confirmation, levels could be used as the HTF Origin.
Conclusion
The OHLC MTF, Sessions & Key Levels Indicator is a tool that combines multiple market analysis concepts into a single unique script. It offers another view of the market's behavior by combining OHLC data from a different timeframe, main trading sessions, and key levels.
Why Invite-Only?
The OHLC, Sessions & Key Levels Indicator is offered as invite-only because you receive a quality and customizable tool that combines multiple functions into one convenient script.
This Indicator stands out by being a complete and optimized trading tool based on three desirable components.
—
Multi-Timeframe OHLC Analysis, Sessions Tracking & Key Levels
—
Into One Customizable Indicator.
Disclaimer
While the Indicator offers a view of the OHLC price action on multiple timeframes, key levels & trading sessions, traders should not solely rely on it for trading decisions. As with all trading tools, it should be used as part of a complete trading strategy.

HTF Multi Candles DisplayHTF Multi Candles Display
Description
The HTF Multi Candles Display is a powerful and versatile indicator that overlays higher timeframe (HTF) candles on your current chart, providing traders with a comprehensive multi-timeframe analysis tool in a single view. This indicator is particularly valuable for traders who employ strategies that rely on higher timeframe context, such as the Power of Three strategy, Turtle Soup, Candle Range Theory (CRT), and Inner Circle Trader (ICT) concepts like Price Delivery (PD) arrays.
> **Notice**: If you find this indicator beneficial for your trading, I would greatly appreciate any contribution in the form of TradingView Coins. Thank you for your support!
Key Features
1. Displays up to 5 higher timeframe candles
2. Customizable higher timeframe selection (5m to Monthly)
3. Adjustable candle appearance (colors, wicks, width)
4. Time labels for easy reference
5. Optional vertical lines to separate HTF candles
6. Offset adjustment to position candles away from the chart edge
7. Customizable wick and border colors
8. Flexible vertical line styles (solid, dashed, dotted)
9. Adjustable time label font sizes
How it Helps Traders
### 1. Multi-timeframe Analysis
By overlaying higher timeframe candles on your current chart, this indicator allows you to easily identify key levels, trends, and potential reversal points across different timeframes without switching between multiple charts.
### 2. Power of Three Strategy
This indicator is invaluable for traders using the Inner Circle Trader (ICT) Power of Three strategy, which focuses on accumulation, manipulation, and distribution phases. The higher timeframe candles help identify these phases more accurately, allowing for better trade entries and exits:
- Accumulation: Identify periods of sideways price action on higher timeframes.
- Manipulation: Spot false breakouts or breakdowns on lower timeframes that are contained within higher timeframe ranges.
- Distribution: Recognize when price is approaching significant higher timeframe levels where smart money may begin to distribute.
### 3. Turtle Soup
Traders can use this indicator to spot potential Turtle Soup setups by identifying key breakout levels on higher timeframes and comparing them to current price action. This helps in:
- Identifying false breakouts that may lead to Turtle Soup trade opportunities.
- Confirming the validity of breakouts by comparing lower timeframe momentum to higher timeframe structure.
### 4. Candle Range Theory (CRT)
This indicator is extremely useful for traders applying Candle Range Theory. CRT focuses on the relationship between the current candle's range and the previous candle's range. By displaying higher timeframe candles, traders can:
- Easily compare candle ranges across multiple timeframes.
- Identify potential breakout or breakdown levels based on the previous HTF candle's range.
- Spot instances where the current lower timeframe price action is testing or breaking significant HTF candle ranges.
- Recognize potential reversal points where price reaches the extremes of higher timeframe candle ranges.
### 5. Support and Resistance
Higher timeframe candles often represent significant support and resistance levels. This indicator makes it easy to spot these levels and incorporate them into your trading decisions, allowing you to:
- Identify key support and resistance levels from higher timeframes.
- Anticipate potential price reactions at these levels on your current timeframe.
- Plan entries, exits, and stop-loss placement with greater precision.
### 6. Trend Identification
By displaying multiple HTF candles, traders can quickly assess the overall trend direction on higher timeframes, helping to align trades with the broader market direction:
- Easily visualize the trend on higher timeframes without changing your chart.
- Identify potential trend changes or continuations based on HTF candle patterns.
- Align your trades with the higher timeframe trend for potentially higher probability setups.
### 7. Enhanced Decision Making
The combination of current timeframe price action and higher timeframe context allows for more informed decision-making, potentially improving trade quality and risk management:
- Validate trade setups by ensuring they align with higher timeframe structure.
- Avoid low-probability trades that conflict with higher timeframe trends or key levels.
- Adjust position sizing based on the proximity to significant HTF levels.
### 8. Time Efficiency
Instead of constantly switching between timeframes, traders can view all necessary information on a single chart, streamlining their analysis process:
- Reduce the time spent switching between multiple charts.
- Quickly assess market conditions across various timeframes.
- Improve focus by having all relevant information in one view.
### 9. ICT Price Delivery (PD) Arrays
The HTF Multi Candles Display is particularly useful for traders familiar with Inner Circle Trader (ICT) concepts, especially in identifying Price Delivery (PD) arrays:
- Visualize potential PD arrays across multiple timeframes without switching charts.
- Identify key swing highs and lows that form PD array structures.
- Recognize patterns such as Breaker Blocks, Inefficient Price Points, and Fair Value Gaps more easily on higher timeframes.
- Spot potential areas where smart money might be accumulating or distributing by analyzing the relationship between HTF candles.
- Use the series of HTF candles to identify potential Order Blocks, which are often key components of PD arrays.
- Recognize Mitigation Points and Liquidity Voids more effectively by analyzing the structure of multiple HTF candles.
By displaying a series of HTF candles, this indicator allows traders to more easily identify and validate ICT concepts like PD arrays, enhancing their ability to spot high-probability trading opportunities and potential market turning points.
Conclusion
The HTF Multi Candles Display indicator is suitable for traders of all levels, from beginners looking to understand market structure across timeframes to experienced traders refining their multi-timeframe analysis techniques. Whether you're day trading, swing trading, or looking for longer-term positions, this indicator provides valuable insights to enhance your trading strategy.
By incorporating higher timeframe context into your analysis, you can make more informed trading decisions, identify high-probability setups, and potentially improve your overall trading performance. The HTF Multi Candles Display is a versatile tool that adapts to various trading strategies and helps traders gain a deeper understanding of market dynamics across multiple timeframes, including advanced concepts like ICT Price Delivery arrays.

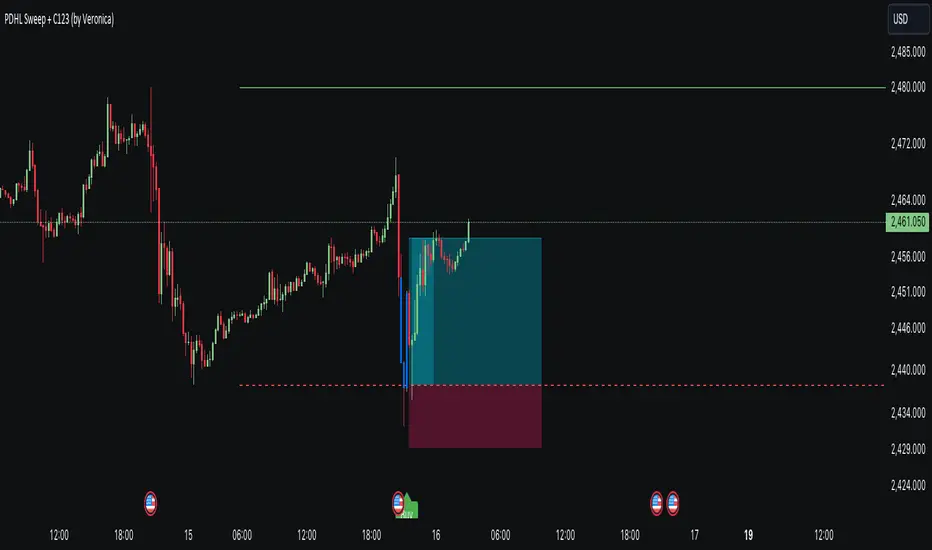
PDHL Sweep + C123 (by Veronica)The "PDHL Sweep + C123" is an indicator to identify potential reversal or continuation patterns in the market by combining key price levels from the previous day with a custom three-candle pattern analysis.
Key Features:
1. Previous Day High/Low Sweep:
The indicator automatically plots horizontal lines marking the previous day's high and low prices.
If the price crosses these key levels, the lines will change from solid to dashed, indicating a potential sweep or breakout.
2. Three-Candle Pattern Analysis:
The indicator identifies specific three-candle patterns that could signal a bullish or bearish setup. The pattern is validated if certain conditions are met, including the relationship between candle bodies and whether the price has crossed the previous day's high or low.
3. Marubozu Condition (Optional):
Users can enable a condition that checks if the Candle 1 and 3 in the pattern is a Marubozu, with a customizable body size percentage.This adds an extra layer of confirmation to the pattern. Default is switch on for both candle 1 and 3.
4. Customizable Alerts:
Users can set alerts for when a "Buy" or "Sell" signal is triggered, allowing them to stay informed of potential trading opportunities without constantly monitoring the charts.
Callout Signals:
When a valid bullish or bearish pattern is identified, the indicator places a "Buy" or "Sell" callout on the chart for clear visual signaling.
5. Customizable colour and text:
Users can customize the color and text of these callouts to suit their preferences.
How to Use:
Bullish Signal: A "Buy" callout will appear when a valid three-candle bullish pattern is detected and the price has crossed below the previous day's low.
Bearish Signal: A "Sell" callout will appear when a valid three-candle bearish pattern is detected and the price has crossed above the previous day's high.
Customize the appearance of the indicator, including line colors, callout colors, and text colors, to match your charting style.
This indicator is ideal for traders who rely on price action and key levels for their trading decisions. It provides clear signals and alerts, helping you stay on top of potential market reversals or continuations.
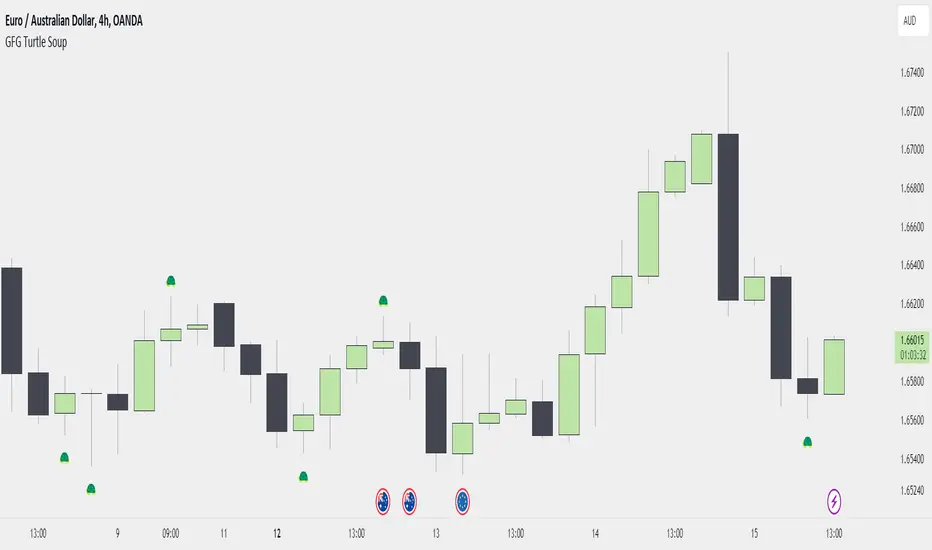
GFG Turtle SoupThe GFG Turtle Soup indicator is a custom script designed to identify potential reversal points in the market by detecting specific price patterns over a user-defined lookback period. This indicator is based on the "Turtle Soup" strategy, which aims to exploit false breakouts and generate buy or sell signals when certain conditions are met.
Key Features:
Lookback Period: The indicator examines a user-defined period (default is 5 bars) to determine the highest high or lowest low, crucial for identifying potential reversal zones.
Signal Characters: The indicator provides visual cues on the chart using customizable characters (default is a turtle emoji 🐢) to mark potential bullish or bearish setups.
Pattern Detection:
Bearish Signal: A potential sell signal is generated when the current bar makes a higher high, but the close is lower than the high of the previous bar, signaling a possible reversal after a false breakout to the upside.
Bullish Signal: A potential buy signal is generated when the current bar makes a lower low, but the close is higher than the low of the previous bar, indicating a possible reversal after a false breakout to the downside.
Visual and Alert System: The indicator not only marks the signals on the chart but also triggers alerts, allowing traders to take action promptly on lower timeframes.
This indicator is particularly useful for traders looking to identify reversal points where price may have overextended in one direction, providing opportunities to enter the market in the opposite direction.
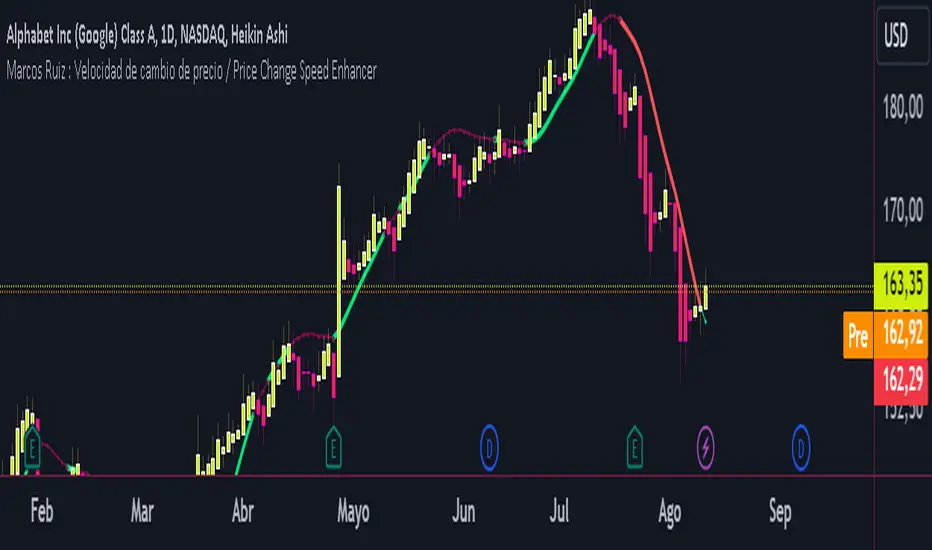
Marcos Ruiz :Price Change Speed Descripción:
Este indicador en Pine Script está diseñado para analizar y visualizar dinámicamente la velocidad de los cambios de precio en un gráfico de TradingView. El indicador permite a los usuarios seleccionar diferentes tipos de medias móviles y fuentes de precios para calcular y mostrar el cambio porcentual en el precio durante un período especificado
Características:
Selección de Fuente de Precio: Elige entre cierre, apertura, alto, o bajo para los cálculos de precios
Tipos de Media Móvil: Selecciona entre SMA, WMA, EMA, HMA, o VWMA para determinar la media móvil utilizada en el cálculo de la velocidad promedio
Coloreado Dinámico: El color de la línea de la media móvil cambia según la velocidad de cambio de precio
Aumento de Velocidad: Cuando la velocidad del cambio de precio está aumentando, la media móvil se colorea según upColor definido por el usuario
Disminución de Velocidad: Cuando la velocidad está disminuyendo, la media móvil se colorea según downColor definido por el usuario
Posición Neutral: Coloreado adicional para escenarios donde el precio está por encima o por debajo de la media móvil, pero no cumple con las condiciones de aumento/disminución
Factor de Refuerzo: Ajusta la sensibilidad del cálculo del cambio de velocidad
Uso:
Parámetros de Entrada:
Define el Período para establecer la ventana de retroceso para calcular la velocidad
Elige la Fuente de Precio para determinar qué datos de precios usar
Selecciona el Tipo de Media Móvil y ajusta la Longitud de EMA para la comparación
Interpretación:
El indicador traza la media móvil seleccionada con colores dinámicos basados en la velocidad calculada del cambio de precio
Los cambios positivos y negativos en la velocidad se indican con diferentes colores, proporcionando una representación visual del momento y la fuerza de la tendencia del precio
Nota: Este script es el resultado de un desarrollo y pruebas extensivas. Se agradecen mucho sus comentarios y contribuciones
Description:
This Pine Script indicator is designed to dynamically analyze and visualize the speed of price changes on a TradingView chart. The indicator allows users to select different moving average types and price sources to compute and display the percentage change in price over a specified period
Features:
Price Source Selection: Choose from close, open, high, or low for price calculations
Moving Average Types: Select from SMA, WMA, EMA, HMA, or VWMA to determine the moving average used for computing average speed
Dynamic Coloring: The moving average line's color changes based on the speed of price change
Increasing Speed: When the price change speed is increasing, the moving average is colored according to the user-defined upColor
Decreasing Speed: When the speed is decreasing, the moving average is colored according to the user-defined downColor
Neutral Position: Additional coloring for scenarios where the price is above or below the moving average but not meeting the increase/decrease conditions
Reinforcement Factor: Adjusts the sensitivity of the speed change calculation
Usage:
Input Parameters:
Set the Period to define the lookback window for calculating speed
Choose the Price Source to determine which price data to use
Select the Moving Average Type and adjust the EMA Length for comparison
Interpretation:
The indicator plots the selected moving average with dynamic colors based on the calculated speed of price change
Positive and negative changes in speed are indicated by different colors, providing a visual representation of price momentum and trend strength
Note: This script is the result of extensive development and testing. Your feedback and contributions are highly appreciated
TheRookAlgo ICT DRThe Rook Algo is a powerful indicator that is useful to identify the current state of the market, it give information about the current dealing range created after price takes both sides of the market as ICT teaches. The indicator give buy and sell signals depending of the market sentiment, it works in all timeframes can be used only in one but the real benefits comes when it is used with a Higher timeframe reference.
How it works?
The Algo analyze the current and previous market structure to identify current ranges and dealing ranges, it give information about the market with the table located in the corners. The table will tell if the market is expanding higher or lower, retracing into the range, consolidating, if a move failed. Will tell if we hit discount or premium, if we might be in a turtle soup enviormment and finally If the range is small or big compared to the previous one. All this is helpful to quickly identify current market context and direction. Is important to keep in mind that this works better in trending markets must be avoided during consolidations. The algo will tell information about current range, current dealing range and previous dealing range. Is ideal to take entries when the 3 are in sync.
Once the indicator detect current market state it will plot an arrow right after the current candle close telling the possible
Market sentiment and probable direction. This signals can be tricked during consolidations. But when we are trending they work very good.
The light green arrow is plotted when price hits discount and is in a bullish enviormment and price makes a close above previous candle high. The dark green arrow is plotted when we are bullish and price makes an impulse and break the range.
The light red arrow is plotted when price hits a premium in a bearish enviormment and price makes a close below previous candle low. The dark red arrow is plotted when we are bearish and price makes and impulse breaking the range.
The white arrows are plotted when price makes a break out or change of current market state and this is counter to the current market enviormment meaning if we are bullish and we get a down impulse white arrow will be plotted. Then same if we are bearish and price makes an up impulse will plot a white arrow. This ones are usually traps but can also be a real breakout. It depends of the market context in the higher timeframe.
The Algo have the option to plot current ranges that are the lines with the cross, this lines change color depending of the market sentiment and market structure. Light Green for bullish expansion and light red for bearish expansion. Dark colors appears when the range is closed. The equilibrium price is plotted in gray, it change to black when it detect contraction and to white when detect expansion of the ranges.
ICT dealing ranges are plotted in white lines with the equilibrium point in yellow. This lines only appear while price is respecting the range and is consolidating inside and price is not expanding.
The indicator also draws some label lines to easily identify the current range and dealing range and if you want the previous dealing range. This line also tell you when price make a Break of structure and where is the ideal change or character for the timeframe we are looking for.
Lastly the The Rook have the option to enable colors in the bars this is helpful to quickly identify the market state, when price is aliged with the current market sentiment light green or red colors tell us that price is in a premium or discount. Dark and gray colors means price is already in an impulse. And finally when there is an absent of color means price is change current state similar to the white arrows. By default this colors are disable. You can edit in settings
How to use it?
After understanding how the rook communicates we can use it to follow the market direction, the best way to use it is waiting for the Range and dealing range a to be aligned for increasing probabilities we can wait for the previous dealing range too, one that’s in play we just wait for a premium or discount light green or light red signal to enter targeting first the break of the range and then holding for profits while is expanding until we get an opposite signal. This give us the possibility to hold for really big runs. See the picture below. This can be used in any timeframe so depending of the timeframe those ranges might be different but the key is to be align also with a higher timeframe direction.

Swing Trend AnalysisIntroducing the Swing Trend Analyzer: A Powerful Tool for Swing and Positional Trading
The Swing Trend Analyzer is a cutting-edge indicator designed to enhance your swing and positional trading by providing precise entry points based on volatility contraction patterns and other key technical signals. This versatile tool is packed with features that cater to traders of all timeframes, offering flexibility, clarity, and actionable insights.
Key Features:
1. Adaptive Moving Averages:
The Swing Trend Analyzer offers multiple moving averages tailored to the timeframe you are trading on. On the daily chart, you can select up to four different moving average lengths, while all other timeframes provide three moving averages. This flexibility allows you to fine-tune your analysis according to your trading strategy. Disabling a moving average is as simple as setting its value to zero, making it easy to customize the indicator to your needs.
2. Dynamic Moving Average Colors Based on Relative Strength:
This feature allows you to compare the performance of the current ticker against a major index or any symbol of your choice. The moving average will change color based on whether the ticker is outperforming or underperforming the selected index over the chosen period. For example, on a daily chart, if the 21-day moving average turns blue, it indicates that the ticker has outperformed the selected index over the last 21 days. This visual cue helps you quickly identify relative strength, a key factor in successful swing trading.
3. Visual Identification of Price Contractions:
The Swing Trend Analyzer changes the color of price bars to white (on a dark theme) or black (on a light theme) when a contraction in price is detected. Price contractions are highlighted when either of the following conditions is met: a) the current bar is an inside bar, or b) the price range of the current bar is less than the 14-period Average Daily Range (ADR). This feature makes it easier to spot price contractions across all timeframes, which is crucial for timing entries in swing trading.
4. Overhead Supply Detection with Automated Resistance Lines:
The indicator intelligently detects the presence of overhead supply and draws a single resistance line to avoid clutter on the chart. As price breaches the resistance line, the old line is automatically deleted, and a new resistance line is drawn at the appropriate level. This helps you focus on the most relevant resistance levels, reducing noise and improving decision-making.
5. Buyable Gap Up Marker: The indicator highlights bars in blue when a candle opens with a gap that remains unfilled. These bars are potential Buyable Gap Up (BGU) candidates, signaling opportunities for long-side entries.
6. Comprehensive Swing Trading Information Table:
The indicator includes a detailed table that provides essential data for swing trading:
a. Sector and Industry Information: Understand the sector and industry of the ticker to identify stocks within strong sectors.
b. Key Moving Averages Distances (10MA, 21MA, 50MA, 200MA): Quickly assess how far the current price is from key moving averages. The color coding indicates whether the price is near or far from these averages, offering vital visual cues.
c. Price Range Analysis: Compare the current bar's price range with the previous bar's range to spot contraction patterns.
d. ADR (20, 10, 5): Displays the Average Daily Range over the last 20, 10, and 5 periods, crucial for identifying contraction patterns. On the weekly chart, the ADR continues to provide daily chart information.
e. 52-Week High/Low Data: Shows how close the stock is to its 52-week high or low, with color coding to highlight proximity, aiding in the identification of potential breakout or breakdown candidates.
f. 3-Month Price Gain: See the price gain over the last three months, which helps identify stocks with recent momentum.
7. Pocket Pivot Detection with Visual Markers:
Pocket pivots are a powerful bullish signal, especially relevant for swing trading. Pocket pivots are crucial for swing trading and are effective across all timeframes. The indicator marks pocket pivots with circular markers below the price bar:
a. 10-Day Pocket Pivot: Identified when the volume exceeds the maximum selling volume of the last 10 days. These are marked with a blue circle.
b. 5-Day Pocket Pivot: Identified when the volume exceeds the maximum selling volume of the last 5 days. These are marked with a green circle.
The Swing Trend Analyzer is designed to provide traders with the tools they need to succeed in swing and positional trading. Whether you're looking for precise entry points, analyzing relative strength, or identifying key price contractions, this indicator has you covered. Experience the power of advanced technical analysis with the Swing Trend Analyzer and take your trading to the next level.

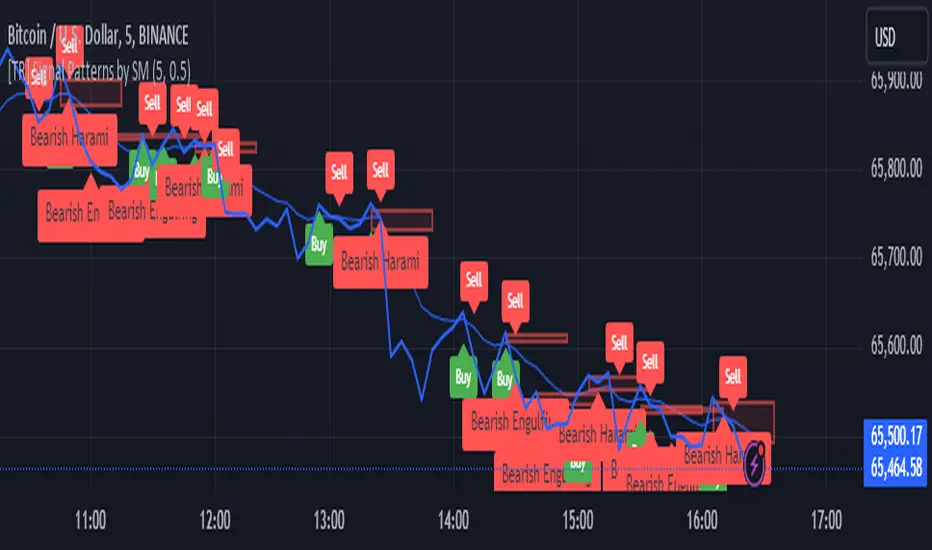
[TR] Engulf Patterns by SM
Engulf Pattern by SM
Overview:
The " Engulf Pattern by SM" script is designed to identify bullish and bearish engulfing candlestick patterns on TradingView charts. Engulfing patterns are significant in technical analysis as they often indicate potential reversals in market trends.
Features:
- Bullish Engulfing Pattern Detection: The script identifies bullish engulfing patterns, which occur when a larger bullish candle completely engulfs the body of the previous smaller bearish candle.
- Bearish Engulfing Pattern Detection: Similarly, it detects bearish engulfing patterns, where a larger bearish candle engulfs the body of the preceding smaller bullish candle.
- Body Size Filtering: The script includes a feature to filter patterns based on the size of the candle bodies, allowing for more precise marking of significant patterns.
- Visual Markers: The script plots visual markers on the chart to highlight the detected engulfing patterns, making it easy for traders to spot them.
How It Works:
1. Bullish Engulfing Pattern:
- The script checks for a smaller bearish candle followed by a larger bullish candle.
- The body of the bullish candle must completely cover the body of the bearish candle.
- The size of the bullish candle's body must meet a specified threshold to be considered significant.
2. Bearish Engulfing Pattern:
- The script looks for a smaller bullish candle followed by a larger bearish candle.
- The body of the bearish candle must completely engulf the body of the bullish candle.
- The size of the bearish candle's body must meet a specified threshold to be considered significant.
Usage:
- Add the Script: Apply the " Engulf Pattern by SM" script to your TradingView chart.
- Configure Settings: Customize the script settings to suit your trading strategy, including visual marker styles and body size thresholds.
- Monitor Visual Markers: Keep an eye on the visual markers to identify potential trading opportunities based on engulfing patterns.
Disclaimer:
This script is not intended to be used as a direct entry signal. It should be used as a confluence in your overall trading plan. Always conduct your own analysis and consider multiple factors before making any trading decisions.
Feel free to customize this writeup further to match your specific needs! If you have any other requests or need additional details, just let me know.
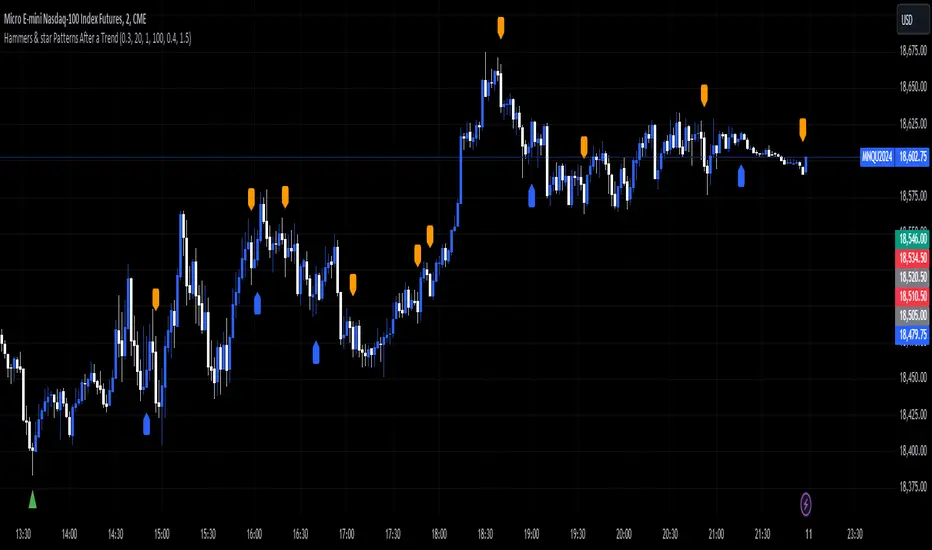
Hammers & star Patterns After a Trend
1. **Candlestick Patterns Detection:**
- **Hammers** and **Inverted Hammers** are specific candlestick patterns that can indicate potential reversals in the market.
- **Hammer**: A candle with a small body and a long lower wick, showing a possible reversal after a downtrend.
- **Inverted Hammer**: A candle with a small body and a long upper wick, indicating a possible reversal after an uptrend.
2. **Volume Consideration:**
- The script checks if these patterns occur with **high trading volume**. If the volume is significantly higher than the average volume over a certain period, the pattern is highlighted.
3. **Trend Detection:**
- The script looks for a significant trend before the pattern appears:
- **Downtrend**: A significant downward movement in price is required before a Hammer is considered.
- **Uptrend**: A significant upward movement is required before an Inverted Hammer is considered.
4. **Additional Patterns:**
- **Morning Star** and **Evening Star** patterns are also detected:
- **Morning Star**: A three-candle pattern where the first candle is a large bearish candle, followed by a small-bodied candle, and then a large bullish candle, indicating a potential reversal from downtrend to uptrend.
- **Evening Star**: The opposite pattern, signaling a potential reversal from uptrend to downtrend.
5. **Visual Indicators:**
- The script **plots arrows** and **labels** on the chart to show where these patterns occur:
- **Hammers** and **Inverted Hammers** are marked with triangle arrows.
- **Morning Stars** and **Evening Stars** are marked with labels.
In summary, this script helps traders identify key candlestick patterns that may signal potential reversals in price trends, with special emphasis on patterns that occur with high volume and after significant price movements.
Bias Finder [UAlgo]The "Bias Finder " indicator is a tool designed to help traders identify market bias and trends effectively. This indicator leverages smoothed Heikin Ashi candles and oscillators to provide a clear visual representation of market trends and potential reversals. By utilizing higher timeframes and smoothing techniques, the indicator aims to filter out market noise and offer a more reliable signal for trading decisions.
🔶 Key Features
Heikin Ashi Candles: The indicator uses Heikin Ashi candles, a special type of candlestick that incorporates information from the previous candle to potentially provide smoother visuals and highlight potential trend direction.
Oscillator: The indicator calculates an oscillator based on the difference between the smoothed opening and closing prices of a higher timeframe. This oscillator helps visualize the strength of the bias.
Light Teal: Strong bullish trend.
Dark Teal: Weakening bullish trend.
Light Red: Strong bearish trend.
Dark Red: Weakening bearish trend.
Standard Deviation: The indicator can optionally display upper and lower standard deviation bands based on the Heikin Ashi high and low prices. These bands can help identify potential breakout areas.
Oscillator Period: Adjust the sensitivity of the oscillator.
Higher Timeframe: Select a timeframe for the Heikin Ashi candles and oscillator calculations (must be equal to or greater than the chart's timeframe).
Display Options: Choose whether to display Heikin Ashi candles, market bias fill, standard deviation bands, and HA candle colors based on the bias.
Alerts: Enable/disable specific alerts and customize their messages.
🔶 Disclaimer
Use with Caution: This indicator is provided for educational and informational purposes only and should not be considered as financial advice. Users should exercise caution and perform their own analysis before making trading decisions based on the indicator's signals.
Not Financial Advice: The information provided by this indicator does not constitute financial advice, and the creator (UAlgo) shall not be held responsible for any trading losses incurred as a result of using this indicator.
Backtesting Recommended: Traders are encouraged to backtest the indicator thoroughly on historical data before using it in live trading to assess its performance and suitability for their trading strategies.
Risk Management: Trading involves inherent risks, and users should implement proper risk management strategies, including but not limited to stop-loss orders and position sizing, to mitigate potential losses.
No Guarantees: The accuracy and reliability of the indicator's signals cannot be guaranteed, as they are based on historical price data and past performance may not be indicative of future results.
