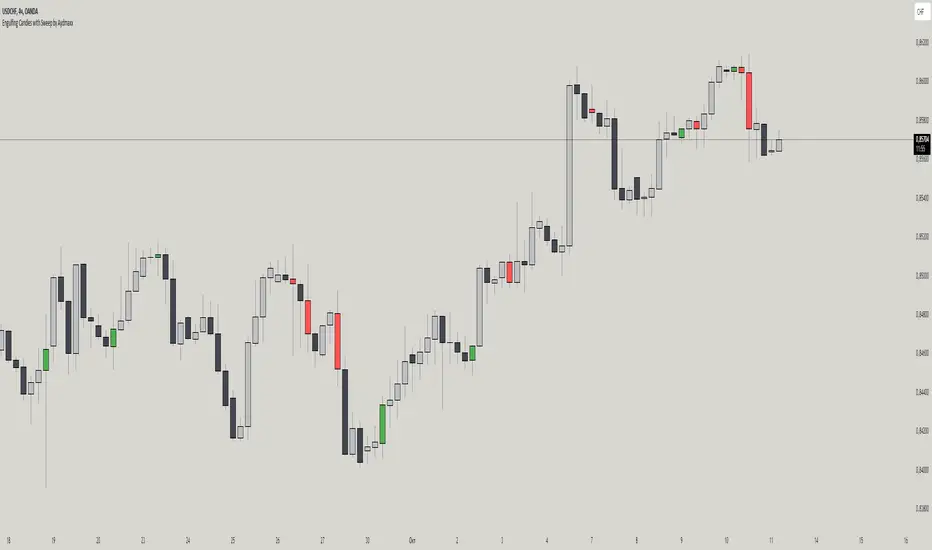
Engulfing Candles with Sweep by AydmaxxEngulfing Candles with Sweep Indicator
The "Engulfing Candles with Sweep" indicator identifies bullish and bearish engulfing candles that exhibit liquidity sweeps. It marks these significant candlestick patterns and draws a 50% Fibonacci retracement line from the high to low of the engulfing candle. The indicator helps traders spot potential reversal points where large market players might be accumulating or distributing positions.
Key Features:
Bullish Engulfing Candle with Sweep:
Identifies when a bullish candle (closing higher than it opened) engulfs the previous bearish candle (closing lower than it opened).
Ensures that the bullish candle’s low is lower than the previous candle’s low, indicating a sweep of liquidity.
Marks the identified bullish candle with a symbol below the candlestick.
Draws a 50% Fibonacci retracement line from the high to the low of the bullish engulfing candle.
Bearish Engulfing Candle with Sweep:
Identifies when a bearish candle (closing lower than it opened) engulfs the previous bullish candle (closing higher than it opened).
Ensures that the bearish candle’s high is higher than the previous candle’s high, indicating a sweep of liquidity.
Marks the identified bearish candle with a symbol above the candlestick.
Draws a 50% Fibonacci retracement line from the high to the low of the bearish engulfing candle.
Customizable Settings:
Fibonacci Line Color: Allows customization of the Fibonacci retracement line color for both bullish and bearish engulfing candles.
Fibonacci Line Style: Provides options to choose the line style (solid, dotted, dashed).
Fibonacci Line Width: Enables adjustment of the line width for better visibility.
Toggle Fibonacci Lines: Option to enable or disable the display of Fibonacci retracement lines.
How to Use:
Apply the indicator to your chart.
Look for symbols below or above the candlesticks, indicating bullish or bearish engulfing candles with liquidity sweeps.
Utilize the 50% Fibonacci retracement lines to identify potential support or resistance levels.
Benefits:
Helps in identifying key reversal patterns in the market.
Provides visual aids with Fibonacci retracement levels for potential entry and exit points.
Enhances trading decisions by confirming engulfing patterns with liquidity sweeps.
K線分析
Brooks Always In [KintsugiTrading]Brooks Always In
Overview:
The "Brooks Always In Indicator" by KintsugiTrading is a tool designed for traders who follow price action methodologies inspired by Al Brooks. This indicator identifies key bar patterns and breakouts, plots an Exponential Moving Average (EMA), and highlights consecutive bullish and bearish bars. It is intended to assist traders in making informed decisions based on price action dynamics.
Features:
Consecutive Bar Patterns:
Identifies and highlights consecutive bullish and bearish bars.
Differentiates between bars that are above/below the EMA and those that are not.
Customizable EMA:
Option to display an Exponential Moving Average (EMA) with user-defined length and offset.
The EMA can be smoothed using various methods such as SMA, EMA, SMMA (RMA), WMA, and VWMA.
Breakout Patterns:
Recognizes bullish and bearish breakout bars and outside bars.
Tracks inside bars and prior bar conditions to better understand the market context.
Customizable Display:
Users can display or hide the EMA, consecutive bar patterns, and consecutive bars relative to the moving average.
How to Use:
Customize Settings:
First, I like to navigate to the top right corner of the chart (bolt icon), and change both the bull and bear body color to match the background (white/black) - this helps the user visualize the indicator far better.
Next, Toggle to display EMA, consecutive bar patterns, and consecutive bars relative to the moving average using the provided input options.
Adjust the EMA length, source, and offset as per your trading strategy.
Select the smoothing method and length for the EMA if desired.
Analyze Key Patterns:
Observe the highlighted bars on the chart to identify consecutive bullish and bearish patterns.
Use the plotted EMA to gauge the general trend and analyze the relationship between price bars and the moving average.
Informed Decision Making:
Utilize the identified bar patterns and breakouts to make informed trading decisions, such as identifying potential entry and exit points based on price action dynamics.
Good luck with your trading!

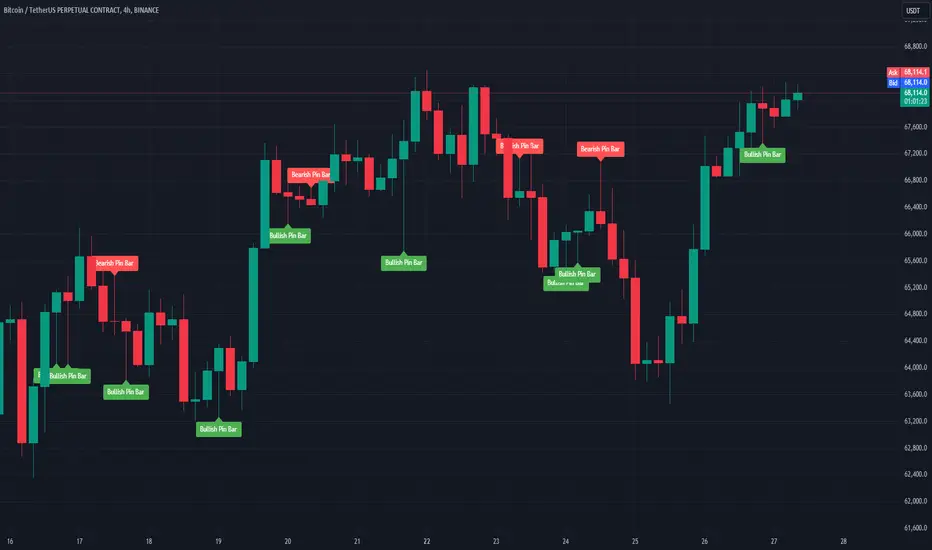
Beno Pinbar v1Overview
This Pine Script indicator is designed to be the best tool available for detecting pinbars in the market. It focuses on specific conditions to identify pinbars accurately and suggests a strategy using Fibonacci levels for trading. There is no other indicator on TradingView capable of what this indicator does, making it unique and highly valuable for traders.
Key Features
Pinbar Detection Criteria:
The indicator only detects pinbars if the body of the candle is between the 1.0 Fibonacci level and the 0.618 Fibonacci level.
This strict criterion ensures that only the most reliable pinbars are identified, enhancing the accuracy of the indicator.
Trading Strategy:
Bullish Pinbar: Draw a Fibonacci retracement from the high price to the low price of the pinbar.
Take Profit (TP) Levels: Set at 1.618, 2.618, and 3.618 Fibonacci levels.
Stop Loss (SL): Set at the 0 Fibonacci level.
Bearish Pinbar: Draw a Fibonacci retracement from the low price to the high price of the pinbar.
Take Profit (TP) Levels: Set at 1.618, 2.618, and 3.618 Fibonacci levels.
Stop Loss (SL): Set at the 0 Fibonacci level.
Support and Resistance Consideration:
The indicator takes into account the support and resistance lines around the candle, adding an extra layer of reliability to the detected pinbars.
Time Frame Efficiency:
The indicator performs better on higher time frames, providing more reliable results and reducing the noise often found in lower time frames.
Uniqueness:
This indicator's ability to detect pinbars based on the strict Fibonacci criteria and its integration with support and resistance levels makes it unmatched by any other indicator available on TradingView.
How It Works
The indicator scans the chart for candles that meet the specific pinbar criteria (body between 1.0 and 0.618 Fibonacci levels).
Once a pinbar is detected, it highlights the candle and provides the Fibonacci levels for the suggested trading strategy.
The user can then place trades based on these levels, with clearly defined take profit and stop loss points.
Usage Tips
Use this indicator on higher time frames for the best results.
Combine the pinbar signals with other technical analysis tools and market context to enhance trading decisions.
Monitor support and resistance levels closely to validate the pinbar signals.
Arabic Version
مؤشر Pine Script لاكتشاف Pinbar
نظرة عامة
تم تصميم هذا المؤشر باستخدام Pine Script ليكون أفضل أداة متاحة لاكتشاف الشموع العاكسة (Pinbars) في السوق. يركز المؤشر على شروط محددة لاكتشاف الشموع العاكسة بدقة ويقترح استراتيجية باستخدام مستويات فيبوناتشي للتداول. لا يوجد أي مؤشر آخر على TradingView قادر على تحقيق ما يفعله هذا المؤشر، مما يجعله فريدًا وذو قيمة عالية للمتداولين.
الميزات الرئيسية
معايير اكتشاف الشموع العاكسة:
يكتشف المؤشر الشموع العاكسة فقط إذا كان جسم الشمعة بين مستوى فيبوناتشي 1.0 ومستوى فيبوناتشي 0.618.
يضمن هذا المعيار الصارم اكتشاف الشموع العاكسة الأكثر موثوقية فقط، مما يعزز دقة المؤشر.
استراتيجية التداول:
الشمعة العاكسة الصعودية: ارسم فيبوناتشي من أعلى سعر إلى أدنى سعر للشمعة العاكسة.
مستويات جني الأرباح (TP): يتم تحديدها عند مستويات فيبوناتشي 1.618، 2.618، و 3.618.
وقف الخسارة (SL): يتم تحديدها عند مستوى فيبوناتشي 0.
الشمعة العاكسة الهبوطية: ارسم فيبوناتشي من أدنى سعر إلى أعلى سعر للشمعة العاكسة.
مستويات جني الأرباح (TP): يتم تحديدها عند مستويات فيبوناتشي 1.618، 2.618، و 3.618.
وقف الخسارة (SL): يتم تحديدها عند مستوى فيبوناتشي 0.
Market Structure Break Targets [UAlgo]The "Market Structure Break Targets " indicator is designed to identify and visualize key market structure points such as Market Structure Breaks (MSBs) and Break of Structures (BoS). These points are crucial for understanding market trends and potential reversal zones. By plotting these structures on the chart, traders can easily spot significant support and resistance levels, as well as potential entry and exit points.
This indicator uses a combination of swing highs and lows to determine market structures and calculates targets based on user-defined percentages or Average True Range (ATR) multipliers. It provides visual cues in the form of lines, labels, and boxes to help traders quickly interpret market conditions.
🔶 Key Features
Customizable Swing Length: Users can set the swing length to identify the pivot highs and lows, which are crucial for determining market structure.
Target Duration Bars: Defines the maximum duration (in bars) for which the targets will be considered valid.
Target Calculation Methods: The target levels are crucial for setting potential price objectives. The calculation can be based on a percentage move from the identified pivot or using the ATR to factor in market volatility. These targets help in setting realistic profit-taking levels or identifying stop-loss placements.
Bullish and Bearish Market Structure Break (MSB): Detects and highlights bullish and bearish market structure breaks with customizable colors and target percentages.
Bullish MSB
When the price closes above a significant pivot high, a bullish MSB is identified. The indicator will draw a line at this level and calculate a target based on the chosen method (percentage or ATR). The target is visualized with a dotted line, and a label "MSB" is displayed. Additionally, an order block is created at the level of the bullish MSB. This order block is highlighted with a semi-transparent box, representing a potential area where price might find support in the future.
Bearish MSB
Conversely, when the price closes below a significant pivot low, a bearish MSB is marked. Similar to bullish MSBs, targets are calculated and displayed on the chart. An order block is also generated at the level of the bearish MSB, visualized with a semi-transparent box. This box highlights a potential resistance area where price might face selling pressure.
Bullish and Bearish Break of Structure (BoS): Identifies break of structures for both bullish and bearish scenarios, providing additional target levels.
Bullish BoS
If the price continues to rise and breaks another significant level, a bullish BoS is detected. This break is also marked with lines and labels, providing additional target levels for traders. An order block is created at the BoS level, serving as a potential support zone.
Bearish BoS
If the price falls further after a bearish MSB, a bearish BoS is identified and visualized similarly. The indicator creates an order block at the BoS level, which acts as a potential resistance zone.
🔶 Disclaimer:
Use with Caution: This indicator is provided for educational and informational purposes only and should not be considered as financial advice. Users should exercise caution and perform their own analysis before making trading decisions based on the indicator's signals.
Not Financial Advice: The information provided by this indicator does not constitute financial advice, and the creator (UAlgo) shall not be held responsible for any trading losses incurred as a result of using this indicator.
Backtesting Recommended: Traders are encouraged to backtest the indicator thoroughly on historical data before using it in live trading to assess its performance and suitability for their trading strategies.
Risk Management: Trading involves inherent risks, and users should implement proper risk management strategies, including but not limited to stop-loss orders and position sizing, to mitigate potential losses.
No Guarantees: The accuracy and reliability of the indicator's signals cannot be guaranteed, as they are based on historical price data and past performance may not be indicative of future results.

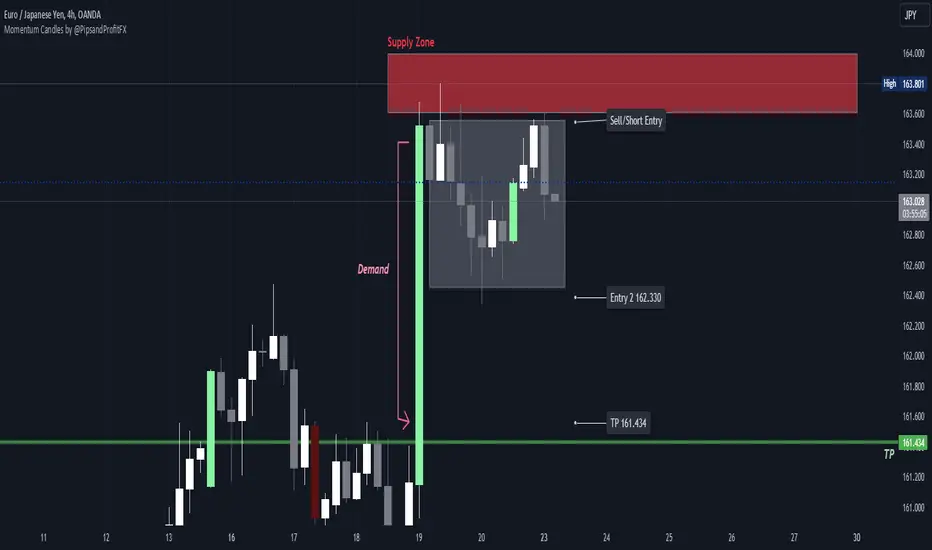
Momentum Candles by @PipsandProfitFXThe High Momentum Candles indicator highlights price bars with exceptional price movement and strong volume. It identifies candles with significantly long bodies relative to their shadows, indicating rapid price changes. Additionally, the indicator filters for candles with above-average volume to confirm the strength of the price movement.
Dark red: bearish momentum
Orange: bullish momentum
(You can easily change the momentum candles to whatever color you want in the indicator settings.)
By visually emphasizing these high momentum candles, traders can potentially identify potential trend reversals or continuations, as well as potential entry and exit points.
Key Features:
Identifies candles with large bodies relative to their shadows
Filters candles based on volume to confirm strength
Highlights high momentum candles with a distinct color
Let me know if you'd like to see any updates on this indicator.
Note: This indicator is a visual tool and should be used in conjunction with other technical analysis techniques for making informed trading decisions.
Volume Gaps and ImbalancesThis Pine script indicator is designed to visually depict price inefficiencies, as identified by Volume Imbalances (VI) or Gaps. A Volume Gap is a scenario where the wicks of two successive candles don’t intersect, while an Imbalance occurs when only the wicks overlap, leaving the bodies apart. These zones of inefficiency frequently act as magnets for price, with the market striving rebalance in accordance with ICT principles.
Relevance:
Volume Gaps/Imbalances are zones of highly inefficient price delivery as per ICT concepts and represent a very strong draw to price. Price will often seek to rebalance those zones to ensure efficient price delivery. Consequently, these zones can provide good targets for entries in the opposite direction or take profit targets for previous entries in the direction of the Gap/Imbalance.
How It Works:
The indicator keeps track of all Gaps/Imbalances from the beginning of the available history. It automatically removes all mitigated Gaps/Imbalances, which are situations where the price has at least reached the bottom of a bullish gap or the top of a bearish gap.
On the last bar, the most recent valid gaps are highlighted with a box drawn from the start to the end of the gap. The start of a bullish gap is determined by the highest price of the previous candle’s open or close, while for bearish gaps, it’s the lowest price of the previous candle’s open or close. Conversely, the end of a bullish gap is the lowest price of the current candle’s open or close, and for bearish gaps, it’s the highest price of the current candle’s open or close.
To enhance the indicator’s speed and minimize chart noise, only the most recent gaps will be displayed, up to the limit set in the indicator settings.
Each displayed VI/GAP will indicate the size of the imbalance in ticks. For imbalances greater than 3 ticks, which represent stronger draws of liquidity, the color transparency will be reduced, and the text will be made more prominent. Volume Gaps are also marked with a 🧲 emoji for easy visual identification.
The indicator will automatically extend the boxes representing valid imbalances to the current bar for as long as the imbalance is not mitigated.
If an imbalance has been tapped, but not mitigated, the indicator will append 🚩emoji to denote that the imbalance has been partially mitigated and may no longer have as strong of a draw for price.
Configurability:
A user may configure the number of imbalances to show, the setting applies to bullish/bearish imbalances individually. This setting can be set to any value from 1 – 50.
Appearance wise, color, style and color transparency of each box representing an imbalance can be configured. The imbalance box label can be configured by setting the text size, along with the vertical & horizontal alignment.
What makes this indicator different:
Designed with high performance in mind, to reduce impact on chart render time.
Only keeps valid imbalances on the chart, with a limit on the # drawn
Indicates the size of the gap and provides visual markets to denote stronger, weaker and partially mitigated gaps

Bearish 3 Bars Reversal PatternThis TradingView Pine Script indicator identifies and highlights a bearish 3-bar reversal pattern on your chart. The script also calculates the percentage difference between the current low and the previous high, displaying this value on the chart when the pattern is detected.
Features:
Pattern Detection:
The script detects a bearish 3-bar reversal pattern when the high of the previous bar is higher than the high of the bar before it, and the current high is lower than the previous high.
Percentage Difference Calculation:
When the pattern is detected, the script calculates the percentage difference between the current low and the previous high. This percentage is displayed on the chart.
Visual Indicators:
When a bearish 3-bar reversal pattern is detected, a label is created on the chart showing the calculated percentage difference. The label is styled with a downward arrow, red color, and white text for clear visibility.
Alerts:
An alert condition is set up to notify users when the bearish 3-bar reversal pattern is detected. This allows traders to take timely action based on the pattern.

Bullish 3 Bars Reversal PatternThis TradingView Pine Script indicator identifies and highlights a bullish 3-bar reversal pattern on your chart. The script also calculates the percentage difference between the current high and the previous low, displaying this value on the chart when the pattern is detected.
Features:
Pattern Detection:
The script detects a bullish 3-bar reversal pattern when the low of the previous bar is lower than the low of the bar before it, and the current low is higher than the previous low.
Percentage Difference Calculation:
When the pattern is detected, the script calculates the percentage difference between the current high and the previous low. This percentage is displayed on the chart.
Visual Indicators:
When a bullish 3-bar reversal pattern is detected, a label is created on the chart showing the calculated percentage difference. The label is styled with an upward arrow, green color, and white text for clear visibility.
Alerts:
An alert condition is set up to notify users when the bullish 3-bar reversal pattern is detected. This allows traders to take timely action based on the pattern.

Demand Supply Zone AlertsDemand Supply Zone Alert Indicator
This indicator functions as a scanner/screener and is designed to identify symbols with potential demand and supply zones and generate alerts based on your customized settings. It does not visually plot anything on the chart but is used to place alerts.
Key Features:
1. Demand Supply Zone Patterns:
- Drop Base Rally
- Rally Base Rally
- Rally Base Drop
- Drop Base Drop
2. Zoning Methods:
- Wick to Wick: In a demand zone, this method uses the highest high of the basing as the proximal line. For supply zones, it uses the lowest low of the basing.
- Body to Wick: In a demand zone, this method uses the highest body of the basing as the proximal line. For supply zones, it uses the lowest body of the basing.
3. Legin Methods:
- Candle Type: Based on the candle's bullish or bearish structure.
- Candle Color: Uses the candle color to determine the legin, with green indicating a rally and red indicating a drop.
4. Additional Zone Options:
- Follow Through Pattern: Zones with one legout followed by another legout, based on user-defined strength settings.
- Overnight Gap Zones: Zones formed due to overnight gaps after the basing.
- All Demand Supply Zone Structures: Includes all zones, even if they are not considered quality zones.
5. Zone Settings:
- Number of Candles in Basing: Customize the number of candles in the basing phase. For example, setting it to 3 will only identify zones with 3 or fewer basing candles.
- Legout Strength for Single Legout Pattern: Defines how strong a legout candle must be to qualify as a zone.
- Legout Strength for Follow-Through Pattern: Specifies the strength required for two consecutive legout candles to qualify as a follow-through pattern.
Functionality:
The indicator identifies zones based on a three-component structure: legin, basing, and legout. It uses an algorithm that categorizes candles as legin, basing, or legout based on their range compared to the average candle on the chart. Quality zones are defined by legout candles that are significantly larger than the average candle, while basing candles are smaller.
Once a valid zone structure is identified, the indicator will generate an alert from the list of symbols provided in the settings. Alerts will notify users according to their alert notification settings.
Usage Recommendations:
- This indicator works as a real-time scanner or screener to shortlist symbols when a valid zone is formed based on user settings.
- It aids in identifying potential demand and supply zones, but does not provide explicit buy or sell signals.
- Users should integrate this tool with their own trading plan and thoroughly evaluate any identified symbols before making trades.
Limitations:
This indicator does not provide explicit buy or sell signals. It is intended to aid in identifying symbols where demand and supply zones are being created. Users should use this tool in conjunction with their own trade plan and thoroughly evaluate any identified symbols before making any trades.
Disclaimer:
Please ensure you thoroughly evaluate and qualify any identified symbols according to your individual trade plan before making any trades.

ATR Gerchik LightAverage True Range ( ATR ) is a technical analysis indicator that measures volatility in the market. ATR is a moving average of the true range over a period of time.
ATR calculation procedure:
1. Determine the true maximum - this is the highest of the current maximum and yesterday's closing price of the day.
2. Determine the true minimum - this is the smallest of the current minimum and yesterday's closing price.
3. Determine the true range - this is the distance between the true maximum and minimum.
4. We exclude extremely large candles (> x2 ATR) and extremely small ones (< 0.5 ATR) from the obtained true ranges.
5. We calculate the average for the selected period based on the remaining range.
6. We calculate the percentage of the current True Range relative to the average ATR value for the previous period.
Description:
If you analyze it yourself, you will see that 75-80% of the time, the instrument moves only 1 ATR per day. You must understand that if an instrument has, for example, moved 80% of its daily range, it is not advisable to purchase it. This is comparable to a car's fuel tank: if the tank is almost empty, the car won't go far. Most indicators that calculate ATR include anomalous candles, which give unreliable results and lead to incorrect decisions. Because of this, many traders prefer to calculate ATR on their own.
However, the Gerchik ATR indicator accounts for anomalous candles and filters out extremely large candles (> 2x ATR) and extremely small ones (< 0.5x ATR). Additionally, this indicator immediately shows the consumed “fuel” of the instrument as a percentage, so you don't have to calculate the distance traveled yourself. This allows you to make quick, informed decisions. If we see that the tank is almost empty, it is logical not to get into that car today. When building any strategy, you must rely on the average movement.
Key Features:
Anomalous Candle Filtering: Excludes extremely large and small candles to provide more reliable ATR values.
Consumed Fuel Indicator: Shows the percentage of the ATR consumed, helping traders quickly assess the remaining potential movement.
Daily Timeframe Focus: Designed specifically for use on daily charts for accurate long-term analysis.
Practical Applications:
Entry and Exit Points: Use the ATR to determine optimal entry and exit points by assessing market volatility and potential price movement.
Stop-Loss Placement: Calculate stop-loss levels based on ATR to ensure they are placed at appropriate distances, accounting for current market volatility.
Trend Confirmation: Use the percentage of ATR consumed to confirm the strength of a trend and decide whether to enter or exit trades.
Examples of Use:
Trend Following: During strong trends, ATR helps identify periods of increased volatility, signaling potential breakouts or reversals.
Range Trading: In ranging markets, ATR can highlight periods of low volatility, indicating consolidation and potential breakout zones.
Note: The indicator is displayed and works only on the daily timeframe!
The indicator was created according to the instructions, description of the functionality, and strategy of Mr. Gerchik. Thank you so much, Chief!
________________________
Average True Range ( ATR , средний истинный диапазон) – это индикатор технического анализа, который измеряет волатильность на рынке. ATR представляет собой скользящее среднее истинного диапазона за определенный период времени.
Порядок расчета ATR:
1. Определяем истинный максимум – это наивысшее из текущего максимума и вчерашней цены закрытия дня.
2. Определяем истинный минимум – это наименьшее из текущего минимума и вчерашней цены закрытия.
3. Определяем истинный диапазон – это расстояние между истинным максимумом и минимумом.
4. Исключаем из полученных истинных диапазонов экстремально большие свечи (> x2 ATR) и экстремально маленькие (< 0.5 ATR).
5. Рассчитываем среднее за выбранный период исходя из оставшегося диапазона.
6 . Рассчитываем процент текущего истинного диапазона (True Range) относительно среднего значения ATR за предыдущий период.
Описание:
Если вы сами проанализируете, то увидите, что 75-80% времени инструмент ходит только 1 ATR. И вы должны понимать, что если инструмент внутри дня прошел, к примеру, 80% своего движения, то этот инструмент больше нельзя покупать. Это можно сравнить с баком машины: если бак почти пустой, машина далеко не уедет. Большинство индикаторов, которые рассчитывают ATR, производят расчет с паранормальными свечами. Это дает недостоверный результат и приводит к неверным решениям. Многие трейдеры из-за этого не используют готовые индикаторы и предпочитают считать ATR самостоятельно. Но индикатор ATR Gerchik учитывает паранормальные свечи и фильтрует экстремально большие свечи (> x2 ATR) и экстремально маленькие (< 0.5 ATR). Также этот индикатор сразу показывает израсходованный "бензин" инструмента в процентах. И вам не надо самостоятельно высчитывать пройденный путь. Вы можете быстро принимать правильные решения. Если мы видим, что бак почти пустой, логично не садиться в эту машину сегодня. Когда вы строите какую-то стратегию, вы должны обязательно полагаться на среднестатистическое движение.
Существует много стратегий, завязанных на ATR, которые учитывают волатильность инструмента, запас хода, точки разворота, места выставления стоп-лоссов (SL) и тейк-профитов (TP) и другие факторы. Я не буду останавливаться на них, так как каждый может найти описание этих стратегий и использовать их на свой выбор.
Индикатор отображается и работает только на дневном таймфрейме!
Индикатор создан по наставлениям, описанию функционала и стратегии господина Герчика. Огромное спасибо, Шеф!

ICT Single Candle Order Block (SCOB) [UAlgo]The "ICT Single Candle Order Block (SCOB) " designed for traders who utilize the concept of Order Blocks in their trading strategy. Order Blocks are significant price levels where institutions or smart money have placed their trades, leading to potential future price reactions when these levels are revisited. This indicator focuses on identifying and highlighting Single Candle Order Blocks (SCOBs), allowing traders to visually analyze key price levels on their charts.
🔶 What is Single Candle Order Block (SCOB) ?
A Single Candle Order Block (SCOB) is a specific type of Order Block that is identified based on a single candlestick pattern. These patterns indicate potential areas where significant buying or selling interest has occurred, often leading to a notable price reaction when revisited. In the context of this indicator, a bullish SCOB is identified when a specific bullish candlestick pattern is met, and a bearish SCOB is identified based on a bearish candlestick pattern.
Bullish SCOB: Detected when the open price of two bars ago is higher than its close, the close price of the previous bar is higher than its open, the current close price is higher than the open, the low of the previous bar is lower than the low of two bars ago, and the current close is higher than the high of the previous bar.
Bearish SCOB: Detected when the open price of two bars ago is lower than its close, the close price of the previous bar is lower than its open, the current close price is lower than the open, the high of the previous bar is higher than the high of two bars ago, and the current close is lower than the low of the previous bar.
🔶 Key Features
Show Single Candle Order Block (SCOB): Toggle the visibility of the Single Candle Order Blocks on the chart.
Mitigation Method: Choose between "Close" and "Wick" methods for determining whether a SCOB has been mitigated (price has interacted with the block).
Show Last X SCOBs: Control the number of most recent SCOBs displayed on the chart, allowing you to focus on the most relevant price levels.
Volatility Filter: Enable or disable the volatility filter, which uses the Average True Range (ATR) to filter out less significant SCOBs. When enabled, only SCOBs with an ATR above the mean value of the ATR are displayed.
Customizable Colors: Configure the colors for bullish and bearish SCOBs to enhance visual clarity. The indicator uses cooler RGB values to ensure the blocks are distinct and easily noticeable.
🔶 Disclaimer
The "ICT Single Candle Order Block (SCOB) " indicator is provided for educational and informational purposes only. Trading involves significant risk and may not be suitable for all investors.
Past performance is not indicative of future results. Users should use this indicator in conjunction with their own research and trading strategy.

Candlestick Structure [LuxAlgo]The Candlestick Structure indicator detects major market trends and displays various candlestick patterns aligning with the detected trend, filtering out potentially unwanted patterns as a result. Multiple trend detection methods are included and can be selected by the users.
A dashboard showing the alignment percentage of each individual pattern is also provided.
🔶 USAGE
By distinguishing major and minor trend detection, we can still detect patterns based on minor trends, yet filter out the patterns that do not align with the major trend.
By detecting candlestick patterns that align with a major trend, we can effectively detect the ending points of retracements, potentially providing various entry points of interest within a trend.
Users are able to track the alignment of each candlestick pattern in the dashboard to reveal which patterns typically align with the trend and which may not.
Note: Alignment % only checks if the pattern's direction is the same as the current trend direction. These are only raw readings and not any type of confidence score.
🔶 DETAILS
In this indicator, we are identifying and tracking 16 different Candlestick Patterns.
🔹 Bullish Patterns
Hammer: Identified by a small upper wick (or no upper wick) with a small body, and an elongated lower wick whose length is 2X greater than the candle body’s width.
Inverted Hammer: Identified by a small lower wick (or no lower wick) with a small body, and an elongated upper wick whose length is 2X greater than the candle body’s width.
Bullish Engulfing: A 2 bar pattern identified by a large bullish candle body fully encapsulating (opening lower and closing higher) the previous small (bearish) candle body.
Rising 3: A 5 bar pattern identified by an initial full-bodied bullish candle, followed by 3 bearish candles that trade within the high and low of the initial candle, followed by another full-bodied bullish candle closing above the high of the initial candle.
3 White Soldiers: Identified by 3 full-bodied bullish candles, each opening within the body and closing below the high, of the previous candle.
Morning Star: A 3 bar pattern identified by a full-bodied bearish candle, followed by a small-bodied bearish candle, followed by a full-bodied bullish candle that closes above the halfway point of the first candle.
Bullish Harami: A 2 bar pattern, identified by an initial bearish candle, followed by a small bullish candle whose range is entirely contained within the body of the initial candle.
Tweezer Bottom: A 2 bar pattern identified by an initial bearish candle, followed by a bullish candle, both having equal lows.
🔹 Bearish Patterns
Hanging Man: Identified by a small upper wick (or no upper wick) with a small body, and an elongated lower wick whose length is 2X greater than the candle body’s width.
Shooting Star: Identified by a small lower wick (or no lower wick) with a small body, and an elongated upper wick whose length is 2X greater than the candle body’s width.
Bearish Engulfing: A 2 bar pattern identified by a large bearish candle body fully encapsulating (opening higher and closing lower) the previous small (bullish) candle body.
Falling 3: A 5 bar pattern identified by an initial full-bodied bearish candle, followed by 3 bullish candles that trade within the high and low of the initial candle, followed by another full-bodied bearish candle closing below the low of the initial candle.
3 Black Crows: Identified by 3 full-bodied bearish candles, each open within the body and closing below the low, of the previous candle.
Evening Star: A 3 bar pattern identified by a full-bodied bullish candle, followed by a small-bodied bullish candle, followed by a full-bodied bearish candle that closes below the halfway point of the first candle.
Bearish Harami: A 2 bar pattern, identified by an initial bullish candle, followed by a small bearish candle whose range is entirely contained within the body of the initial candle.
Tweezer Top: A 2 bar pattern identified by an initial bullish candle, followed by a bearish candle, both having equal highs.
🔹 Trend Types
Major trend is displayed at all times, the display will change depending on the trend method selected.
The minor trend can also be visualized; to avoid confusion, the minor trend can optionally be displayed through the candle colors.
Supertrend: Displays Upper and Lower SuperTrend, When we break above the upper, it is considered an Uptrend. When we break below the lower, it is considered a Downtrend.
EMAs: Displays Fast and Slow EMAs, When Fast>Slow, it is considered an Uptrend. When Fast

Hindsight TrendNon-realtime but highly accurate trend analyzer with only one fundamental parameter ( period aka "minimum trend length")
Basically Hindsight Trend is pivot points on steroids (handles many cases much better). Plus it shows the trend line.
Period
I usually like periods of 10, 20 or 30.
The indicator's delay is identical to the chosen period.
You can actually try a low period like 4 or 5 to get something resembling a realtime indicator.
Uptrends are based on candle lows, downtrends are based on candle highs. So it is possible to have an uptrend and a downtrend at the same time.
Triangles
At trend start, a triangle is drawn. (Trendline isn't always there if the trend didn't last that long.)
Triangle size shows how long the high or low that started the trend remained unbroken. E.g. with period 20: Small triangle = 20+ candles, medium triangle = 40+ candles, big triangle = 80+ candles. So a big triangle marks an important reversal point.
How Hindsight Trend works
Whenever a candle completes, its high and low are saved as potentially "notable" points. A high or low is the more notable the longer it stays unbroken (= not touched again by price).
Now we simply take the notable highs and lows (as in, staying unbroken at least for the user-selected period)... and connect them together - if they are close enough to each other (less than "period" candles away). And decorate the first point in each trend with a triangle.
We only know whether a point is notable after "period" more candles have printed, so that's where the indicator's delay comes from.
Finally we divide the period by 2 and look at highs and lows which are unbroken for that shorter time. While they are not fully "notable" as defined above, we'll call them "semi-notable". Those points are only considered at the end of a trend, and help us extend the trend line a bit further.

QuasimodoThis indicator helps traders spot certain patterns on a price chart that might indicate a change in price direction. These patterns are known as "engulfing patterns."
How It Works1.
Bullish Engulfing Patterns:- The current bar (or candle) closes higher than it opens (it's a green or white candle).- The previous bar closed lower than it opened (it was a red or black candle).- The current bar's high is higher than the previous bar's high, and its low is lower than the previous bar's low.- There's another variation where both the current and previous bars are green, but the current bar is still higher and lower than the previous one.
2. Bearish Engulfing Patterns:- The current bar closes lower than it opens (it's a red or black candle).- The previous bar closed higher than it opened (it was a green or white candle).- The current bar's low is lower than the previous bar's low, and its high is higher than the previous bar's high.- There's another variation where both the current and previous bars are red, but the current bar is still higher and lower than the previous one.
What It Shows-
When the indicator spots one of these patterns, it colors the previous candle:-
Yellow for a bullish pattern (price might go up).-
Pink for a bearish pattern (price might go down).
Alerts- The indicator can also send an alert to let you know when it finds one of these patterns, so you don't miss it.

Inside Bar Setup [as]Inside Bar Setup Indicator Description
The **Inside Bar Setup ** indicator is a powerful tool for traders to identify and visualize inside bar patterns on their charts. An inside bar pattern occurs when the current candle's high is lower than the previous candle's high, and the current candle's low is higher than the previous candle's low. This pattern can indicate a potential breakout or a continuation of the existing trend.
Key Features:
1. **Highlight Inside Bar Patterns:**
- The indicator highlights inside bar patterns with distinct colors for bullish and bearish bars. Bullish inside bars are colored with the user-defined bull bar color (default lime), and bearish inside bars are colored with the user-defined bear bar color (default maroon).
2. **Marking Mother Candle High and Low:**
- The high and low of the mother candle (the candle preceding the inside bar) are marked with horizontal lines. The high is marked with a green line, and the low is marked with a red line.
- These levels are labeled as "Range High" and "Range Low" respectively, with the labels displayed a few bars to the right for clarity. The labels have a semi-transparent background for better visibility.
3. **Target Levels:**
- The indicator calculates and plots potential target levels (T1 and T2) for both long and short positions based on user-defined multipliers of the mother candle's range.
- For long positions, T1 and T2 are plotted above the mother candle's high.
- For short positions, T1 and T2 are plotted below the mother candle's low.
- These target levels are optional and can be toggled on or off via the input settings.
4. **Customizable Inputs:**
- **Colors:**
- Bull Bar Color: Customize the color for bullish inside bars.
- Bear Bar Color: Customize the color for bearish inside bars.
- **Long Targets:**
- Show Long T1: Toggle the display of the first long target.
- Show Long T2: Toggle the display of the second long target.
- Long T1: Multiplier for the first long target above the mother candle's high.
- Long T2: Multiplier for the second long target above the mother candle's high.
- **Short Targets:**
- Show Short T1: Toggle the display of the first short target.
- Show Short T2: Toggle the display of the second short target.
- Short T1: Multiplier for the first short target below the mother candle's low.
- Short T2: Multiplier for the second short target below the mother candle's low.
5. **New Day Detection:**
- The indicator detects the start of a new day and clears the inside bar arrays, ensuring that the pattern detection is always current.
#### Usage:
- Add the indicator to your TradingView chart.
- Customize the inputs to match your trading strategy.
- Watch for highlighted inside bars to identify potential breakout opportunities.
- Use the marked range highs and lows, along with the calculated target levels, to plan your trades.
This indicator is ideal for traders looking to capitalize on inside bar patterns and their potential breakouts. It provides clear visual cues and customizable settings to enhance your trading decisions.
Note:
This indicator is based on famous 15 min inside bar strategy shared by Subashish Pani on his youtube channel Power of stocks. Please watch his videos to use this indicator for best results.

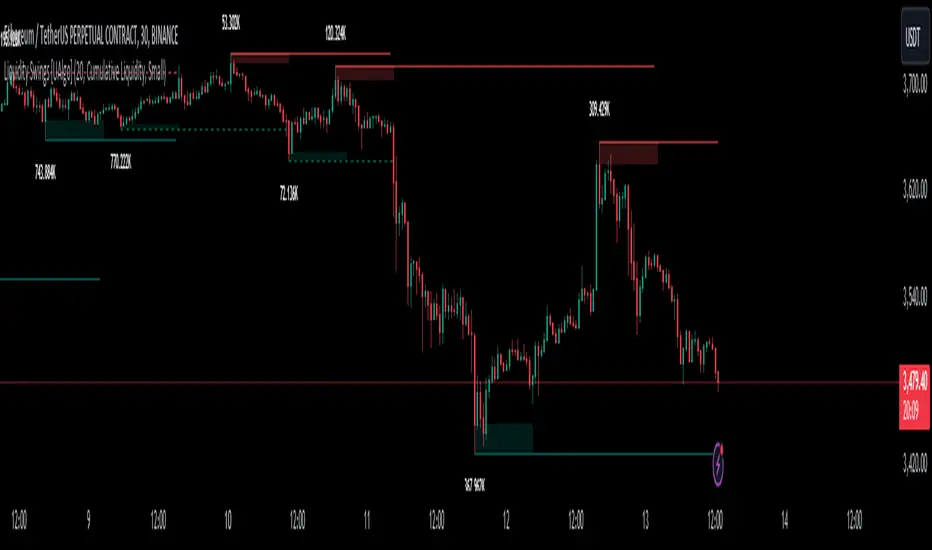
Liquidity Swings [UAlgo]The "Liquidity Swings " indicator is designed to help traders identify liquidity swings within the market. This tool is particularly useful for visualizing areas where liquidity is accumulating and where it is being swept, providing valuable insights for making informed trading decisions. By tracking the pivots in price and associating them with volume, the indicator highlights zones of potential support and resistance, helping traders understand market dynamics more clearly.
🔶 Key Features
Liquidity Swing Sensitivity: Adjustable sensitivity settings to fine-tune the detection of liquidity swings according to market conditions and trader preferences.
Two modes of liquidity calculation:
Cumulative Liquidity: Aggregates unswept liquidity over multiple swings until it is swept, providing a broader view of liquidity accumulation.
Individual Liquidity: Displays the accumulated liquidity for each swing independently, offering a more granular perspective.
Visual Customization: Options to customize the colors and sizes of liquidity lines, areas, and informational text for better visual clarity.
Dynamic Updates: The indicator dynamically updates liquidity zones and labels, adjusting to new market data to keep traders informed in real-time.
🔶 Disclaimer
The "Liquidity Swings " indicator is provided for educational and informational purposes only.
It should not be considered as financial advice or a recommendation to buy or sell any financial instrument.
The use of this indicator involves inherent risks, and users should employ their own judgment and conduct their own research before making any trading decisions. Past performance is not indicative of future results.
🔷 Related Scripts
Liquidity Sweeps
Williams %R Liquidity Sweeps
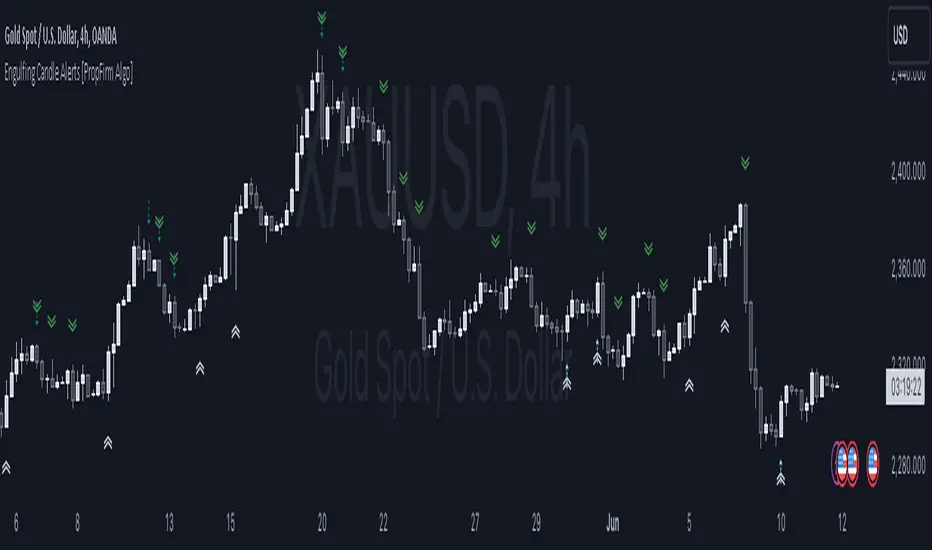
Engulfing Pattern Alerts By PropFirm AlgoWe have now decided to make this indicator to support the trading community! If you find yourself struggling to identify bullish engulfing and bearish engulfing candles, this one is for you.
Release Notes:
Initial release with robust detection of bullish and bearish engulfing patterns.
Added trend and volume filters for enhanced pattern accuracy.
Custom alerts for real-time notifications of potential trading opportunities.
Appendix 1 - Example Case of Use For Educational Study.
Appendix 2 - Technical description which focuses on explaining the functionality of the script, how the code works, and how it can be used by traders, providing further immediate insight value.
Appendix 1:
This indicator will provide you with Two types Bullish and Bearish Engulfing Alerts.
The Regular Bullish and Bearish Engulfing Candle's Shown As
Bullish Engulfing ︽
Bearish Engulfing ︾
And the Filtered Bullish and Bearish Engulfing Candle Shown As
Filtered Bullish Engulfing ⇡
Filtered Bearish Engulfing ⇣
You can also change the Alert Symbol to any text, symbol or emoji of choice in the Setting Style Panel . This allows you to customize the alert symbol style to your liking, Example....
Using the power of artificial intelligence, we coded this indicator based on technical descriptions to perfect this simple problem.
Use this tool together with different strategies as a confirmation to your trading bias.
Use Supply and Demand Zones together with the Engulfing Pattern Alerts
First, Verify if the bullish engulfing candle is at the end of a dying trend.
Secondly, Check if it’s at a major 1-hour, 4-hour, or daily support and resistance zone.
Then wait for the retest, then enter a position.
DON’T USE THE ENGULFING ALERT AS A POINT OF ENTRY, OR WHILE MARKETS ARE CONSOLIDATING nor in the middle of an active trend.
Now for the second most used method:
Use The Fibonacci together with the Engulfing Pattern Alerts
First, Identify an impulse candle that creates a new trend in the market.
Then Draw out your Fibonacci tool from the start of the candle to the end of the impulse leg where rejection is shown.
Wait for the price to retrace to the 61.8 retracement and use the engulfing candle as a second confirmation.
And lastly, wait for the price to retest the fib level showing signs of rejection, then enter.
Appendix 2:
Technical Description:
The "Engulfing Pattern Alerts By PropFirm Algo" script is a sophisticated tool designed to identify and alert traders of potential bullish and bearish engulfing patterns in the market, enhanced by trend and volume filters for improved accuracy. This script helps traders spot potential trend reversals by analyzing candlestick patterns in conjunction with volume data and moving averages.
Key Features:
Bullish Engulfing Pattern Detection: Identifies when a smaller bearish candle is followed by a larger bullish candle, indicating potential upward price movement.
Bearish Engulfing Pattern Detection: Identifies when a smaller bullish candle is followed by a larger bearish candle, indicating potential downward price movement.
Volume Filter: Enhances pattern reliability by ensuring the identified pattern is accompanied by a significant volume increase.
Trend Filter: Utilizes Simple Moving Averages (SMA) to filter patterns based on the prevailing market trend, reducing false signals on the "Filtered Engulfing Alerts" Setting.
Custom Alerts: Configurable alerts for both bullish and bearish engulfing patterns, allowing traders to stay informed in real-time.
How It Works:
Bullish Engulfing Pattern:
Detected when the body of the current candle completely engulfs the body of the previous candle.
Confirmed if the current candle closes higher than it opens, and the previous candle closes lower than it opens.
Volume on the current candle must be greater than the previous candle.
Bearish Engulfing Pattern:
Detected when the body of the current candle completely engulfs the body of the previous candle.
Confirmed if the current candle closes lower than it opens, and the previous candle closes higher than it opens.
Volume on the current candle must be greater than the previous candle.
Trend Filter:
Uses moving averages to determine the market trend.
Bullish patterns are only considered in downtrends.
Bearish patterns are only considered in uptrends.
Alerts:
Alerts can be set up for both bullish and bearish patterns, ensuring you are notified when significant market movements are detected.
How to Use:
Add the script to your chart.
Configure the alert settings according to your trading preferences.
Monitor your chart for plotted symbols indicating potential bullish (︽) and bearish (︾) engulfing patterns.
Utilize the alert conditions to get notified when these patterns occur.
Master Pattern [UAlgo]🔶 Description:
"Master Pattern by UAlgo" aims to identify and visualize "Master Patterns" in price movements on financial charts, and focusing on detecting liquidity levels and sweeps. The indicator provides users with the ability to customize settings such as master pattern detection and detection flexibility, sensitivity to liquidity levels, and visualization preferences.
🔶 What is the Master Pattern ?
The Master Pattern is a framework built around understanding market cycles, which include three main phases: Contraction, Expansion, and Trend.
Contraction Phase: During this phase, the market fluctuates less and consolidates within a narrow range. Institutional trading volumes tend to be low and it is recommended to avoid trading entries during this period.
Expansion Phase: volatility increases and prices fluctuate greatly. Institutional traders begin to establish positions at this stage and may manipulate prices to attract retail traders to create liquidity for their own buy or sell targets.
Trend Phase: The final phase that completes the market cycle. Institutional traders started taking profits, causing the trend to reverse. This triggered panic among retail traders, leading to liquidations and stop-losses. This creates liquidity from which institutional traders can profit, while retail traders' positions are overvalued.
🔶 Key Features:
Pattern Detection : The indicator detects and visualizes contraction patterns in price movements, helping traders identify potential areas of price consolidation.
Also traders can choose between different modes (Strict, Normal, Relax) for obtaining master patterns, providing flexibility in pattern identification based on individual trading strategies and preferences.
The Value/Expansion Line : This value line is considered by institutional traders as a potential “Point of Origin” for future price movements.
An Application Example of the Master Pattern :
Select the Appropriate Timeframes: A significant separation between the higher timeframe (HTF) and the lower timeframe (LTF) is essential. For instance, combinations like 4H and 15M, 4H and 5M, or 1H and 1M. You can change this according to your own strategy.
Trade Based on Contraction Box, Value Line and Liquidity: When the HTF is above value, look for buying opportunities on your LTF below value. Conversely, when the HTF is below value, seek selling opportunities on your LTF above value. Sweeping liquidity in LTF is also an important parameter.
Also Value/Expansion Line can also be used as Support/Resistance zone,
Liquidity Levels : The indicator includes functionality to detect and display liquidity levels on the chart.
Dashboard Display : A customizable dashboard provides users with key information, including liquidity levels, master pattern values, and whether the current price is above or below Master Pattern's value lines.
Additionally, when liquidity is swept or the price rises above or falls below the value line. this information can be displayed on the dashboard.
Customizable Settings: Users can adjust parameters such as the pattern detection mode, sensitivity to liquidity levels, liquidity type (cumulative or individual for each swing), visualization preferences for master patterns, the position and font size of the dashboard.
🔶 Disclaimer:
Use with Caution: This indicator is provided for educational and informational purposes only and should not be considered as financial advice. Users should exercise caution and perform their own analysis before making trading decisions based on the indicator's signals.
Not Financial Advice: The information provided by this indicator does not constitute financial advice, and the creator (UAlgo) shall not be held responsible for any trading losses incurred as a result of using this indicator.
Backtesting Recommended: Traders are encouraged to backtest the indicator thoroughly on historical data before using it in live trading to assess its performance and suitability for their trading strategies.
Risk Management: Trading involves inherent risks, and users should implement proper risk management strategies, including but not limited to stop-loss orders and position sizing, to mitigate potential losses.
No Guarantees: The accuracy and reliability of the indicator's signals cannot be guaranteed, as they are based on historical price data and past performance may not be indicative of future results.

EngulfScanEngulf Scan
Introduction:
The Engulf Scan indicator helps users identify bullish and bearish engulfing candlestick patterns on their charts. These patterns are often used as signals for trend reversals and are important indicators for traders. Engulf Scan signals are generated when an engulfing pattern is swallowed by another candlestick of the opposite color.The signal of a candle engulfment formation is generated when the 1st candle is engulfed by the 2nd candle and the 2nd candle is engulfed by the 3rd candle.
Features:
Bullish Engulfing Pattern: Indicates the start of an upward trend and typically signals that the market is likely to move higher.
Bearish Engulfing Pattern: Indicates the start of a downward trend and typically signals that the market is likely to move lower.
Color Coding: Users can customize the background colors for bullish and bearish engulfing patterns.
Usage Guide:
Adding the Indicator: Add the "Engulf Scan" indicator to your TradingView chart.
Color Settings: Choose your preferred colors for bullish and bearish engulfing patterns from the indicator settings.
Pattern Detection: View the engulfing patterns on the chart with the specified colors and symbols. These patterns help identify potential trend reversal points.
Parameters and Settings:
Bullish Engulfing Color: Background color for the bullish engulfing pattern.( Green)
Bearish Engulfing Color: Background color for the bearish engulfing pattern. (Red)
Examples:
Bullish Engulfing Example: On the chart below, you can see bullish engulfing patterns highlighted with a green background. (Green)
Bearish Engulfing Example: On the chart below, you can see bearish engulfing patterns highlighted with a red background. (Red)
Frequently Asked Questions (FAQ):
How are engulfing patterns detected?
Engulfing patterns are formed when a candlestick completely engulfs the previous candlestick. For a bullish engulfing pattern, a bullish candlestick follows a bearish one. For a bearish engulfing pattern, a bearish candlestick follows a bullish one.
Which timeframes work best with this indicator?
Engulfing patterns are generally more reliable on daily and higher timeframes, but you can test the indicator on different timeframes to see if it fits your trading strategy.
Can I detect a reversal or trend?
As can be seen in the image, it sometimes appears as a return signal and sometimes as a harbinger of an ongoing trend.But it may be a mistake to use the indicator only for these purposes. However, this indicator may not be sufficient when used alone. It can be combined with different indicators from the Tradingview library.
Updates and Changelog:
v1.0: Initial release. Added detection and color coding for bullish and bearish engulfing patterns.
-Please feel free to write your valuable comments and opinions. I attach importance to your valuable opinions so that I can improve myself.

Engulfing CandlesticksThe Engulfing Candlesticks indicator is a powerful tool for traders and investors to identify potential reversal patterns in financial markets. This indicator is based on the popular candlestick pattern recognition technique, which has been used for centuries to predict market trends and identify trading opportunities.
The Engulfing Candlesticks indicator specifically looks for two types of patterns: Bullish Engulfing and Bearish Engulfing. A Bullish Engulfing pattern occurs when a small bearish candle is followed by a larger bullish candle that completely engulfs the previous candle, indicating a potential reversal from a downtrend to an uptrend. On the other hand, a Bearish Engulfing pattern occurs when a small bullish candle is followed by a larger bearish candle that completely engulfs the previous candle, indicating a potential reversal from an uptrend to a downtrend.
The Engulfing Candlesticks indicator is designed to be easy to use and understand, even for traders who are new to candlestick pattern recognition. The indicator plots a yellow color for Bullish Engulfing patterns and a purple color for Bearish Engulfing patterns, making it easy to visualize and identify potential trading opportunities.
One of the key benefits of the Engulfing Candlesticks indicator is its ability to identify potential reversal patterns early, allowing traders to enter trades at the beginning of a new trend. This can be especially useful in markets that are highly volatile or subject to sudden changes in direction.
In addition to its ability to identify reversal patterns, the Engulfing Candlesticks indicator can also be used as a confirmation tool for other trading strategies. For example, a trader who is using a moving average crossover strategy may use the Engulfing Candlesticks indicator to confirm the validity of the signal.
The Engulfing Candlesticks indicator is also highly customizable, allowing traders to adjust the sensitivity of the indicator to suit their individual trading style. This can be especially useful for traders who are looking to trade in specific market conditions, such as during times of high volatility or in markets with low liquidity.
Overall, the Engulfing Candlesticks indicator is a powerful tool for traders and investors who are looking to identify potential reversal patterns and trading opportunities in financial markets. Its ease of use, customization options, and ability to identify early reversal patterns make it a valuable addition to any trading strategy.
Here are the settings for the Engulfing Candlesticks indicator:
Length: This setting determines the number of bars used to calculate the engulfing pattern. A higher value will result in more precise signals, but may also reduce the number of signals generated.
Color 0: This setting determines the color used for Bullish Engulfing patterns.
Color 1: This setting determines the color used for Bearish Engulfing patterns.
Bar Color: This setting determines whether the indicator will color the bars based on the engulfing pattern.
Alerts: This setting determines whether the indicator will generate alerts when an engulfing pattern is detected.
Note: These settings may vary depending on the specific trading platform or software being used.

Japanese Candlestick Pattern RecognizerJapanese candlestick patterns are a powerful tool in technical analysis, offering traders and investors a detailed view of price action and market sentiment.
1. Spinning Top
Description: The Spinning Top has a small candle body with long upper and lower shadows. This indicates that both buyers and sellers were active during the period, but neither took control. The close is near the open.
Significance: Signals indecision in the market. Can appear in both uptrends and downtrends and suggests that the current direction may be losing momentum.
Type: Neutral
2. Doji
Description: A Doji has almost equal opening and closing prices, meaning there was no clear direction during the period. It has long upper and lower shadows.
Significance: Signals indecision or a potential trend reversal. In the context of a strong trend, a Doji can indicate that the trend is losing strength.
Type: Neutral
3. White Marubozu
Description: A long white (or green) candle body with no shadows. Indicates that buyers were in control throughout the entire period.
Significance: Strongly bullish. A White Marubozu often signals the continuation of an uptrend or the start of a new uptrend.
Type: Bullish
4. Black Marubozu
Description: A long black (or red) candle body with no shadows. Indicates that sellers were in control throughout the entire period.
Significance: Strongly bearish. A Black Marubozu often signals the continuation of a downtrend or the start of a new downtrend.
Type: Bearish
5. Hammer
Description: A small candle body at the upper end of the trading range with a long lower shadow. Signals a bullish reversal after a downtrend.
Significance: Bullish reversal. The long lower shadow shows that sellers were strong during the day, but buyers managed to push the price back up.
Type: Bullish
6. Hanging Man
Description: A small candle body at the upper end of the trading range with a long lower shadow. Signals a bearish reversal after an uptrend.
Significance: Bearish reversal. The long lower shadow shows that sellers were strong during the day, suggesting that buyers may be losing strength.
Type: Bearish
7. Inverted Hammer
Description: A small candle body at the lower end of the trading range with a long upper shadow. Signals a bullish reversal after a downtrend.
Significance: Bullish reversal. The long upper shadow shows that buyers attempted to push the price up, indicating a potential trend reversal.
Type: Bullish
8. Shooting Star
Description: A small candle body at the lower end of the trading range with a long upper shadow. Signals a bearish reversal after an uptrend.
Significance: Bearish reversal. The long upper shadow shows that buyers tried to push the price higher, but sellers managed to drive it back down.
_____________________________________
Japanische Candlestick-Muster sind ein leistungsstarkes Werkzeug in der technischen Analyse, das Händlern und Investoren eine detaillierte Sicht auf die Kursentwicklung und Marktstimmung bietet.
1. Spinning Top
Beschreibung: Der Spinning Top hat einen kleinen Kerzenkörper und lange obere und untere Schatten. Dies zeigt, dass sowohl Käufer als auch Verkäufer während der Periode aktiv waren, aber keiner die Kontrolle übernommen hat. Der Schlusskurs liegt nahe dem Eröffnungskurs.
Bedeutung: Signalisiert Unentschlossenheit im Markt. Kann sowohl im Aufwärtstrend als auch im Abwärtstrend erscheinen und zeigt an, dass die aktuelle Richtung möglicherweise an Schwung verliert.
Typ: Neutral
2. Doji
Beschreibung: Ein Doji hat nahezu gleiche Eröffnungs- und Schlusskurse, was bedeutet, dass es während der Periode keine klare Richtung gab. Es hat lange obere und untere Schatten.
Bedeutung: Signalisiert Unentschlossenheit oder mögliche Trendumkehr. Im Kontext eines starken Trends kann ein Doji darauf hinweisen, dass der Trend an Kraft verliert.
Typ: Neutral
3. White Marubozu
Beschreibung: Langer weißer (oder grüner) Kerzenkörper ohne Schatten. Zeigt an, dass Käufer den ganzen Tag über die Kontrolle hatten.
Bedeutung: Stark bullisch. Ein White Marubozu signalisiert oft die Fortsetzung eines Aufwärtstrends oder den Beginn eines neuen Aufwärtstrends.
Typ: Bullish
4. Black Marubozu
Beschreibung: Langer schwarzer (oder roter) Kerzenkörper ohne Schatten. Zeigt an, dass Verkäufer den ganzen Tag über die Kontrolle hatten.
Bedeutung: Stark bärisch. Ein Black Marubozu signalisiert oft die Fortsetzung eines Abwärtstrends oder den Beginn eines neuen Abwärtstrends.
Typ: Bearish
5. Hammer
Beschreibung: Kleiner Kerzenkörper am oberen Ende der Handelsspanne, langer unterer Schatten. Signalisiert eine bullische Umkehr nach einem Abwärtstrend.
Bedeutung: Bullische Umkehr. Der lange untere Schatten zeigt an, dass die Verkäufer während des Tages stark waren, aber die Käufer konnten den Preis zurück nach oben treiben.
Typ: Bullish
6. Hanging Man
Beschreibung: Kleiner Kerzenkörper am oberen Ende der Handelsspanne, langer unterer Schatten. Signalisiert eine bärische Umkehr nach einem Aufwärtstrend.
Bedeutung: Bärische Umkehr. Der lange untere Schatten zeigt an, dass die Verkäufer während des Tages stark waren, was darauf hindeutet, dass die Käufer an Kraft verlieren könnten.
Typ: Bearish
7. Inverted Hammer
Beschreibung: Kleiner Kerzenkörper am unteren Ende der Handelsspanne, langer oberer Schatten. Signalisiert eine bullische Umkehr nach einem Abwärtstrend.
Bedeutung: Bullische Umkehr. Der lange obere Schatten zeigt, dass die Käufer versucht haben, den Preis nach oben zu treiben, und dies könnte auf eine bevorstehende Trendumkehr hinweisen.
Typ: Bullish
8. Shooting Star
Beschreibung: Kleiner Kerzenkörper am unteren Ende der Handelsspanne, langer oberer Schatten. Signalisiert eine bärische Umkehr nach einem Aufwärtstrend.
Bedeutung: Bärische Umkehr. Der lange obere Schatten zeigt, dass die Käufer versucht haben, den Preis weiter nach oben zu treiben, aber die Verkäufer konnten den Preis wieder nach unten drücken.
Typ: Bearish

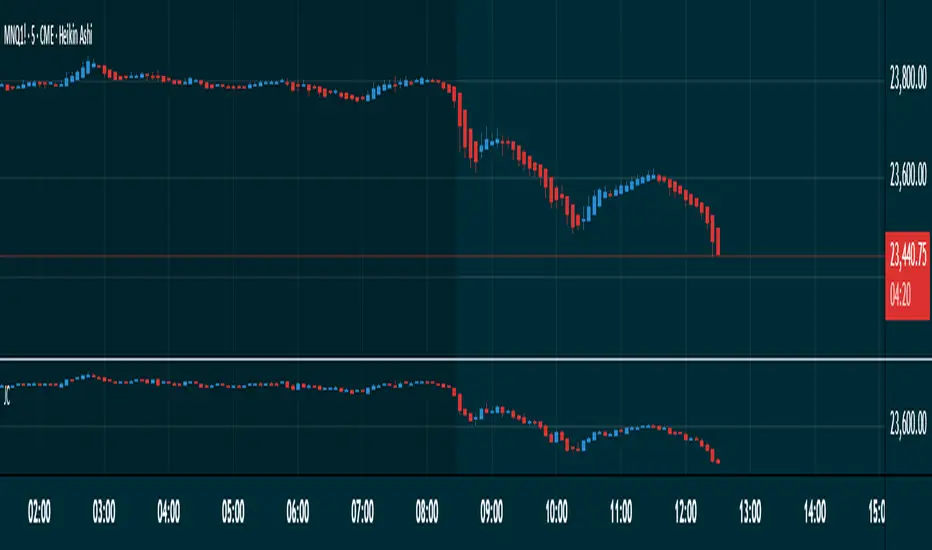
Japanese CandlesSimple script to add standard Japanese candles in a new pane for use when using a non-standard chart (Ex: Heikin Ashi) that doesn't use true OHLC values in it's calculation so that you can still monitor true values and activity without having to take up the screen real estate that using a layout containing a whole new chart would require. This also makes horizontal sync of the main chart to the Japanese candle chart perfect at all times.
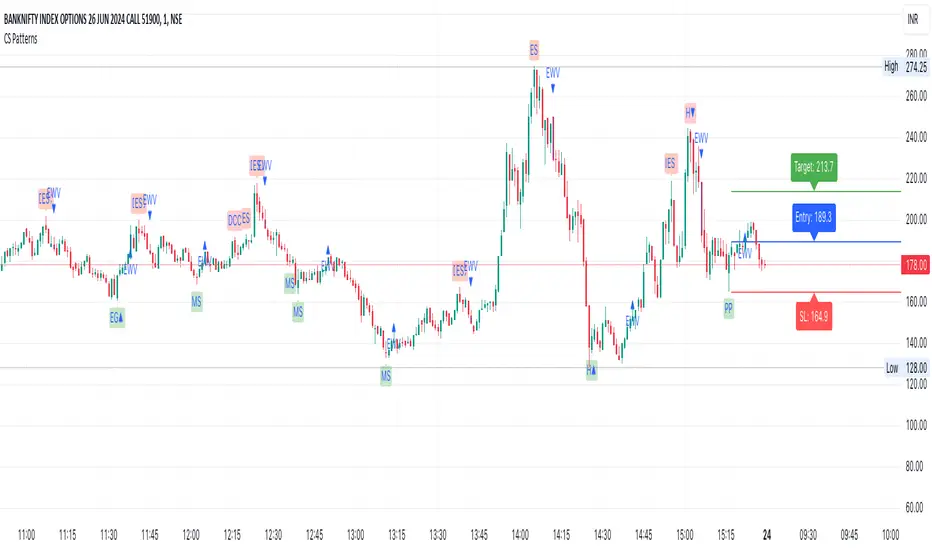
CS PatternsOverview
The CS Patterns indicator is designed to identify and highlight various candlestick patterns on a trading chart. Candlestick patterns are a crucial tool for traders as they help in predicting market movements and potential reversals. This indicator includes single, double, and triple candlestick patterns without revealing the source code, making it an ideal tool for traders who want to utilize advanced pattern recognition while keeping the script proprietary.
Candlestick Patterns Included
Single Candlestick Patterns
Bullish Hammer:
Found at the bottom of a downtrend.
Features a small body, long lower shadow, and little to no upper shadow.
Indicates potential reversal to an uptrend.
Bearish Hanging Man:
Found at the top of an uptrend.
Similar structure to the Bullish Hammer but indicates a potential reversal to a downtrend.
Bullish Inverted Hammer:
Found at the bottom of a downtrend.
Features a small body, long upper shadow, and little to no lower shadow.
Suggests a potential reversal to an uptrend.
Bearish Shooting Star:
Found at the top of an uptrend.
Indicates a potential reversal to a downtrend.
Dragonfly Doji:
Small or non-existent upper shadow and long lower shadow.
Indicates a potential reversal when found at the bottom of a trend.
Gravestone Doji:
Long upper shadow and small or non-existent lower shadow.
Indicates a potential reversal when found at the top of a trend.
Standard Doji:
Very small body, indicates indecision in the market.
Can signal reversals when found at the tops or bottoms of trends.
Long-Legged Doji:
Long upper and lower shadows with a small body.
Indicates a potential market reversal.
Double Candlestick Patterns
Bullish Engulfing:
A smaller bearish candle followed by a larger bullish candle that engulfs it.
Indicates a potential reversal to an uptrend.
Bearish Engulfing:
A smaller bullish candle followed by a larger bearish candle that engulfs it.
Indicates a potential reversal to a downtrend.
Bullish Harami:
A large bearish candle followed by a smaller bullish candle within its range.
Indicates a potential reversal to an uptrend.
Bearish Harami:
A large bullish candle followed by a smaller bearish candle within its range.
Indicates a potential reversal to a downtrend.
Bullish Piercing Line:
A bearish candle followed by a bullish candle that closes above the midpoint of the previous candle.
Indicates a potential reversal to an uptrend.
Bearish Dark Cloud Cover:
A bullish candle followed by a bearish candle that closes below the midpoint of the previous candle.
Indicates a potential reversal to a downtrend.
Bullish Inside Bar:
A smaller bullish or bearish candle completely within the range of the previous bearish candle.
Indicates a potential continuation or reversal to an uptrend.
Bearish Inside Bar:
A smaller bullish or bearish candle completely within the range of the previous bullish candle.
Indicates a potential continuation or reversal to a downtrend.
Triple Candlestick Patterns
Bullish Morning Star:
A bearish candle followed by a smaller-bodied candle (bullish or bearish), and then a larger bullish candle.
Indicates a potential reversal to an uptrend.
Bearish Evening Star:
A bullish candle followed by a smaller-bodied candle (bullish or bearish), and then a larger bearish candle.
Indicates a potential reversal to a downtrend.
How to Use?
Adding the Indicator:
Open TradingView and go to the Pine Script Editor.
Copy and paste the provided code into a new script.
Save and add the script to your chart.
Interpreting the Signals:
The indicator will highlight the patterns on the chart with specific labels.
Use these visual cues to make informed trading decisions based on potential reversals or continuations indicated by the patterns.
Customizing the Settings:
The indicator allows for customization of various settings through input options.
Adjust these settings according to your trading strategy and preferences.