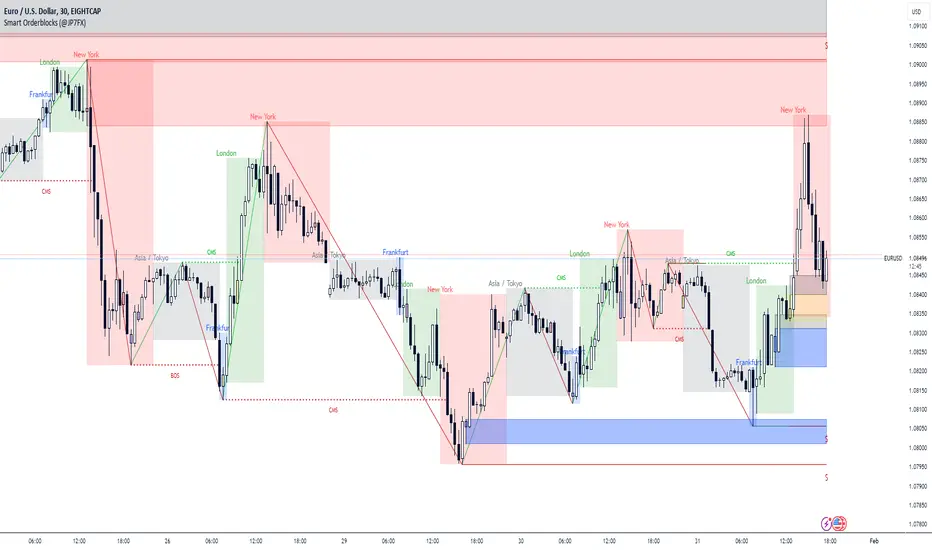
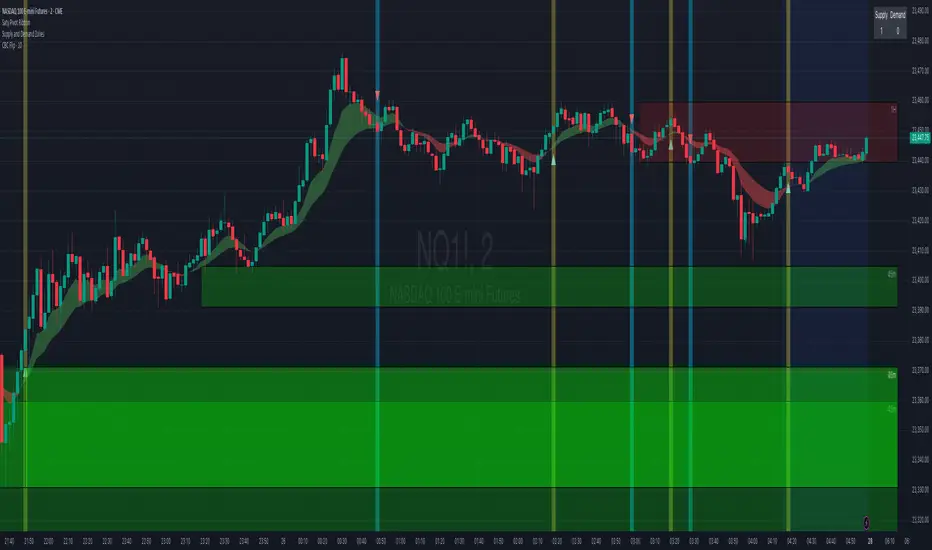
Smart Orderblocks / Supply and Demand (@JP7FX)
"Smart" Order Block Supply and Demand Indicator – a tool inspired by Smart Money Concepts and designed to complement your trading style.
It's not about perfection, but rather about enhancing your trading insights and catching things you might have missed.
Keep in mind that the structural representation here is subjective, just like many other indicators. It's more of a guide to help you navigate the market.
While it doesn't explicitly include Imbalance / FVG, you have the flexibility to use additional Imbalance /FVG indicators, including my own, to complement the insights drawn from Supply and Demand zones.
This indicator offers customisation options like trading ranges, allowing you to mark Killzones and tailor it to your preferences. Explore liquidity levels, 50% retracement lines, and personalize the colors and lines to match your unique chart setup.
Guide below on how the "Hidden" Zones are created!
Trade Safe :)
K線分析
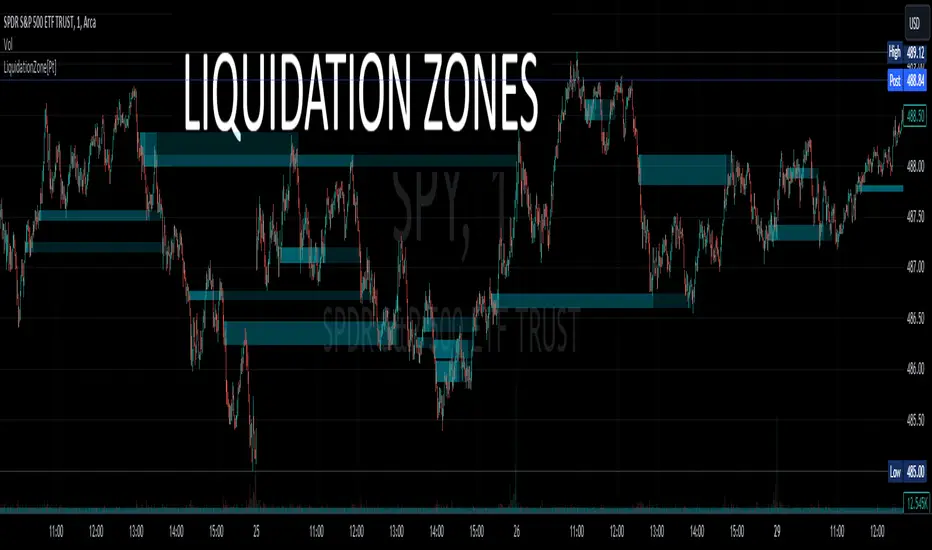
Liquidation Zone [Pt]█ Introduction
The Liquidation Zone indicator is designed to identify key price ranges where significant market activity, such as the liquidation of positions, is likely to occur. These zones are identified based on a specific candlestick pattern, offering insights into potential areas of market sensitivity.
█ Key Features:
► Specific Candlestick Pattern Identification: The indicator identifies liquidation zones by detecting a pattern where a red candle is encased within a series of green candles (in bullish scenarios) or a green candle within red candles (in bearish scenarios). This pattern often suggests a point where the market pauses to liquidate positions before continuing the prevailing trend.
► Market Reaction Points: These liquidation zones represent significant levels where the market previously decided to liquidate or adjust positions, indicating potential areas where price might react upon revisit.
► Integration with Volatility and Volume Data: The script combines these candlestick patterns with volatility (using ATR) and volume data, adding depth to the analysis and increasing the reliability of these zones as potential reaction areas.
► Visual Zone Mapping on Charts: Liquidation Zones are clearly marked on the trading chart for easy identification, aiding traders in visualizing these critical market areas.
█ Possible Use Cases
► Identifying Potential Reaction Areas
Traders can use the Liquidation Zone indicator to pinpoint zones where the market might pause or reverse due to previous liquidation activities. These areas can be key for planning entries, exits, or expecting increased market volatility.
► Enhancing Trading Strategy
Incorporating the analysis of liquidation zones into a trading strategy allows for a more nuanced understanding of market behavior, particularly in recognizing potential areas where price might experience significant support or resistance.
► Complementing Technical Analysis
This indicator is a valuable addition to a technical analyst's toolkit. When used alongside other analysis tools, it provides a more comprehensive view of the market, enhancing decision-making and strategy formulation.
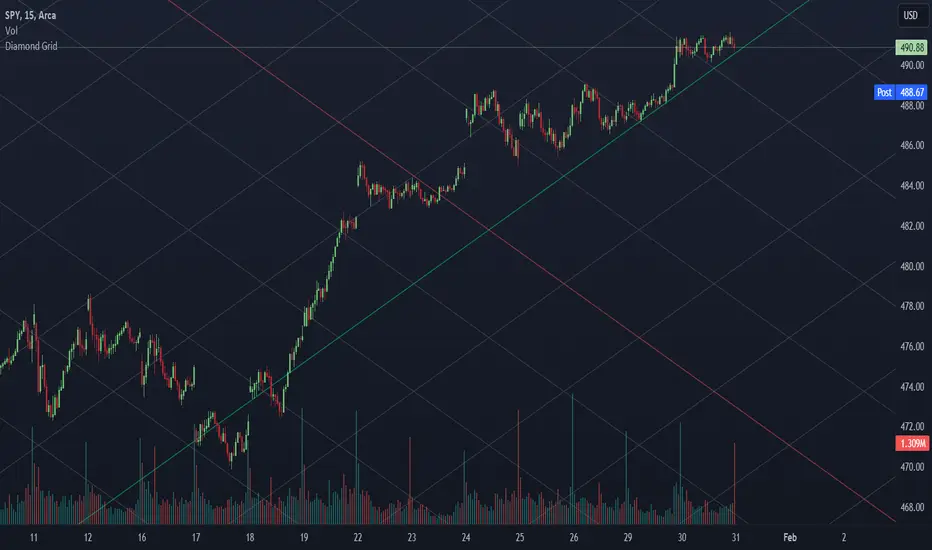
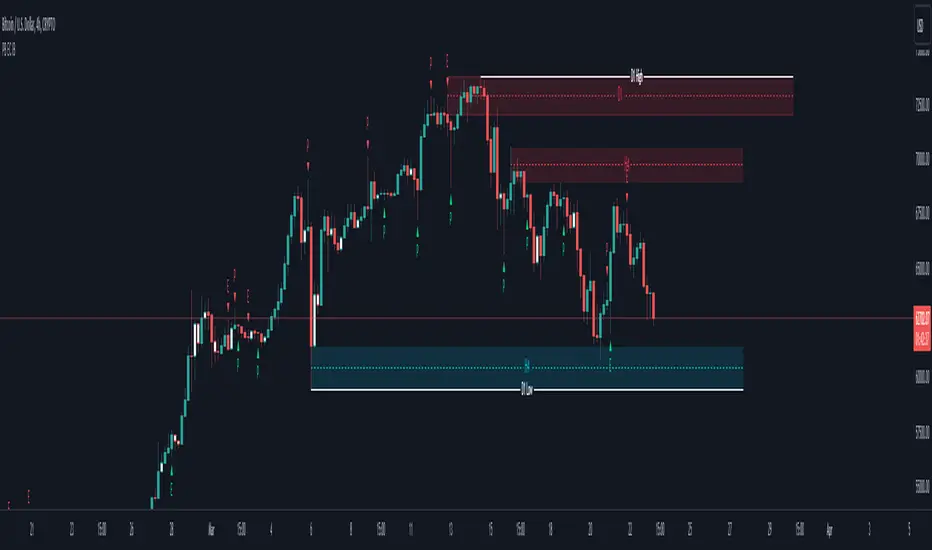
Diamond Grids @shrilssUncover hidden patterns and potential reversal zones with the Diamond Grids Indicator. This script introduces a unique approach to visualizing price extremes within a specified range, aiding traders in identifying critical support and resistance levels. The indicator dynamically calculates and displays diamond-shaped grids based on user-defined short and long lengths and ATR. Utilize this powerful tool to enhance your technical analysis and gain insights into potential trend reversals.
Key Features:
- Dynamic Grid Calculation: The indicator dynamically calculates and plots diamond-shaped grids based on specified short and long lengths. These grids represent key price extremes within the defined range.
- Multi-Level Support and Resistance: Each diamond grid consists of multiple support and resistance lines, providing a comprehensive view of potential reversal zones. Traders can use these levels to make informed decisions.
- Customizable Parameters: Tailor the indicator to your trading style with customizable parameters such as short length, long length, and a multiplier. Adjust these settings to align the indicator with your unique preferences.
- Real-Time Updates: The indicator updates in real-time, ensuring that traders have the latest information on potential reversal zones. Stay ahead of market movements and make timely decisions.
- Toggle Trend Visualization: Diamond-shaped grids are color-coded for easy interpretation. Positive and negative grid lines are distinctly marked, offering a clear visual representation of the overall trend.
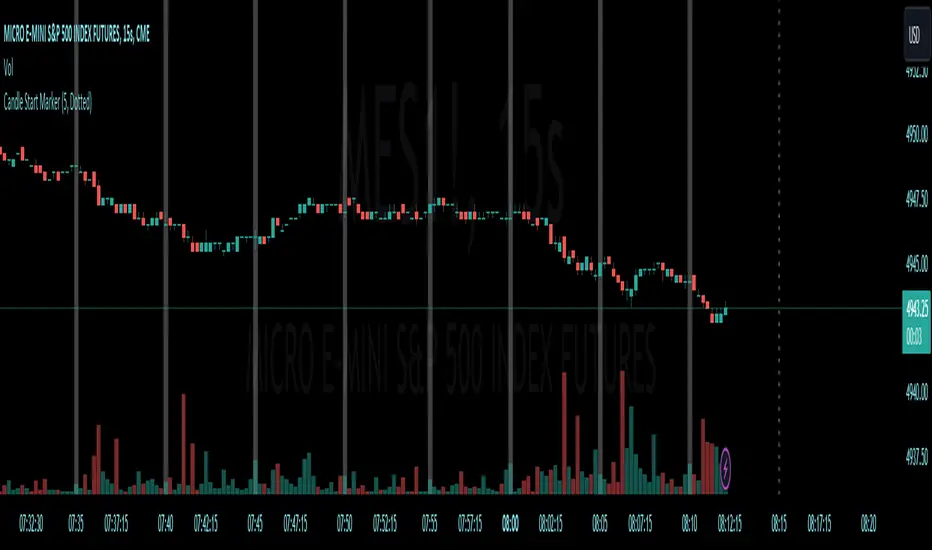
[CS] HTF Candle Start MarkerHello Traders!
I was using this script personally and thought it may be helpful to others that trade much lower timeframes. This script is particularly useful for traders who monitor price movements across multiple timeframes or need to synchronize their strategies with the start of new candle open.
Features:
User-Selectable Timeframe : Users can select the desired timeframe for the candle start marker, ranging from 1 to 60 minutes.
Start-of-Period Visualization : The indicator works by highlighting the background color at the start of each new candle for the chosen timeframe. This visual cue is particularly helpful for identifying the commencement of new trading intervals on lower timeframe charts.
Intelligent Timeframe Adaptation : A unique feature of this indicator is its ability to disable the marking on charts where the selected timeframe is equal to or higher than the chart's current timeframe. This ensures that the marker is only active when it provides meaningful information, avoiding redundancy on higher timeframe charts.
Usage:
This indicator is ideal for low time frame traders and those employing multi-timeframe analysis. It helps in quickly identifying the start of new time intervals. For example I trade the 15 second timeframe and mark the start of every 5 minute candle.
Candle Color By OHLC ComparisonThis indicator is designed to help you recognize the price movements within a candle/bar more quickly and easily. Typically, candle coloring is based on the opening and closing prices, but in this indicator, I followed the OHLC values in reverse order: starting with closing, low, high, and then opening. Each of these is compared with the value in the previous candle. I assigned the least importance to the opening, hence did not include it in the color determination. To make the colors memorable, I used a rainbow-like color scale; with purple representing the highest value and maroon the lowest. You can also change the colors if you wish. Additionally, if you want to set alarms, I assigned values to the candles; the highest being 16 and the lowest 1. A thicker barchart provides a better visual representation.
For instance, consider the monthly chart of the NASDAQ 100. After a prolonged positive trend, when our indicator shows a negative maroon bar (representing a low value) for the first time, it could signal a change in the trend direction. In this scenario, the appearance of the maroon bar serves as a crucial alert for investors to review their current positions or prepare for a potential downtrend. This indicator provides users with a significant advantage in identifying such critical turning points and assists them in quickly adapting to market dynamics.

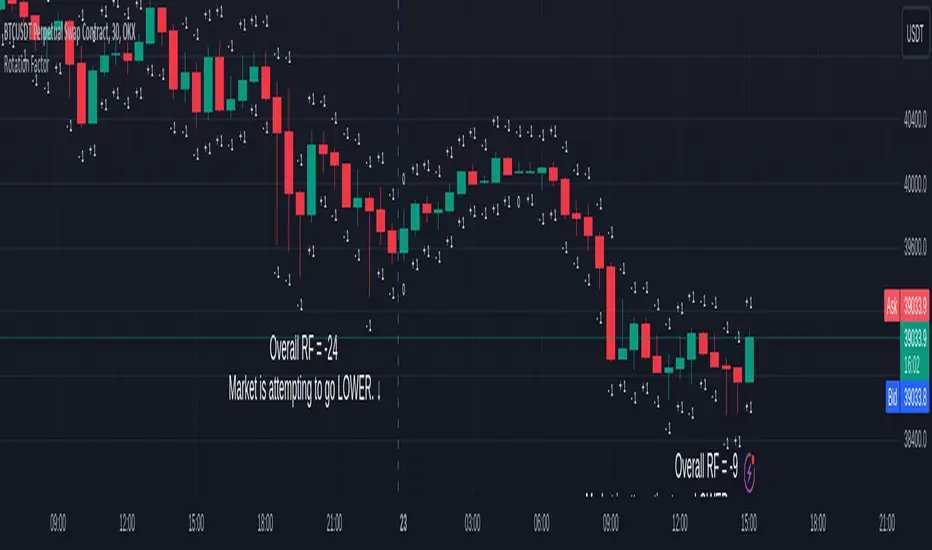
Rotation Factor for TPO and OHLC (Classic)The Rotation Factor objectively measures attempted market direction(or market sentiment) for a given period. It records the cumulative directional attempts of auction rotations within a given period, thus, helping traders determine which way the market is trying to go and which market participant is exerting greater control or influence.
Theory
The premise is that a greater number of bars auctioning higher contrasted to bars auctioning lower indicates that buyers are exerting greater control over price within the given period(usually daily). In this case, the market is attempting to go higher (Market is Bullish). The same is true for a greater number of bars auctioning lower than higher, which, in this case, indicates that the sellers are exerting greater control over price within the given period and that the market is attempting to go lower (Market is Bearish).
Calculation
Each bar is individually measured in relation to the immediate previous bar, and calculations are reset at the beginning of each period.
For every bar, two variables are utilised: One for the highs and another for the lows. During bar start, these variables are initiated at 0.
As the period progresses, these variables are set accordingly: If the high of the current bar is higher than that of the previous bar, then the bar's highs variable is assigned a "+1". If the opposite is true, it is given a "-1". Finally, if both bar highs are equal, it is, instead, assigned a "0". The same is true for the lows: if the low of the current bar is higher than that of the previous low, then the bar's lows variable is assigned a "+1". Similarly, the opposite is given a "-1", while equal lows causes it to be assigned a "0". All highs and lows are then summed together resulting to a total, which becomes the Rotational Factor.
Presentation
Furthermore, this Rotation Factor Indicator is presented as it is calculated, which is the presentation utilised by classic sources (hence the name classic).
Features
1. Customisable Tick Size/Granularity : The calculation tick size/ granularity is customisable which can be accessed through the indicator settings.
2. Customisable Labels : The colour and sizes used by the labels are customisable the better for accessibility.
3. Period Separator : A separator is rendered to represent period borders (start and end). If separators are already present on your chart, you can remove them from the indicator settings.
Works for both split Market Profile(TPO) charts and regular OHLC bars/candle charts
The Rotation Factor is usually used with a Split Market Profile (TPO). However, if no such tool is available, you will still be able to benefit from the Rotation Factor as the price ranges of Split Market Profiles and OHLC bars/candles are one and the same. In such cases, it is recommended that you set your chart to use a 30 minute timeframe and the indicator's period to "daily" to simulate a Split Market Profile.
Note :
The Rotation Factor is, to quote, "by no means not an all-conclusive indication of future market direction.". It only helps determine which way the market is trying to go by objectively measuring the market's directional attempts.
Pin Bar, Inside Bars and Engulfing Candle SticksIntroducing the Candlestick Pattern Plotter, a comprehensive TradingView indicator designed to elevate your technical analysis by automatically identifying and plotting three essential candlestick patterns – Pin Bars, Engulfing Candles, and Inside Bars. This powerful tool equips traders with a holistic view of market dynamics, enabling them to make informed decisions based on key price action signals.
Pin Bar Identification:
The indicator adeptly recognizes Pin Bars, a pivotal candlestick pattern characterized by a small body and a long wick in the opposite direction of the prevailing trend.
Pin Bars are instrumental in signaling potential trend reversals or continuations, providing crucial insights for strategic decision-making.
Engulfing Candle Detection:
Identify Engulfing Candles effortlessly with this indicator, showcasing instances where the body of one candle fully engulfs the body of the previous candle.
Engulfing Candles serve as powerful reversal indicators, offering valuable insights into shifts in market sentiment and potential trend reversals.
Inside Bar Recognition:
The indicator goes beyond traditional patterns by identifying Inside Bars, where the range of a candle is entirely within the previous candle's high and low.
Inside Bars often signify consolidation or a period of indecision in the market, providing traders with crucial information about potential breakouts or reversals.
Seamlessly integrate the Candlestick Pattern Plotter into your TradingView chart, enjoying a user-friendly interface for swift interpretation of candlestick patterns.
Toggle the display of Pin Bars, Engulfing Candles, and Inside Bars on and off with ease, allowing you to focus on the specific patterns most relevant to your analysis.
Real-Time Alerts:
Stay ahead of the market with real-time alerts that notify you when a Pin Bar, Engulfing Candle, or Inside Bar is identified on the chart.
Timely notifications keep you informed, ensuring you never miss a potential trading opportunity based on these crucial candlestick patterns.
Enhance your trading strategy with the precision of Pin Bars, Engulfing Candles, and Inside Bars, seamlessly integrated into your analysis through the Candlestick Pattern Plotter. Gain a comprehensive understanding of market movements and make well-informed decisions in real-time.
Advanced Engulfing CandlesThere are a plenty of Engulfing candle detecting indicators but every single of them detect engulfing candles engulfed by only single candle but sometime it take more then one candle to engulf the previous opposite candle, which is also considered as engulfing candle.
So this script show both type of candles.
Type of Engulfing Candles
Normal Engulfing Candles
Candle engulfed by more then one continuous candle
I hope you will like it.
If you find any bugs or have any suggestions for any possible addition feel free to comment or DM me.

PinBar and Bloom Pattern Concept (Zeiierman)█ Overview
The Precision PinBar and Bloom Pattern Concept by Zeiierman introduces two new patterns, which we call the Bloom Pattern and the Precision PinBar Pattern. These patterns are used in conjunction with market open, high, and low values from different periods and timeframes. Together, they form the basis of the "PinBar and Bloom Pattern Concept." The main idea is to identify key bullish and bearish candlestick patterns around key levels plotted on the chart.
The key levels are the Open, High, and Low from the current and previous periods of the selected timeframe. Users can choose how many previous periods to be drawn on the chart.
█ How It Works
The indicator operates by analyzing market data over selected timeframes. It uses inputs such as previous period open-high-low lines, timeframe selections, and pattern detection settings like Symmetry Precision and Range Threshold. These parameters allow the indicator to identify specific market conditions, including symmetrical movements in price and significant price range deviations, which form the basis of the Bloom and Precision PinBar patterns.
Symmetry Signal:
Purpose: To detect symmetry in price movements based on a precision threshold.
How It Works: This function calculates the symmetry of high and low prices within the specified precision. It returns two boolean values indicating whether the high and low prices are within the symmetry precision.
BaselineBound Pattern:
Purpose: To identify bullish or bearish patterns based on a range factor.
How It Works: The function calculates whether the current close price is within a certain range of the high-low difference of the previous period. It returns bullish and bearish signals based on these calculations.
█ ● Bloom Pattern
The Bloom Pattern is a unique candlestick pattern designed to identify significant trend reversals or continuations. It's not a single candlestick formation but a combination of a few elements that signal a potential strong move in the market.
⚪ Previous and Current Candle Analysis: The Bloom Pattern looks at the relationship between the current candle and the previous one. It checks whether the current candle's body (the range between its opening and closing prices) fully encompasses the body of the previous candle. This condition is known as "embodying."
⚪ Baseline Bound: The Baseline Bound concept involves comparing the closing price to a range established by the high and low of the previous candle, adjusted by a factor (the rangeFactor). This helps in identifying if the current price is showing a bullish or bearish tendency relative to the previous period's price movement.
⚪ Symmetry Signal: Additionally, it uses the Symmetry Signal, which measures the symmetry between the high and low prices of two consecutive candles.
⚪ Bullish and Bearish Signals: The combination of these conditions (embodying, baseline bound, and symmetry) results in either a bullish or bearish signal. A bullish signal suggests a potential upward trend, while a bearish signal indicates a possible downward trend.
█ ● Precision PinBar Pattern
The Precision PinBar Pattern is a refined version of the traditional Pin Bar, a well-known candlestick pattern used in trading. This pattern focuses on identifying market reversals with a high degree of accuracy.
⚪ Identification of Pin Bars: The function first identifies a pin bar, characterized by a small body and a long wick. The long wick indicates a rejection of certain price levels, and the small body shows little change between the opening and closing prices.
⚪ Tail and Body Length Analysis: The script calculates the length of the bar's tail (wick) and compares it to the length of the body. A qualifying pin bar typically has a tail at least three times longer than its body, suggesting a strong rejection of prices.
⚪ Positioning and Thresholds:
Open-Close Position: The function checks whether the opening and closing prices are within a certain threshold of the high or low of the bar, which helps in distinguishing between bullish and bearish pin bars.
⚪ Baseline Bound and Symmetry: Like the Bloom Pattern, it incorporates Baseline Bound and Symmetry Signal concepts to validate the significance of the pin bar.
⚪ Bullish and Bearish Signals: Depending on these factors, a bullish or bearish pin bar is identified. A bullish PinBar suggests potential upward price movement, while a bearish PinBar indicates possible downward price movement.
█ How to Use
Using the Bloom and Precision PinBar patterns in conjunction with key market levels, such as previous highs and lows, can be a powerful strategy for traders. These market levels often act as significant points of support and resistance, and combining them with the patterns can offer strong trade signals. Here's how traders can effectively utilize these patterns:
Identifying Key Market Levels
Previous Highs and Lows: These are the highest and lowest points reached in previous trading periods and are often considered strong levels of resistance (in the case of previous highs) and support (in the case of previous lows).
Using the Bloom Pattern
Near Previous Highs (Resistance): If a Bloom Pattern emerges near a previous high, it could indicate a potential bearish reversal. Traders might interpret this as a signal to consider short positions, especially if the pattern shows bearish characteristics.
Near Previous Lows (Support): Conversely, a bullish Bloom Pattern near a previous low could suggest a trend reversal to the upside. This could be a signal for traders to consider long positions.
Using the Precision PinBar Pattern
Precision PinBar at Resistance: A bearish Precision PinBar appearing near a previous high can be a strong signal for a potential downward move. This setup is often used by traders to enter short positions, anticipating a price rejection at this resistance level.
Precision PinBar at Support: Similarly, a bullish Precision PinBar at or near a previous low suggests that the market is rejecting lower prices, indicating potential upward momentum. This is typically used by traders as a cue to go long.
█ Settings
Previous Open-High-Low Lines: Determine the number of historical periods to analyze. Settings include toggling the visibility of lines and labels and specifying the number of periods.
Timeframe & Current Period: Select the timeframe for current market analysis. Options include different timeframes (e.g., 1H, 1D) and customization of line styles and colors.
Pattern Settings: Adjust the Symmetry Precision and Range Threshold to fine-tune the indicator's sensitivity to specific market movements.
Bloom & Precision PinBar Pattern: Enable or disable the detection of specific patterns and customize the visual representation of these patterns on the chart.
-----------------
Disclaimer
The information contained in my Scripts/Indicators/Ideas/Algos/Systems does not constitute financial advice or a solicitation to buy or sell any securities of any type. I will not accept liability for any loss or damage, including without limitation any loss of profit, which may arise directly or indirectly from the use of or reliance on such information.
All investments involve risk, and the past performance of a security, industry, sector, market, financial product, trading strategy, backtest, or individual's trading does not guarantee future results or returns. Investors are fully responsible for any investment decisions they make. Such decisions should be based solely on an evaluation of their financial circumstances, investment objectives, risk tolerance, and liquidity needs.
My Scripts/Indicators/Ideas/Algos/Systems are only for educational purposes!

Crypto Candlestick Patterns - CN VersionIntroduction:
The candlestick chart has been used for centuries since the Japanese applications. Based on the candlestick charting, people developed candle pattern analysis. Now we have tons of books or articles illustrating the usage of reversal patterns and continuation patterns, and computers provide a faster and preciser way to recognize these pattern.
Originally we have a common *All Candlestick Patterns* indicator to use. This indicator works well for most of the markets or commodities including stocks and futures. However, for cryptocurrency market, quite a few patterns are not suitable anymore. For example, crypto markets are continuously running 7x24hrs and the big coins with good volume tend to have almost continuous price in commonly used time periods. Hence, original patterns with "window" or "jump" concepts are usually not applied to crypto.
For these issues, I modified the original *All Candlestick Patterns* indicator and introduced the Chinese version for people speaking such language.
Like most of the other indicators, I personally do not recommend anyone to simply follow the patterns it shows to enter the market. You may take these recognized patterns as a reference, and further actions on trading should be done with several other tools, such as MACD, RSI, Stochastic and etc.
Usage:
The application of this indicator is basically the same as the original *All Candlestick Patterns* and you will get an automatically generated pattern recognition by your computer system.
There are a few parameters to adjust for the indicator:
Trending Detection Settings: Here you can choose SMA-Fast, SMA-Fast/Slow or None detecting options to recognize the current market trend. This is a minor improvement from the original indicator and you can choose your preferred trending detecting settings by changing the length of SMA.
Candlestick Settings: You may adjust the rules to recognize the properties of candlesticks. I add a "perturbation" parameter here, which actually is an error tolerance for pattern recognition. Some seemingly pattern may not fulfill the strict rules of classic candlestick patterns, but we may recognize them by watch the charting on our own. Hence this error tolerance may show more potential patterns from the charting.
Plot Settings: It is the usually colour choice and providing options for bullish/bearish.
Pattern Settings: Here you can select the patterns that you would like to see from the charting. You can pick the preferred reversal patterns or choose to show all the patterns. It's all up to you!
Features:
Language Translation: Since this is a Chinese language version. I have replaced all the English explanation of patterns to Chinese ones. Move your mouse to the label, you will find a brief intro of the pattern and a notice about bullish or bearish signals it indicates.
Alerts: As the same as the original one, we will have the alert options from this indicator. All the alerts and their messages are Chinese. You can activate alerts based on this indicator from the alert management section, as the same as many other indicators you have used before.
Future Improvements:
For now I am satisfied with the work I have done, and I may apply it to several charts. It's welcome for any users to take a look at the codes and put modifications or improvements towards it. Currently most of the comments in the code are in Chinese language, since basically it's for Chinese speaking users, while the code itself and the parameter names should be pretty easy to understand in English. (I have been using English for writing in the past 8 years, hence this introduction is in English as well.)

Inside Bars/Candles [CodeCraftedTrading]This Pine Script indicator is designed to identify and visually represent inside bars or candles. Here's a breakdown of its features and functionality:
1. Inputs:
insideCandlesColor: Color of the inside bars or candles.
highColor: Color of the horizontal line representing the high of the inside bar.
lowColor: Color of the horizontal line representing the low of the inside bar.
showHighLowLabel: Option to display labels for the high and low prices.
2. Logic:
The script checks for the conditions of an inside bar:
high < high and low > low
If an inside bar is detected and is not already in the range:
* Stores the high and low prices of the previous bar.
* Records the parent bar index and sets the broken flag to false.
If the current bar's high exceeds the stored high or the low falls below the stored low, the broken flag is set to true.
If the current bar is within the stored high and low range, it is considered in-range.
The script then dynamically plots horizontal lines at the high and low prices of the parent bar until the inside bar is broken.
3. Visualization:
The inside bars are colored based on the insideCandlesColor.
Horizontal lines are drawn at the high and low prices of the parent bar within the inside bar.
Optional labels display the rounded values of the high and low prices.
4. Usage:
Apply the script to your chart.
Adjust the input parameters according to your preferences.
The indicator will highlight inside bars with colored bars and draw lines representing the high and low prices. Labels are optional.
5. Note:
Inside bars are bars where the entire price range is within the high and low of the previous bar.
The script uses historical bar information and visualizes the inside bars dynamically on the chart.

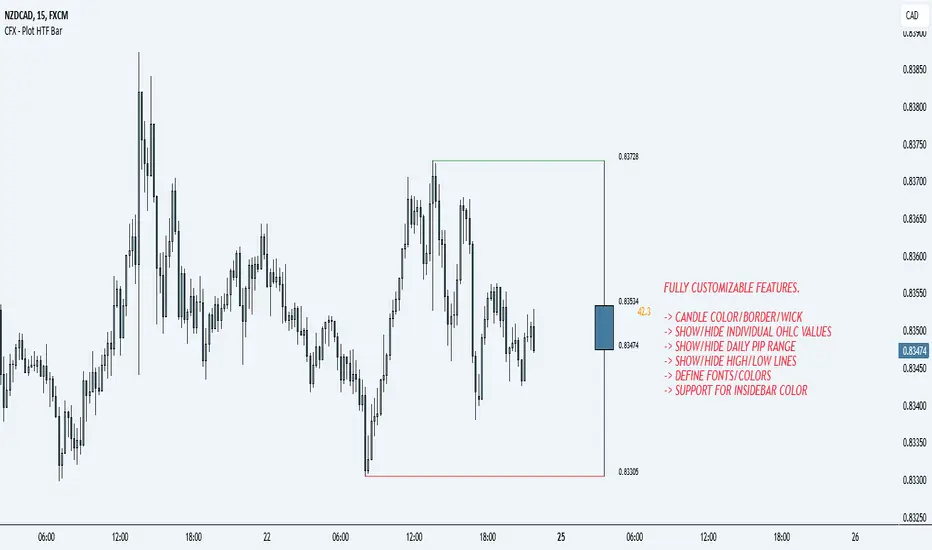
CFX - Plot HTF BarIf you lose track of what's going on while being on the lower timeframes, you can use this indicator in order to plot the higher timeframe bar to the right hand side of the chart.
Supports multiple timeframes
Supports different colors
Supports different color for inside bars
Supports toggle-able pip range
CT - Candle TrendHighlight candle tails in a trend in order to find previous area of resistance or support.
Recommended for D, W or higher timeframes.

Hammer and inverted Hammer
The "Hammer and Inverted Hammer" indicator is straightforward and effective. It automatically spots key candlestick patterns for you, making it easier to see potential market turns. You can also adjust a few settings to fit your trading style. Simple, yet quite handy for traders!
Alerts for Hammer Pattern: When the script identifies a Hammer pattern, it can trigger an alert. This is particularly useful if you're looking for potential bullish reversal signals and don't want to miss them.
Alerts for Inverted Hammer Pattern: Similarly, when an Inverted Hammer pattern is detected, the script can also trigger an alert. This is helpful for spotting potential bearish reversal signals.
SETTINGS EXPLAINED
Minimum Lower Tail Length (%): This setting allows you to define what percentage of the total candle size should be considered a significant lower tail. This is important for identifying the Hammer pattern.
Number of Consecutive Candles (for Lower Tails): This input lets you choose how many consecutive candles with significant lower tails must be present to identify a pattern.
Percentage of Candle Below Previous Low: This setting determines what percentage of the candle's range must extend below the lowest low of a specified number of previous candles. It's used to assess the significance of a Hammer pattern.
Number of Previous Candles for Lowest Low: This decides how many previous candles the script should look at to calculate the lowest low, which is then used in the Hammer pattern analysis.
Minimum Upper Tail Length (%): Similar to the lower tail setting, this defines the significant length of an upper tail, used for identifying the Inverted Hammer pattern.
Number of Consecutive Candles (for Upper Tails): This input is for setting how many consecutive candles with significant upper tails are required to confirm an Inverted Hammer pattern.
Percentage of Candle Above Previous High: This setting is used to determine how much of the candle's range must be above the highest high of a set number of previous candles, aiding in the identification of the Inverted Hammer pattern.
Number of Previous Candles for Highest High: It specifies the number of past candles to consider for calculating the highest high, which is important for the analysis of Inverted Hammer patterns.
These settings allow you to customize how the script identifies Hammer and Inverted Hammer patterns, making it adaptable to different trading strategies and market conditions.

CBC FlipThis is an indicator for the Candle By Candle (CBC) Flip strategy as created by @MapleStax
It’s useful to traders because it’s a simple approach to gauge if bulls or bears are in control for any particular candle. The logic is as follows:
If the most recent candle close is above the previous candle high, then bulls are in control.
If the most recent candle close is below the previous candle low, then bears are in control.
If neither of these 2 conditions are met, then whoever was already in control remains in force until one of the 2 conditions is met and the sentiment is flipped, hence the name CBC Flip.
My script is original because there are no other CBC Flip scripts available on TV. This is the first, which is why I created it, to help other traders benefit from the power of CBC Flips.
The indicator output is simply interpreted as follows:
Triangle up = bulls in control
Triangle down = bears in control
In my experience this script is best used on the 5 or 10 minute time frames, as it helps to keep you in the trade for the bigger moves once a trend is established, while not getting shaken out from the “noisy” up/down candle price action of lower time frames like the 1 minute.
I’ve also had more success with this indicator when only taking long trades once the green triangle appears and price is above VWAP, and only taking short trades once the red triangle appears and price is below VWAP.
Trend FinderThe "𝙏𝙍𝙀𝙉𝘿 𝙁𝙄𝙉𝘿𝙀𝙍" indicator is a powerful tool designed to detect trends and identify potential reversal points in asset prices. It operates as both a trend-following and mean reversion indicator, offering insights into market movements.
Trend Identification:
Trend Detection:
This indicator primarily identifies trends in asset prices.
When the "𝙏𝙍𝙀𝙉𝘿 𝙁𝙄𝙉𝘿𝙀𝙍" value is above the middle line, it typically indicates an upward trend in the asset's price.
Color Coding: During an upward trend, the bars are colored green, signaling strength in the upward movement. Conversely, during a downtrend, the bars turn red, indicating a potential downward movement in the asset's price.
Calculation Process:
Moving Averages: The calculation involves using multiple Simple Moving Averages (SMAs) based on the open and close prices of the asset.
Incremental SMA Lengths: These SMAs are calculated with increasing lengths, creating a series of comparisons between closing and opening SMAs. If the closing SMA exceeds the opening SMA, a value of 1 is assigned; otherwise, it's assigned as 0.
Aggregation: All these SMA values are compiled into an array and processed to derive an average, emphasizing the trend direction and strength.
Application:
Trend Strength: The indicator's value reflects the overall strength and direction of the trend. Higher values suggest an end or reversing of trend, while lower values what crosses over or under Midline may indicate a trend changing and indicate incrising of trend strength.
Reversal Indication: Besides identifying trends, it can also serve as a mean reversion indicator, potentially pinpointing potential tops and bottoms in the market.
Midline: Additional in settings can be changed a position of midline to up or down to your personal preference.
The "𝙏𝙍𝙀𝙉𝘿 𝙁𝙄𝙉𝘿𝙀𝙍" indicator amalgamates moving averages and trend analysis, offering a comprehensive view of market trends and potential reversal points. Its adaptability through parameter adjustments allows for fine-tuning to suit various market conditions.

Alert on Candle CloseAlert on Candle Close is a simple indicator allowing you to set alerts when a candlestick closes.
Instructions for use
From the chart window, click on "Indicators" and search for "Alert on Candle Close".
Click on "Alert on Candle Close" to add the indicator to your chart. Click on the star icon to add it to your favourites to easily access later.
Set your chart timeframe to the timeframe you wish to alert on. For example, to create an alert when a 4h candlestick closes, set your chart to the "4h" timeframe.
Hover over the "Alert on Candle Close" indicator which has been added to your chart and click the ellipsis "..." icon, then click "Add alert on Alert on Candle Close" or use the keyboard shortcut "Alt+A" from the chart.
In the alert pop-up window, make sure "Condition" is set to "Alert on Candle Close" and "Trigger" is set to "Once Per Bar".
Optionally, you can set a custom expiry for the alert, give the alert a name and customise the alert message. You can configure notification settings from the "Notifications" tab.
Click "Create" and your alert is set up!
Each alert is tied to the timeframe and chart it was created on, so you can change the timeframe or asset and create more alerts by repeating the above process.
Note : this indicator is only designed to work with time-based chart types, such as Bars, Candles or Heikin Ashi. It will not work for non-time charts such as Renko.
FAQs
Why do my alerts sometimes not fire as soon as the candle closes?
This is a limitation with Pine Script's execution model. Indicators are calculated whenever a price or volume change occurs i.e. when a new trade happens. For illiquid or slow moving markets, there may be some time between when a candle closes and the next trade, leading to a delay in the alert triggering. The alert will trigger on the next tick of data on the chart.
Why can't I create more alerts?
TradingView has a limit on the number of active technical alerts you can have based on your membership tier. To configure more alerts, consider upgrading your TradingView plan to a higher tier. See a comparison of TradingView plans at www.tradingview.com
My alert only fired once, how can I get it to keep working?
When configuring the alert in the alert pop-up window, make sure you set "Trigger" to "Once Per Bar" and "Expiration" to "Open-ended alert".

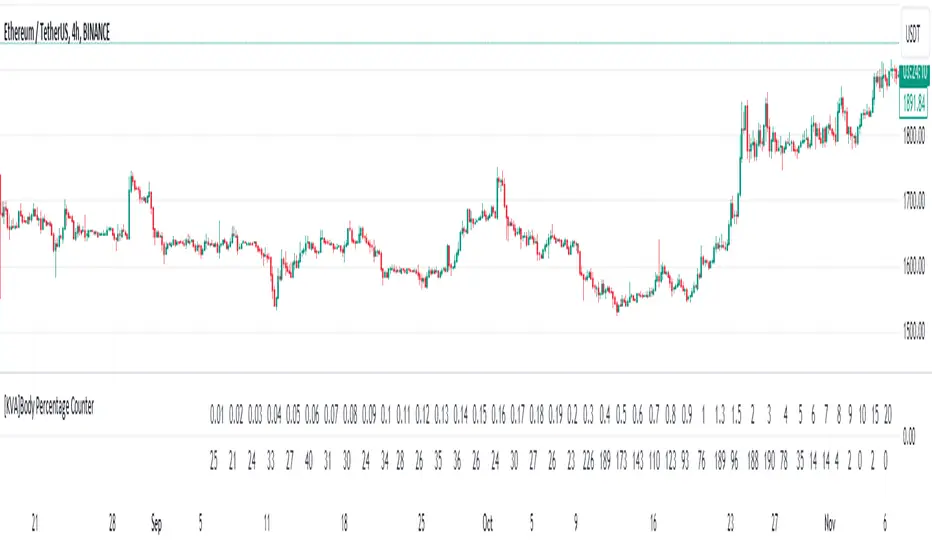
[KVA]Body Percentage Counter This indicator presents a comprehensive view of the historical candle data within user-defined body percentage ranges. Each column represents a specific body size percentage threshold, starting from as low as 0.01% and extending up to 20%.
The rows categorize candles by their closing and opening price differences, effectively sorting them into green (bullish) and red (bearish) candles based on whether they closed higher or lower than their opening prices.
First Row of the table is the bu
For developers, this table can be immensely useful in determining stop-loss ranges. By analyzing the frequency of candles that fall within certain body percentage ranges, developers can better understand where to set stop-loss orders. For instance, if a developer notices a high frequency of candles with body sizes within a specific percentage range, they may choose to set their stop-loss orders outside of this range to avoid being stopped out by normal market fluctuations.
Moreover, the indicator can be used to:
Volatility Assessment : The indicator can be used to gauge market volatility. Smaller bodies may indicate consolidation periods, while larger bodies might suggest more volatile market conditions.
Optimize Trading Strategies : Adjust entry and exit points based on the prevalence of certain candle sizes.
Risk Management : Determine the commonality of price movements within a certain range to better manage risks.
Backtesting : Use historical data to backtest how different stop-loss ranges would have performed in the past.
Comparative Analysis : Traders can compare the frequency of different body sizes over a selected period, providing insights into how the market is evolving.
Educational Use : For new traders, the indicator can serve as an educational tool to understand the implications of candlestick sizes and their relationship with market dynamics
The data provided in this output can guide developers to make more informed decisions about where to place stop-loss orders, potentially increasing the effectiveness of their trading algorithms or manual trading strategies.
The output of the " Body Percentage Counter" indicator is organized into a table format, which can be broken down as follows:
Header (First Row) : This row lists the body percentage thresholds used to categorize the candles. It starts from 0.01% and increases incrementally to 20%. These thresholds are likely set by the user and represent the range of candle body sizes as a percentage of the total candle size.
Green Candle Count (Second Row) : This row displays the count of green candles—candles where the close price is higher than the open price—that fall within each body percentage threshold. For example, under the column "0.01", the number 25 indicates there are 25 green candles whose body size is 0.01% of the total candle size.
Red Candle Count (Third Row) : This row shows the count of red candles—candles where the close price is lower than the open price—for each body percentage threshold. The numbers in this row reflect the number of red candles that match the body percentage criteria in the corresponding column.
Total Candle Count (Fourth Row) : This row sums the counts of both green and red candles for each body percentage threshold, providing a total count of candles that have a body size within the specific range. For instance, if under "0.01" the green count is 25 and the red count is 26, then the total would be 51.
This organized data representation allows users to quickly assess the distribution of candle body sizes over a historical period, which is especially useful for determining the frequency of price movements that are significant enough to consider for stop-loss settings or other trade management decisions.
Heat profileA trader once told me that top wicks equals sell interest and bottom wicks equals buy interest. If that's true then this indicator tries to organize and visualize this idea.
It uses transparent boxes to give the impression of a heat map. Due to limitations of my own skill and possibly pinescript it is not possible to render it in a useful manner using different colors that depicts buy and sell interests respectively. This means it works more like a volume profile in that it mixes the buy and sell interest together in the heat map. This can still be helpful because it help traders focus their attention on areas other than the current price candle.
In my limited time of using it, it seems like on the large timeframes the highlighted areas is where the price wants to go, and on small time frames the darkest areas is where the price wants to go. But i will leave it up to any user to spot and use their own patterns with the indicator.
Last but not least, the indicator only uses the last 50 candles, which can be too little on a small timeframe. Unfortunately the way i have done it this limitation is hardcoded in the script due to how pinescript works, by editing the code you can increase it. (Put max_boxes_count = x after overlay = true. Maximum number is 500)
Hope you enjoy. Have a nice day.

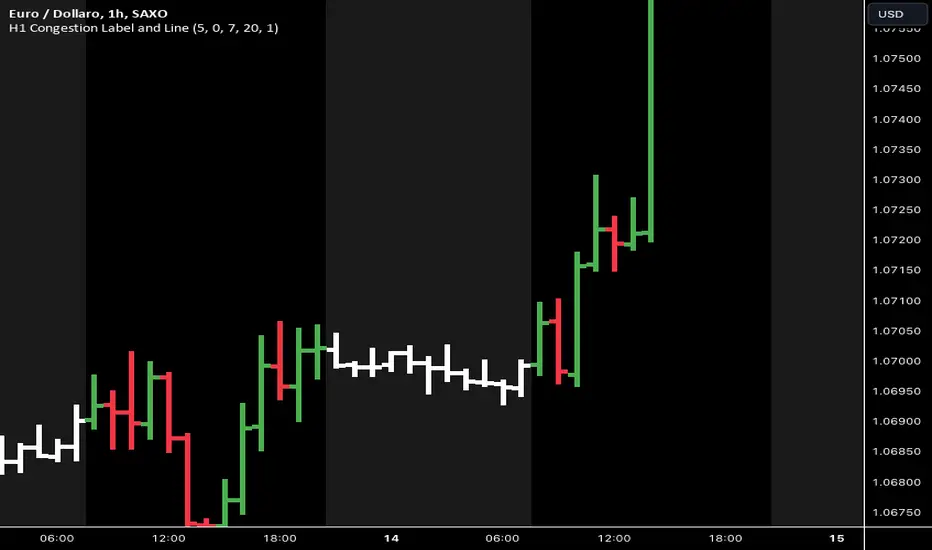
H1 Congestions V-1.0This indicator is designed to highlight the night session, from 20:00 to 07:00 in the morning . The purpose is to study the congestion ranges. This is a useful condition to anticipate the volatility break out that occurs in the morning, driven by the European markets.
Below is the logic I have applied:
First of all, I defined a directive to activate the highlighter . I had to activate a highlighter for today's session and another one for yesterday's session, and I included fields to potentially modify the time range. I also added the possibility to change the time zone, as I did not understand the time zone of the TradingView server.
Then, I added a directive to color the night bars in white, from 20:00 to 07:00 . For this function too, I added fields to modify the range. Finally, I inserted labels to count the range of the bars in pips, but only for bars over 20 pips. However, I was not able to correct the position to prevent the label from overlapping with the bars. If you have any suggestions on this issue, I would be grateful.
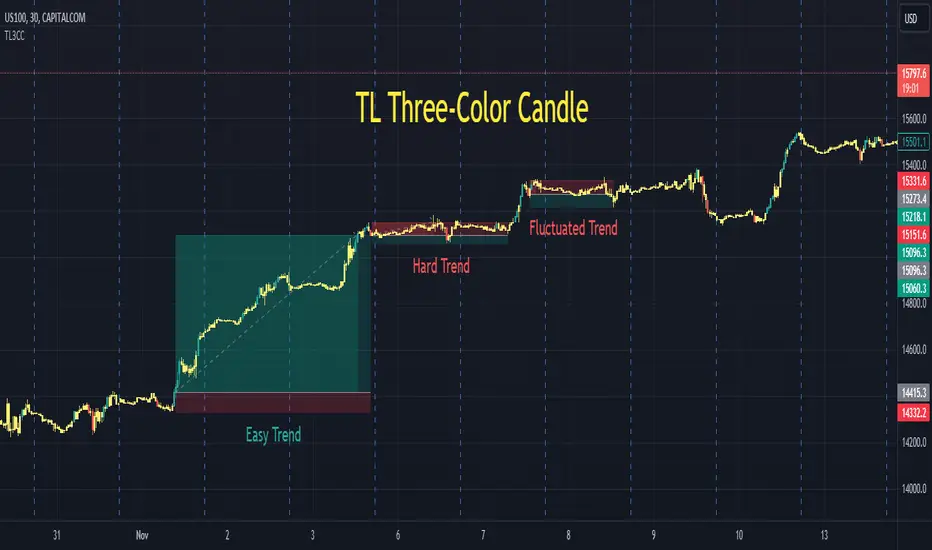
TL Three-Color CandleA traditional candle only has two colors, either green or red. A TL candle goes one step further, it has three colors: green for bullish (perfectly bullish), red for bearish (perfectly bearish), and yellow for ranging (wake-up, sleeping). A green TL candle means that its close is not only higher than its open but also higher than previous close, previous open and especially previous high, among other conditions. In the other extreme, a red TL candle indicates that its close is not only lower than its open but also lower than previous close, previous open and especially lower than previous low, among other conditions. TL candle does its best to tackle the trap of going against the trend: short when the price seems to be high in an uptrend or buy when the price seems to be low in a downtrend.
Parameters:
Volume Active Percentile % , Min Height Percentile of Bullish/Bearish Candle % . (Intraday)
Back Two Candles . (Intraday, day and above)
Usage:
After adding TL3CC to the chart, find Visual Order or Object Tree and bring TL3CC forward to be above the chart candle.
While a bullish trend includes green and yellow TL candles, a bearish trend includes red and yellow ones. It is the best to enter after the first bullish/bearish TL candle of each trend. It is extremely important, never ever try to go against TL candle.
There are many cases when red and green TL candles are twisted and we could have profit in both directions. It is the time that market is fluctuating strongly. We enter when TL candle has one color, but it changes to the opposite color after that as the price pulls back. In those cases, be calm and patient to wait for the first reversal to exit, it should come.
Markets: Developed and tested on: US100. Timeframes: Developed and tested on: 30m.
Trend Bar Dow Theory V-1.0The indicator is designed to signal the presence of a trend bar with reduced profit-taking the following day. Below, I explain the logic that I have defined for this first version.
The guidelines I provided are as follows: We identify a trend bar, if it sets a market change, between opening and closing, equal to or greater than 50 pips . This first guideline is used to find a day with good liquidity , which usually leads to a trend bar.
If the first guideline is met, the indicator should change the bar color to white . This way, we can proceed to the second guideline, to detect the presence of reduced profit-taking.
The second guideline should indicate the presence of reduced profit-taking, as explained by Dow Theory, to find a trend context with potential to exploit. Therefore, the second guideline involves coloring the bars near the trend bars in grey, if they have a range equal to or less than 30 pips.
Dow Theory states that a market in trend measures reduced profit-taking, within 33%, up to a maximum of 50% compared to the previous trend bar, but I have not yet been able to make Pine Script calculate the percentage value. If you have any suggestions, I would be grateful.

Japanese Candle Patterns Detector in Potential Price ZoneThis script would find the 8 famous "Japanese Candle Stick Patterns" in your chart.
Please be aware it find patterns in "Potential price zones" only, which help you to avoid none-important patterns during a price trend.
I used RSI and ATR in my codes to find best candle forms and price conditions.
*** This indicator shared before but without source code. According to follow requests, I publish it again with source codes. I hope it helps you in trading journey...
Bellow patterns are detecting:
Hammer | ShootingStar | Engulfing Candle | Doji | Tweezers Top/Buttom | Three White Soldiers/Three Black Crows | Marubozu | Harami
* You can select your preferred patterns from indicator setting.
* Pattern names are abbreviated for better view on chart.
* Separate alerts for different type of candles for whom looking for a specific candle pattern
* Main alert which notify about every kind of candle patterns detect in a chart
