Real Price Line + Dots (for Heikin Ashi)Real Price Line + Dots (for Heikin Ashi)
This indicator is designed for use on Heikin Ashi charts. Its purpose is to enable traders to benefit from price averaging and smoothing effects of Heikin Ashi candles whilst also enabling them to see the current real price line, and optionally, real price close dots on the Heikin Ashi candlesticks.
Features include:
- Optional real price line
- Optional real price close dots
- Customisable colours
- Customisable line style
- Customisable line width
What are Heikin Ashi candles?
Heikin Ashi means 'average bar' in Japanese, Heikin Ashi charts do not show real price as standard, due to the way the Open, High, Low and Close values are calculated using averages, This is done in order to create a smoother appearance and reduce the market 'noise'.
You can read more about Heikin Ashi candlesticks here.
NOTE:
- If real price dots appear behind the candles, you may need to select the triple dot menu on the indicator then select "Visual order" > "Bring to front" , so that the dots are shown above the candles.
- When using this indicator on a Heikin Ashi chart, the standard Tradingview price line will not show accurate real price. Therefore when using the price line in this indicator, the standard price line should be disabled within the Tradingview 'Chart settings' dialog > 'Symbol' tab > uncheck 'Last', under the 'Price line' section.
K線分析

Rate of Change Candle Standardized (ROCCS)ROCCS is a standardized rate of change oscillator with "error bars". Rate of change helps traders gauge momentum in a market by comparing the current price with the price "n" periods ago. What makes this special is you get to see the momentum of the momentum via the candle view. The candle transformation utilizes a moving average to smooth the signal however this is only used for the close price. The high and low prices are not smoothed. The moving average has an adjustable period, and so does the standardization.
I hope you can find great use in this upgraded roc indicator.

Mark Structure ShdwMark Structure Show is building the market swing structure, minor and sub structure and marks all possible insignificant pivots
This indicator is the alternative version of Mark Structure indicator, I had to create another indicator in order to avoid programming limitation of TreadingView.
This version uses confirmation approach as confirming by body, it means every swing low/high is confirmed when the body (of newly creating swing low/high correspondingly) takes place and intercepts it. the same behaviour is with breaking structure its confirmed only by body.
From trading prospective with this kind of approach we can easily detect manipulations (caused by sweeps) and disregard those manipulation as elements which are breaking the structure. so its extremely useful for those who are trading smart money price actions and basing on swing structure POI
it supports:
- Marking all pivots with labels or join them continuously with trend lines.
- Marking minor and sub structured swings with labels or join them continuously with trend lines. Marking last actual CHoCH and BOS. Minor and substructure are structures inside swing structure and it can differ from the structure of lower timeframe
- Marking swings of swing structure with labels or join them continuously with trend lines.
- Changing bullish and bearish colors of each kind of structures
- Changing pivot labelings
- Changing colors
Remarks:
- Don't expect to have minor and sub structure in each swing waves, its totally fine when you don't have them at all
- Swing structure is the most significant structure and shows real price direction.
- The last swing is not able to be confirmed it tries to build 2 swings that most likely would be either substructure or SMS BOS

The Fearless Power Suite systemDear TradingView community and followers,
Through my years I have often seen trading systems with many functionalities or indicators that can be customized in numerous ways; however I wanted something that could stomach most trading contexts without having to change settings while allowing me to have the freedom of a clean chart to keep using discretionary trading as confluence.
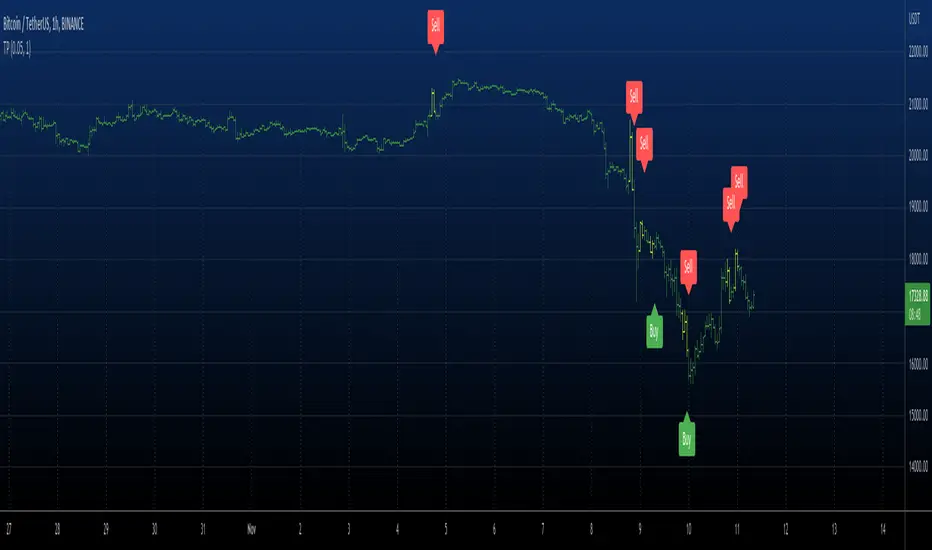
Using a complex combination of bullish/bearish technical breakouts (looking at general market structure while combining candlestick patterns, exponential moving averages and various indicators that indicate new trends), the aim of this system is to catch safe breakouts and at the same time notify the user of fake outs and unfavorable market conditions.
Settings to be used:
The following settings are to be used; the Fearless Power Suite system (FPS) is based on candlestick closes to correctly identify market conditions and patterns. It is not recommended to change them because waiting for candlestick closes in my opinion adds extra “confirmation” for decision taking.
Len: 14
Source_input: Close
Start: 0.02
Increment: 0.02
Max value: 0.2
How to use the system:
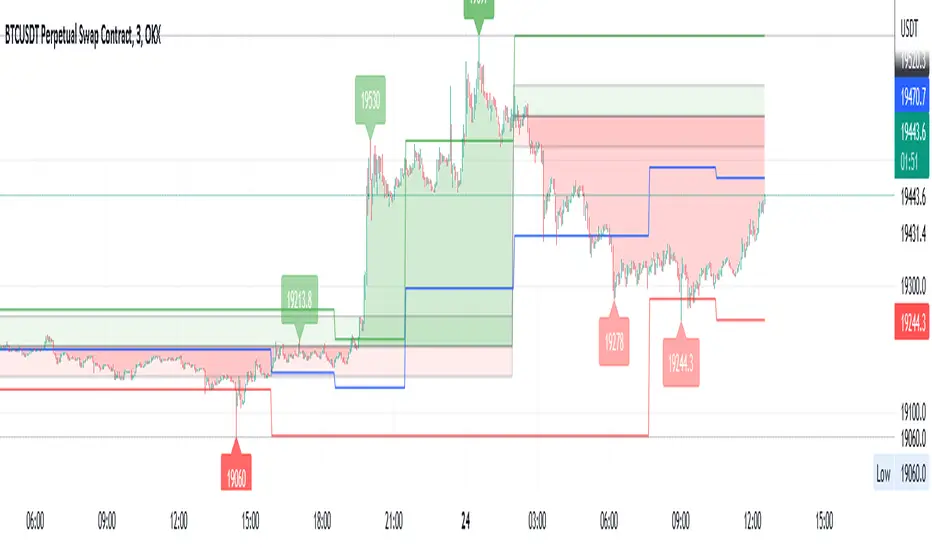
General context: Bias formation for directional trading is formed by looking at the general market structure which in this case is primarily created by looking at the cloud formed by the 2 moving averages. “The cloud” is referred as the space within the 2 moving averages.
One of the lines is the 21 EMA (which is my favorite classical EMA) and a “Super MA” formed by a simple mathematical equation. This allows the trader to always keep an eye on key support and resistance levels and optimize entries by entering at these given levels. The 21 EMA is a must in my opinion to enter bounces within a trend or very aggressive entries while the “Super MA” is rather to find extreme points for market reversals.
Top and bottom warning: Indicators signaling potential bottoms or tops already exist but the warning often comes only after a certain breakdown/breakup already happening but rarely on the candlestick itself.
Example: To give you a bearish signal, indicators often give you a signal on an engulfing red candlestick that follows a smaller green candlestick because it shows weakness, but rarely do you see this warning made on the green candlestick itself! Of course, it’s a signal given with less confirmation but to take partial profit on your trades it is quite effective.
Market structure breakout signals: Taking into account the general structure of the market (trending/ranging) as a result of using volatility and volume as key indicators of this complicated mix, trade signals are often given when it is considered “safe” to enter. The beauty of this, which is decently rare from what I’ve seen, is that during choppy conditions (which are not recommended to be traded) the trader will get fewer signals than usually. This is doable thanks to the volume and volatility monitoring.
The aim of these structure breakout signals is to reduce market noise and only highlight key moments of the market when you should pay attention. The candlestick formations which will create these signals will always have a certain importance from a market structure perspective and so a SL can easily be found at all times when entering during that time.
No trade zones: As previously mentioned one of the features of this system is to notify the trader in case of bad context. 2 different signals might come up “No long” or “No short” which means that from a statistical perspective it is highly recommended not to take a long or short entry in that given signal to avoid disastrous trades.
The “No long”/”No short” function of the system primarily uses Daily Range data which will continue to change during the day until the daily close, information such as Daily Low and Daily High will thus evolve. This means that sometimes this part of the FPS system will repaint but it’s not a common occurrence. This function is mainly used to reduce your current risk in case you are in a trade or to not enter any position, but not a signal for entry on its own.
Concepts combination:
This system will give you a decent amount of trade opportunities, I strongly advice you nevertheless to always find confluence in your decision making with discretionary trading as well if possible. Patience is key as always. Here is a small list of trade combinations to be used to improve results.
Example 1: Entering a position when getting a market breakout signal given after seeing a top or bottom warning on your chart. This is what we could call a “double confirmation”.
Example 2: Using the “Super MA” considered as extreme value for market reversals in a certain timeframe (15minutes for this example) while also looking at the above timeframe (1 hour in this example) for the 21EMA to be situated at the same level for a trending bounce and thus again getting a double confirmation. (Because both timeframes expected a reaction from that level). Seek a market structure breakout signal on the 15 minutes to get even more confirmation and a pre-made Stop Loss.
Limitations:
Although the signals are all created following a strict amount of technical rules not all should be taken. It is the trader’s duty to always find confluence to improve long term results. This is not a “magical bot”; I firmly believe that the best combination in trading comes from new technologies and using human intelligence.
When the Fearless Power Suite system (FPS) is used on a chart where volume data is not available not all functions will be available as volume data is taken into serious consideration for entries and trend following signals. General market structure and part of the FPS system will still be available nonetheless.
PS: The FPS works for every market and every timeframe, I personally mainly use it on cryptocurrencies (and on the SP500 and DXY for added confirmation to get a general grasp of market context).
I hope this description was useful enough :)

Tweezer PatternsTweezer top and bottom, also known as tweezers, are reversal candlestick patterns
that signal a potential change in the price direction. Both formations consist of
two candles that occur at the end of a trend, which is in its dying stages.
The tweezer bottom candlestick pattern is a bullish reversal pattern that can be
spotted at the bottom of a downtrend. It consists of two candles, where the first
candle is in line with the bearish trend, while the second candle reflects more
bullish market sentiment as the price bursts higher, in the opposite trend.
The tweezer top candlestick pattern is of the same structure as the tweezer bottom,
except for the fact that it happens at the end of an uptrend, and therefore, it is a
bearish reversal pattern. The first candle is bullish, and it continues in the same
direction, while the second bearish candle indicates that the trend may be changing soon.
Both the bottom and top tweezers are only valid when they occur during uptrends and downtrends.
Their appearance during choppy trading conditions is practically meaningless, and it signals
the market indecision to move in either direction.
WARNING:
- For purpose educate only
- This script to change bars colors.
Largest Candle Profile - Selection ToolLargest Candle Profile
A simple script that finds the largest candle between a user's defined area. Search for the largest candle (high-low), largest body (open-close) or largest wick between any selected area.
How To Use:
Anchor pivot A and B on the area of choice.
Indicator can be used to detect levels of interest. Coded to be used with anchored vwap, flexible volume profile or liquidity gaps.
In action:

BE- InsideOut Explosion - Trade the Benefit Of DoubtDear Traders,
Here with presenting the new Indicator which is primarily built based on the the concept Contraction & Explosion.
Idea behind this Indicator: I am sure every trader would have heard about consolidation and Expansion. When we we look deep inside the consolidation zone it leaves a mark
on the direction most of the time and just explode breaking the consolidation zone. What if the explosion is to trap the retailers like me!!. That's why I call this as Benefit of doubt. If the direction of is right I just sail with the trade right inside the consolidation zone. If I am on the wrong side ! No worries My Money management rules and Protection Legs kicks in and saves my capital.
This Indicator Analyses the Volume, and Chart Patterns inside the Zones and if the price breaks the patterns, initiate the trades. You can trade with Dhan HQ or Algoji.
What this indicator is providing:
Based on the chart patterns and using the inputs provided for RISK and Money Management options, Indicator continuously scans for trading opportunities and provides alerts for possible trades. I have tried to capture some analytical inputs for one to think and take control over the Reward, Risk and Money management parameters to tweak the indicator accordingly.
Note: Indicated PNL is calculated on the Futures Chart with 2 Lots taken per trade.
If you are a Options Traders:
1. Auto Strike is inbuilt and can be traded only if you are trading via AlgoJi.
You will constantly be informed about trade summary, PNL and SL updates as per your preferred choice.
Enjoy!
DISCLAIMER: No sharing, copying, reselling, modifying, or any other forms of use are authorized for our documents, script / strategy, and the information published with them. This informational planning script / strategy is strictly for individual use and educational purposes only. This is not financial or investment advice. Investments are always made at your own risk and are based on your personal judgement. I am not responsible for any losses you may incur. Please invest wisely.
Happy to receive suggestions and feedback in order to improve the performance of the indicator better.

Stochastic CandlesIn this indicator I have transformed the %K line into adjustable candles. Because of this I have increased the length of the %D line to be more useful in this context. It is worth noting that you get the same momentum indication as %D set to 4 just because of the default candle transform setting. Incase you need to brush up on how stoch works here is the built in summery.
The Stochastic Oscillator (STOCH) is a range bound momentum oscillator. The Stochastic indicator is designed to display the location of the close compared to the high/low range over a user defined number of periods. Typically, the Stochastic Oscillator is used for three things; Identifying overbought and oversold levels, spotting divergences and also identifying bull and bear set ups or signals.

Hammer & Shooting Star [C] - KaspricciHammer and Shooting Star
This indicator identifies Hammer and Shooting Star candles and marks them with a respective label. It uses a set of predefined fibonacci levels to measure the size of the body in comparison to the overall size of the candle. You can change the fibonacci level according to your preferences.
You can enable a confirmation of the Hammer or Shooting Star candle by a following green or red candle.
Settings
Fibonacci Level - Select on of the predefined fibonacci levels as a threshold for the maximum size of the body compared to the overall size of the candle.
Confirm by next candle - by default turned off. If turned on, this will check the subsequent candle and only mark a Hammer followed by a green candle or a Shooting Star followed by a red candle.
Show labels on chart - by default turned on. If turned off, the indicator will hide the labels on the chart.
Alerts
You can create alerts for Hammer and Shooting Star candles. The indicator provides the respective conditions.
Linking with Backtesting Strategy
I also added a feature to combine this indicator with a backtesting strategy. It provides a plot Connector which can be selected in a backtesting strategy supporting this linking feature.
Signals:
Signal: 2 - Hammer candle (long entry)
Signal: -2 - Shooting Start candle (short entry)
You can see the signal values in the status line of the indicator. This is based on the External Signal Protocol defined by PineCoders .

Pinbar by BirdCoinIt is the most customizable Pinbars indicator that you can find.
The indicator autonomously detects the Pinbars to which filters can be placed. The available adjustments are:
- The spread of the Pinbars
- The wick and the body ratio of the Pinbars
- The volume of the Pinbars
- Number of the previous candles that the Pinbars hunted
Happy trading!
~ Birdcoin

RF+ Replay for Heikin AshiRF+ Replay for Heikin Ashi
RF+ Replay for Heikin Ashi generates fully customisable Heikin Ashi candlesticks presented on a standard chart, enabling traders to utilise the Tradingview Replay feature with Heikin Ashi candlesticks when analysing and backtesting HA style strategies.
The features of this indicator include:
- Fully customisable Heikin Ashi Candles, including custom colour options for candle bodies, borders and wicks.
- Optional real-time, real-price close dots painted onto each candlestick.
- A optional set of 2 x Range Filters designed to indicate short term trend identification upon color change, ideal for low timeframe scalping.
- A optional set of 3 x fully customisable Moving Averages.
- An option to enable Heikin Ashi calculated data for the Range Filters and Moving Averages, so they present as they would on a Heikin Ashi non-standard chart type, without having to use an actual Heikin Ashi chart. Enabled by default.
- An optional sessions indicator, to highlight your prefered trading session for the purpose of backtesting.
- An optional watermark featuring customisable text and well as symbol and timeframe information, as seen in the screenshot of this indicator.
Instructions for use:
1) Because this indicator generates candlesticks and presents them onto your chart, you will need to hide the existing candlesticks so you do not see two sets of candles. You can do this by going into your Tradingview chart settings and making the candle bodies, borders and wicks fully transparent. You can then save this as a layout template. You can access your Chart Settings by clicking on the cog icon, or by right clicking on the chart itself and selecting 'Chart Settings' from the list.
2) Ensure you have the standard chart type selected - you do not need to select a Heikin Ashi type chart.
3) You will now be able to analyise and even backtest your Heikin Ashi style strategies including the use of the Tradingview Replay feature found at the top of the chart.
Heikin Ashi means 'average bar' in Japanese, which speaks to the fact that Heikin Ashi candles are calculated differently to standard Japanese candlesticks. The general idea of Heikin Ashi candles is to 'smooth' the appearance of price movement, by the use of averages within their calculation. It is important to understand that the Open and Close values of a Heikin Ashi candlestick do not reflect real Open and Close prices. You can use the real price dots feature to clearly see the real time and real price Close of each candle.
The formula for calculating a Heikin Ashi candlestick is as follows:
High = Maximum of High, Open, or Close (whichever is highest)
Low = Minimum of Low, Open, or Close (whichever is lowest)
Open = Open (previous bar) + Close (previous bar) /2
Close = (Open + High + Low + Close) / 4
If you found this useful, be sure to leave a like, comment and subscribe to show your support.
Until next time.

Zig Zag+ (Macro + Internal Structure Tool)ZigZag+ (Macro + Internal Structure Tool)
ZigZag+ is a simple tool that helps traders to clearly identify and differentiate between macro and internal market structure, to help you keep your bearings of where you are currently in the overall picture.
It is especially difficult to keep your bearings within the larger structural trend when trading the lower timeframes, where for example, a bearish structural trend on a lower timeframe may simply be a retracement of an overall bullish structural trend on a higher timeframe. This indicator primarily aims to help traders maintain awareness of where they are in relationship to the higher timeframe / 'macro' structural trend, and their most significant swing point highs and lows.
The features of this indicator include:
- 2x Zig Zag lines drawn automatically onto your chart. One which has a longer length than the other, which can be used to help identify and differentiate the larger price swings from the smaller price swings found within it. Enabled by default.
- Customisable Zig Zag line color & width settings to help clearly differentiate the higher timeframe 'macro structure' apart from the lower timeframe 'internal structure' within it, enabling it to be tailored to suit your chart colour theme and personal preference.
- Customisable individual length settings for the 2x Zig Zag lines, to allow the fine tuning of each line to any timeframe and asset. By default one lines length is set to a higher value than the other, to illustrate a macro structure (higher length value) as well as the 'internal structure' (lower value length), seen within the larger macro structure.
- Up to a maximum of 500 lines can be drawn meaning you can zoom out considerably, and view historical price action with both Zig Zag lines continuing to print.
- Custom alerts for identifying candlesticks that can offer optimal entries where they are found within valid price markups or markdowns that are already underway. Further details can be found within the tooltips for these signals.
Note: The above list of features are accurate at the time of publishing, but may be updated or added to in future.
Structure
Understanding structure is arguably the foundation of all trading strategies, and therefore very important to understand where you are exactly in the bigger picture, since it can help identify levels at which there is a higher probability of price moving either upward or downward at a given point. Structural trend refers to the typical way that price tends to move in any given trending market, identified by the continuation of higher highs and higher lows in a typical bullish trending market, and lower highs and lower lows in a bearish trending market.
During other times price may not be trending in this way, for example when it is undergoing accumulation or distribution phases, where the consistent higher high & lower low / lower high and lower low patterns will not be evident.
What is Macro Structure?
Macro trend structure refers to the structural trend seen on higher timeframe charts.
What is Internal Structure?
Internal trend structure refers to the structural trend seen on lower timeframe charts, which is found within the higher timeframe structure.
Disclaimer: This indicator is adapted from an original script authored by Tr0sT . With special thanks.

Inside Candle and mother candle range with alert++>>This script allows you the inside bar candle and the cnadle is shown in white.
The range of the mother candle is identified and tracked until it breaks.
Once the first range is over ridden then the next similar pattern will be occured and the tracking will be done for the mother candle latest occurrence.
It also has the alert mechanism where you can go and the alert for the indicator in Alerts.
5 min is the most preferrable time frame and while saving the alert Note to save the time frame of the chart. For which ever time frame is saved the Alert will be triggered for the same .
And when th inside bar is triggered it throws an alert condition. this alert condition has to be configured in your alerts and will be buzzing on the screen.
Oct 20
Release Notes: updated with Mother candle top and bottom lines of previous occurrences and tracks the current latest Inside bar mother candle
Release Notes: this script allows you the inside bar cnadle and the cnadle is shown in white. highlighter is configurable and line colors as well.

EVA - Daily Candle BoxThis is a very simple indicator who display few information about the LAST daily candle. ( it is possible to change the timeframe to have information about last week or last hour )
The green background zone is the channel between last daily candle close and last daily high.
The red background zone is the channel between last daily candle close and last daily low.
The middle line display the last daily candle close.
You can desactivate some display , and let just what you need.
If you have any idea to improve it , let me a message !
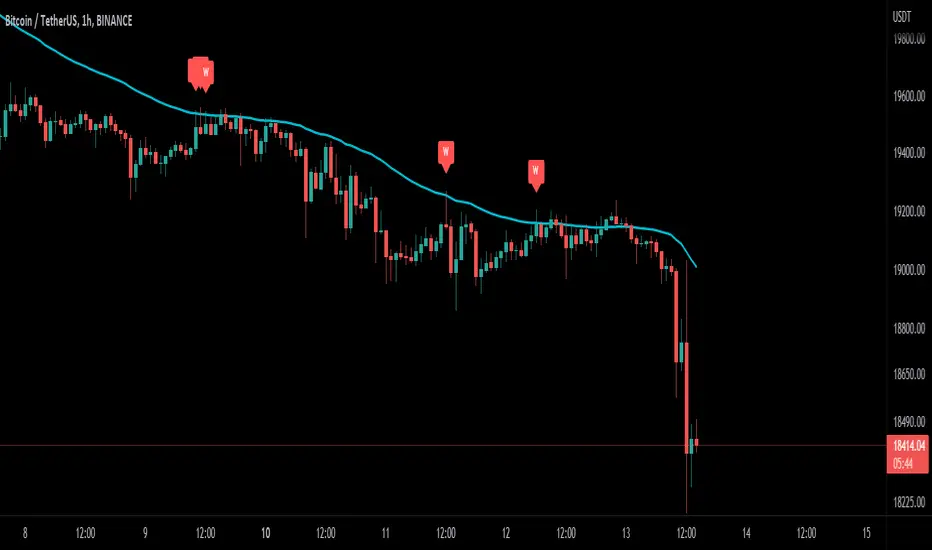
Wick-off Check Moving Average [Misu]█ This Indicator shows a wick-off check pattern applied to a moving average.
This pattern appears when a candle opens below the moving average and closes above it, or when it opens above a moving average and closes below it. This causes a wick to go through the moving average: a wick-off check moving average.
█ Usages:
This indicator detects small pullbacks in a trend. This is mainly used for trading continuation strategies.
It can also be used to validate a resistance or support level .
█ Features:
> Average Wick Validation: You can validate a wick-off check pattern depending on the average wick size. This is configured with parameters "Lenght Avg Wick Validation" and "Factor Wick Validation".
> Trend Validation: A trend is taken into account when detecting a "continuation pattern". A trend is validated if X candles close above (up trend) or under (down trend) the moving average. This "X" is defined by "Length Bar - Trend Validation" parameter.
> Buy and Sell: Labels are showing wick-of check patterns but can be interpreted as a buy & sell signal.
> Multi Moving Average.
> Alerts.
█ Parameters:
Method Multi MA : The method for calculating the moving average.
Multi MA Length : The length used to calculate the moving average.
Length Bar - Trend Validation : Define the number of bar needed to validate a trend. When price is above the MA, trend is up. When price is under MA, trend is down.
Wickoff Mode : Mode used to detect Wickoff check pattern.
> continuation pattern: only shows wick-off check pattern in a confirmed trend.
> no trend in progress: only shows wick-off check pattern in a not confirmed trend.
> both: shows both.
Lenght Avg Wick Validation : Lenght used to calculate the average wick size.
Factor Wick Validation : Factor used to validate the length of a wick when a wick-off check is detected.
High-Low CandleSimplified trading with only High Low candles. It uses CCI for trade selection and filtering. Use it either in normal candle mode or better in Heikin Ashi mode. Recommend using standard Stochastics and CCI 20 indicators to learn usage and behaviors.
Trading rules and color legend:
Teal (Green): Long
Red: Short
Grey/Silver: No trade zone, Indecisive candle
Yellow: Potential trend change (Outside Bar) needs confirmation on either side
Purple: Extreme momentum (CCI above 195/below -195) . Alert for reversal possibilities and divergences
Trading recommendations:
When color transitions from Grey or Purple or Red to Green - Enter long above high of this green candle
When color transitions from Grey or Purple or Green to Red enter short below low of this Red candle
Exit trade on 2 consecutive Red bars (for long) and Green bars (for Short) or Super Trend changes direction
Additionally can use Stochastics, CCI (and VWAP for shorter time frames) for validation/confirmation.
Thank you for looking this up. This is my first publish of an indicator/pine script so please judge me kindly! Happy trading.

Pro Trading Art - Candlestick Patterns with alertAll candlestick pattern based on "Japanese candlestick charting techniques".
Currently Supported List of Candlestick Patterns :
Hammer
Hanging Man
Inverted Hammer
Shooting Star
Morning Star
Evening Star
Bullish Engulfing
Bearish Engulfing
Important Points:
1. You can create alert for all patterns.
2. You can modify multiplier(Length Of Shadow) for Hammer, Hanging Man, Inverted Hammer and Shooting Star
3. You can modify EMA length for upward and downward validation of any pattern.

AI-EngulfingCandleThis script is the combination of RSI and Engulfing Pattern
How it works
1. when RSI > 70 and form the bullish engulfing pattern . it gives sell signal
2. when RSI < 30 and form the bearish engulfing pattern . it gives buy signal
settings:
basic setting for RSI has been enabled in the script to set the levels accordingly to your trades

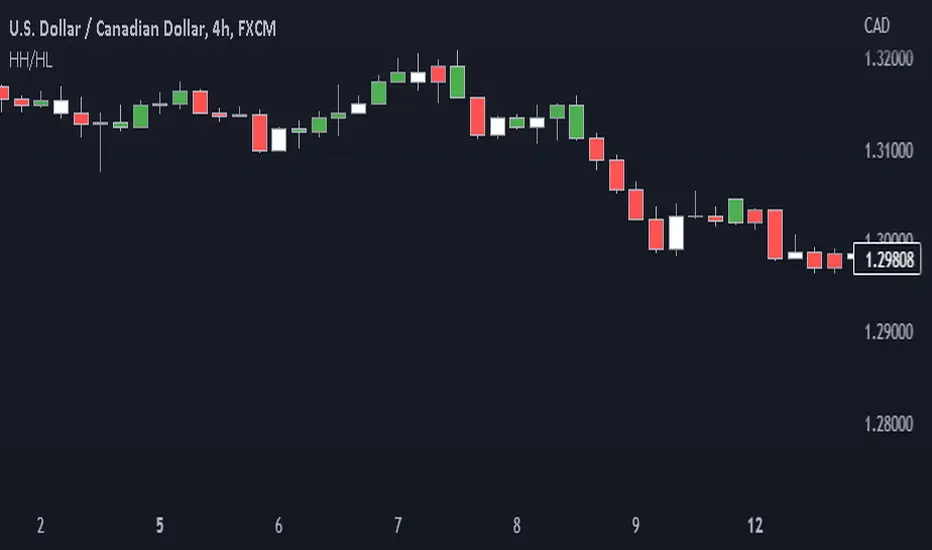
Price action: candlestick trend painter This script paints bars in different colors based on whether they are trending up or down.
It shows you if a candle is bearish or bullish based on the high and low of the previous candle.
Bull candles form higher highs (HH) and higher lows (HL) from the previous candle and are painted green.
Bear candles form lower highs (LH) and lower lows (LL) from the previous candle and are painted red.
Disclaimer
Copyright by Drbondsbody.
The information contained in my scripts/indicators/ideas does not constitute financial advice or a solicitation to buy or sell any securities of any type. I will not accept liability for any loss or damage, including without limitation any loss of profit, which may arise directly or indirectly from the use of or reliance on such information.
All investments involve risk, and the past performance of a security, industry, sector, market, financial product, trading strategy, or individual’s trading does not guarantee future results or returns. Investors are fully responsible for any investment decisions they make. Such decisions should be based solely on an evaluation of their financial circumstances, investment objectives, risk tolerance, and liquidity needs.
My scripts/indicators/ideas are only for educational purposes!
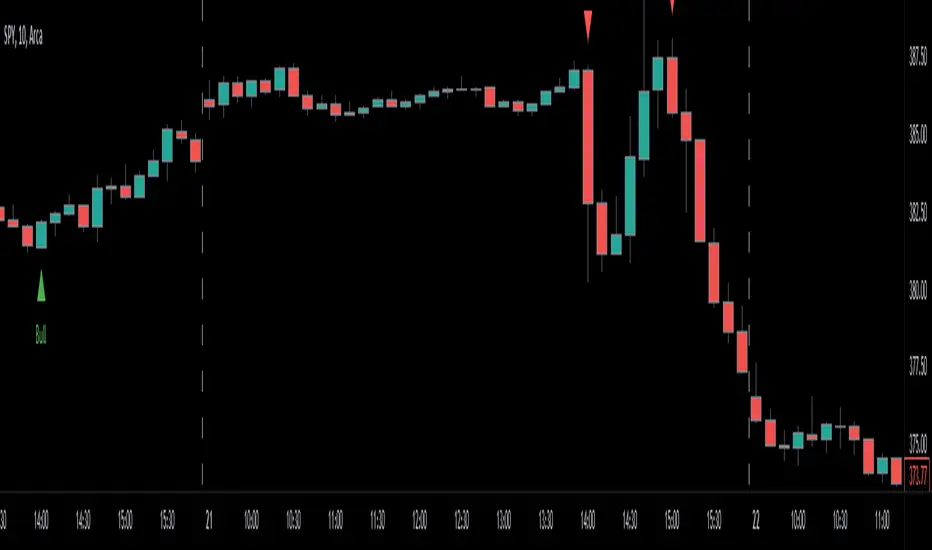
Engulfing Candles (Bullish and Bearish) + Trend | by Octopu$⛳ Engulfing Candles (Bullish and Bearish ) with Trend Recognition | by Octopu$
This Indicator identifies and plots Engulfing Candlestick Patterns.
Engulfing Candles are a combination of two bars on a price chart.
They are used to indicate/anticipate a market reversal.
The second candlestick must be bigger than the first, so it 'engulfs' the previous bar.
This indicator identifies both Price Movements:
Bullish stands for Upside
Bearish stands for Downside
These are NOT entry/exit signals to buy or sell securities*
(*The combination of your understanding and analysis as well as other Indicators and Factors as Confluence, you can improve your Charting Analysis.)
www.tradingview.com
SPY
ANY Ticker. ANY Timeframe.
( SPY 5m as an example only.)
Features:
• Engulfing Candles
• Bullish Setups
• Bearish Setups
• Symbol Signals
Options:
• Color Picker
• Symbol Selector
• Toggle On/Off
• Show name
• Trend Direction
Notes:
v1.0
Indicator release.
Changes and updates can come in the future for additional functionalities or per requests. Follow and Stay Tuned!
Did you like it? Please Support and Shoot me a message! I'd appreciate if you dropped by to say thanks! Thank you.
- Octopu$
🐙
Buying & Selling PressureBuying and selling pressure is a volatility indicator which denotes the balance between buyers and sellers inside candlestick.
You set the length to average it just like ATR. But This offers further break down of participants of the market.
Pretty much at any condition of the market the indicator can filter out interesting details to make trading decisions faster or confirm them.
So keep it simple we have two lines
🟢 Green → buying pressure
🔴 Red → selling pressure
If green is rising → Price most likely will grow
If green is rising and red is falling → Price will grow at higher probability
If red is rising → Price most likely will fall
If red is rising and green is falling → Price will fall at higher probability
When they both grow or fall → wait till one of them goes opposite way.
╳ Crossings can indicate turning points for bigger price swings.
Technically by very act of intersecting means that Buying and Selling Pressure are equal.
Can be used for Demand/Supply analysis and evaluate the support/resistance levels.

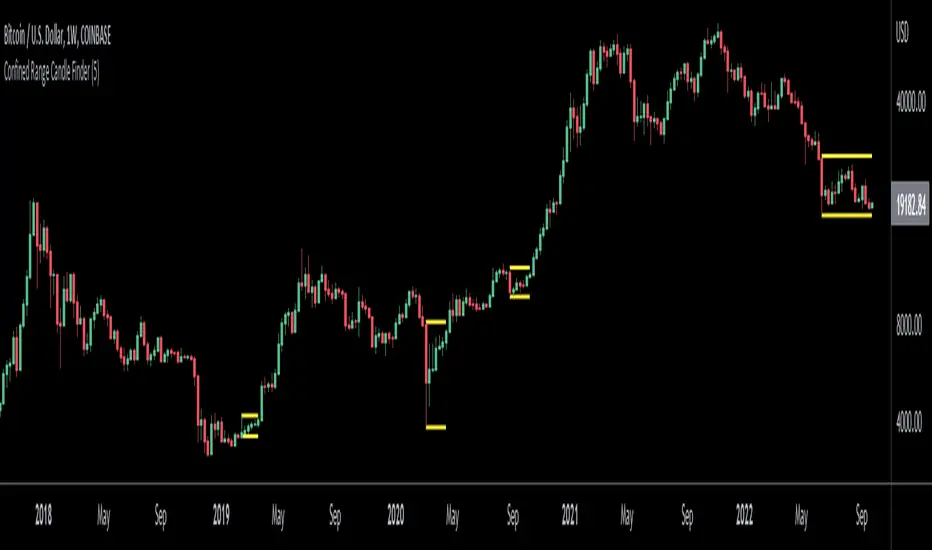
Confined Range Candle FinderThis indicator finds candlesticks which are confined within the range of a previous candlestick. This indicates volatility contraction which often leads to volatility expansion, i.e. large price movements.
While every confined range will contain at least 1 inside bar, this indicator differs from the Inside Bar Finder which only finds consecutive inside bars.
This indicator includes options such as:
- The minimum number of candlesticks confined within the range of a previous candlestick to trigger the indicator
- Labels to indicate the number of confined candles
- Signal lines to indicate the high and low of the containing candlestick
Try out this indicator with different options on different timeframes to see if confined ranges increase the probability of identifying the direction of price movements. Breaks or closes outside signal lines can be used to trigger trade signals.
Price Line Extended to the Right with Price Label | by Octopu$🔖 Price Line Extended to the Right with Price Label | by Octopu$
This is an Add-On customization tool for your Chart Price Level.
Tired of having the TradingView's priceline all across the Chart?
And not having the Option to turn it off/extend to right only?
Worry you not. Got solutions for any problems you may have!
As well as many arms.
This Indicator provides an extended price line to the right only,
Starting from the current candle, towards the price levels.
Additionally, provides a quick price label for fast reference.
You can turn on/off the line,
As well as on/off the label.
Colors change according to candle direction:
Up/Down matching Green/Red.
Please remember to turn OFF TradingView's price line.
Otherwise it'll overlap. Price Line/Tag "replaces" that.
Works in Any Time Frame.
On Any Ticker.
(Using ES 5m just as an example:)
www.tradingview.com
SPY
Features:
• Price Tag
• Price Line
• Extend to Right
• Automatic color change
Options:
• Toggle On/Off Price Line
• Toggle On/Off Price Tag
Notes:
v1.0
Indicator release
Changes and updates can come in the future for additional functionalities or per requests.
Did you like it? Boost it. Shoot a message! I'd appreciate if you dropped by to say thanks.
- Octopu$
🐙
