Ichimoku Cloud - AlertsIchimoku cloud
IC is a trend - following system with an indicator similar to moving averages
It predicts price movements
Offers a unique perspective of support and resistance levels.
Conversion Line (Turning Line)
- Measures Short Term Trend
- SIgnals an area of minor support and resistance
Base Line (Confirmation Line)
Measures Medium term trend
Used as Trailing Stop Level.
Lagging Span (Lagging Line)
Used for Confirmation of signals
Can also serve as Support and Resistance Level
Kumo Cloud
Formed of two lines: Span A (Green Line) and Span B (Red Line)
Dynamic Support and Resistance .
HOW TO READ ICHIMOKU INDICATOR
Conversion Line
If the Market Price is above the Conversion Line = Short Term Upward Movement
If the Market Price is below the Conversion Line = Short Term Downward Movement
Increasing Conversion Line = Upward Short Term Trend
Decreasing Conversion Line = Downward Short Term Trend
Base Line
If the Market Price is above the baseline = Medium - term upward trend
If the Market price is below the baseline = Medium - Term downward Trend
Increasing Base Line = Upward Medium term trend
Decreasing Base Line = Downward Medium Term Trend
Lagging Span
The Evolution of the current price action in relation to previous price action
If the Lagging span is above the current price = Bullish Bias
If the Lagging span is below the current price = Bearish Bias
Lagging span near the current price = Trading range
Kumo Cloud
Dynamic Support and Resistance based upon price action.
The longer the price stays below/above the Kumo cloud, the STRONGER the trend is.
When the cloud is wide, the expected support or resistance is strong
When the cloud is thin, the expected support or resistance is weak
Never trade inside the KUMO CLOUD.
HOW TO TRADE WITH ICHIMOKU CLOUD
Baseline and conversion Line crossover (Lagging Span as a Filter)
crossover(conversion line, baseline) = Buy
crossunder(conversion line, baseline) = Sell
FILTER
crossover(conversion line, baseline) and lagging span is Bullish (i.e above the price) = Buy
Crossunder(conversion line, baseline) and lagging span is Bearish (i.e below the price) = Sell
2. Baseline - Conversion line crossover (Kumo cloud Filter)
crossover(conversion line, baseline) above the Kumo Cloud = Strong Buy
crossover(conversion line, baseline) below the Kumo cloud = Weak Buy
crossunder(conversion line, baseline) below the Kumo Cloud = Strong Sell
crossunder(conversion line, baseline) above the Kumo Cloud = Weak Sell
3. Kumo Cloud Breakout
When the price enters the Kumo Cloud, and breaks its Upper wall upward = Bullish Signal
When the price enters the Kumo Cloud, and breaks its Lower wall downward = Bearish Signal
4. Kumo Cloud Crossover
When Span A cuts the Span B from below to the upside and prices are positioned above the Kumo Cloud = Strong Buy Signal
When Span A cuts the Span B from upside to the bottom and the prices are positioned below the Kumo Cloud = Strong Sell
When Span A cuts Span B from bottom to the upside and prices are positioned below the Kumo Cloud = Weak Buy Signal
When Span A cuts Span B from the upside to the bottom and the prices are positioned above the Kumo Cloud = Weak Sell Signal.
NOTE:- Some of the signals collide with each other, but they collide for the same call, so shouldn't really be a problem overall. Let me know if you have any suggestions to nullify the trading Range. Though I do plan on adding my Renko code to it for filtering out Trading Range.
Cloud

MMD System (Magic Clouds)This is combined all-in-one system for Magic Clouds (MMD). It contains:
- Clouds based on pairs of EMA + SMA acting as dynamic support/resistance
- Levels marked when clouds transitioned between each other
- Diamonds level (2 Green - Red - 2 Green OR 2 Red - Green - 2 Red) which acts as levels to be retested in the future by price

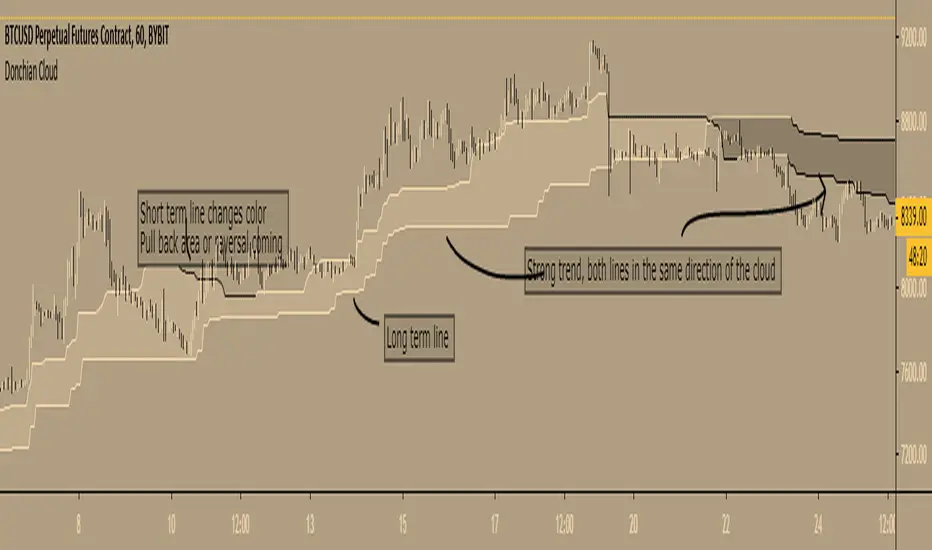
Donchian Cloud - evoA cloud based on the highest high and lowest low of a given period (Donchian), same lines used in Ichimoku Cloud (Conversion line or Base line).
Short term line is based on current time frame, long term line is based on your given multiple of current time frame.
The color of the lines is based on up or down movement.
I stole a piece of code from PineCoders for the multiple time frame:
I have not used this in my trades (yet) so I don't know how good it is, just posting because it looks nice :)
Feel free to share your settings if you can find good ones.
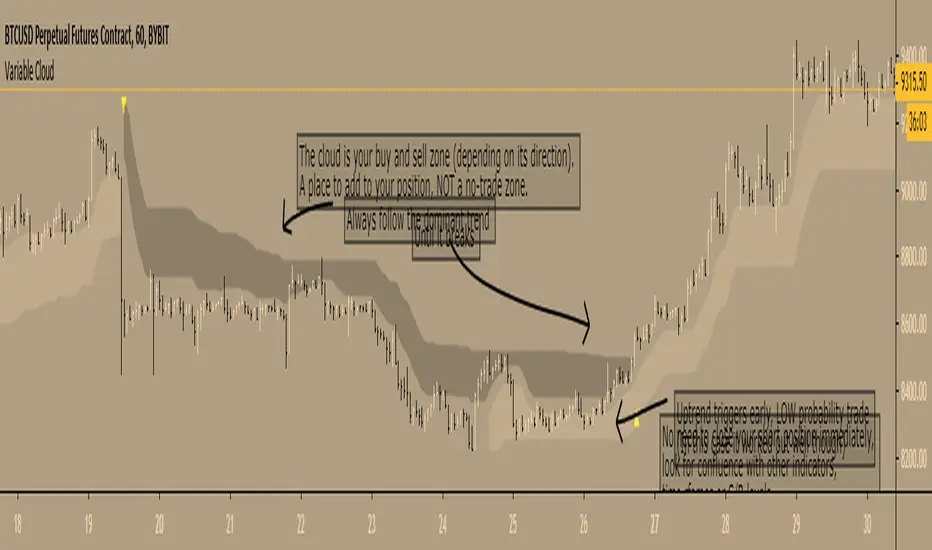
Variable Cloud - evoA Super Trend based on the high and low of a Moving Average, to get an easy view what the current trend is and where to buy and sell.
TIPS
- The 'Closing Source' option is the candle value that triggers the clouds. 'High/Low System' means that a downtrend is over when the candle LOW closes greater than the downtrend (dark cloud), an uptrend is over when the candle HIGH closes less than the uptrend (light cloud). The other options speak for themselves.
- Ideally place your stop loss outside the cloud, as you want to stay in the trend until it breaks to the opposite direction (but that's up to you of course).
- Reversal trades are low probability, you can see them as reversals or ranging before the market continues, I like to lower my risk on those set ups till it breaks the dominant trend.
Here are the scripts I used:
Everget's SuperTrend
LazyBear's VMA
Thanks LazyBear and Everget, I learn a lot from your scripts :)
Variable SuperTrend - evoPlayed around with Lazy Bear's VMA and Gunazzi's SuperTrend Cloud .
It plots an uptrend if the low of a candle gets above the recent downtrend and plots a downtrend if the high of a candle gets below the recent uptrend, you have to wait for the candle to close to confirm the actual trend change.
I use it to give me a direction for longs or shorts, not as a stop/reverse indicator.
Thanks Lazy Bear and Gunazzi :)


BEST Cloud ALL MAHello traders
Hope you're all doing well
This script is a generic cloud generator using a pre-selected set of moving averages (I probably forgot a lot but listed all the ones I used at least once).
A cloud is a visual representation of the gap between two moving averages - it shows right away how big in that gap (=how far they are from each other)
The challenge is to find a cloud such as the price often stay stuck between those 2 MA - and when it's getting finally out (up or down), it would be strong enough to signal a beginning of a trend.
This is a cool intellectual challenge for all aspiring traders
For that script, I defined a trend according to how the 2 MAs are located relative to each other (MA1 > MA2 or MA1 < MA2) and if the price gets out of the cloud.
You'll get :
- the option to color the candles based on a trend
- cool triangles entry signals
- and alerts on those triangles
All the BEST
Dave

Kurotoga CloudKurutoga Cloud is a cousin-inpired cloud of the Ichimoku Kinko Hyo.
It removes the unnecessary fluff and just focus drawing the 50% levels on current mainframe for the typical RSI standard length (14) settings on current time-frame (Lead A) and the Higher time-frame (Lead B)
User should pay particular attention to where the cloud will draw longer straight-lines. Those ranges are 50% ranges of significance and likely to act as target zones for support/resistances in the future.
The cloud can also act a a very reliable trend indicator.
Intraday = D
D = W
W = M
M = 4M

SuperC BF 🚀Based on some code from noro and kiasaki - thank you.
A Super Trend is a trend over a long period of time. There are lots of existing scripts that generate signals based on the overall direction of an instrument. What if we combined this idea with a measure of Money Flow and added a filter to try to avoid choppy sideways action?
I started with a super trend foundation and added an MFI calculation to account for volume flowing into and out of the asset. Then added a Rate of Change function to stay out of trades when there is not much up/down movement.
INSTRUCTIONS
Bright green background = go long
Bright red background = go short
COLOR OVERVIEW
A white background means we don't trade
A green background means we have a long condition
A red background means we have a short condition
The cloud is green when we have a long condition, red when we have a short condition.
The cloud is yellow if we should be in a long already but the current candle is not satisfying all long conditions.
The cloud is orange if we should be in a short already but the current candle is not satisfying all short conditions.
The line at the bottom is MFI - this is green when the current candle is greater than the last, red when it is less than the last.
SIGNAL GENERATION
A long condition is when MFI > MFI AND we are not in a choppy market AND when price is above the super trend.
A short condition is when MFI < MFI AND we are not in a choppy market AND when price is below the super trend.
We use a fixed Stop Loss of 2% here on the daily timeframe for XBT/USD.
If we get stopped out from a long and we still have the conditions for a long, we re-enter. Same for short.

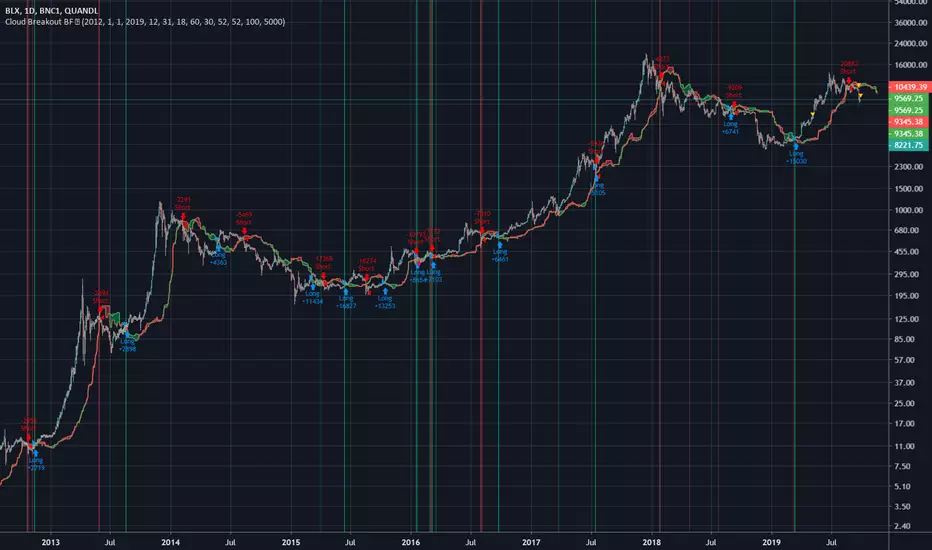
Cloud Breakout BFBased on code by nathanhoffer
Long signal is after a close above Kumo cloud, short signal after close below it.
You can adjust stuff in the settings.
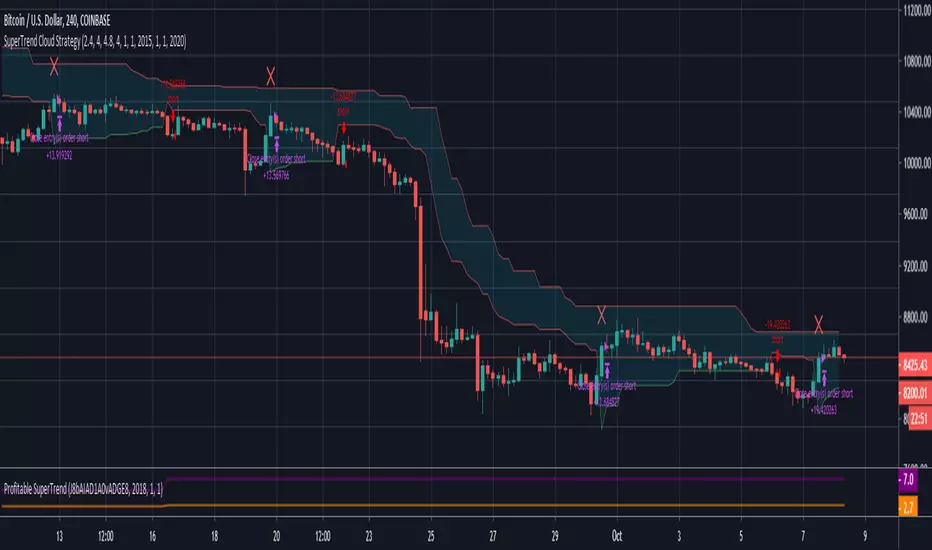
SuperTrend Cloud StrategyExperimental strategy to improve accuracy of SuperTrend Cloud. I am attempting to use STD deviation to manipulate the multiplier of the SuperTrend cloud. Greater STD Deviation = Oscillation in price action which can be applied to multiplier of SuperTrend to filter out bad trades and improve accuracy.

Ultimate Algorithm Builder (Single Trend)Hello traders
This is a fantastic tool to detect convergence between the following indicators :
Overlay - meaning if the price close above/below the SMA 50
Trend Signal - to detect if the the DOW law is broken and predict a possible reversal - en.wikipedia.org/wiki/Dow_theory
In other words, it detects if the higher highs or lower lows sequence is broken
MACD or MACD Zero Lag
MM Cross - Cross of moving averages
Ichimoku - if the price closes below/above the cloud
Supertrend - used to detect polarity zones
TSI Shadow - propieraty indicator - URL :
It's ultra flexible as you check which indicator you need in your own strategy. That's why I called it the Ultimate Algorithm Builder
Enjoy
Dave

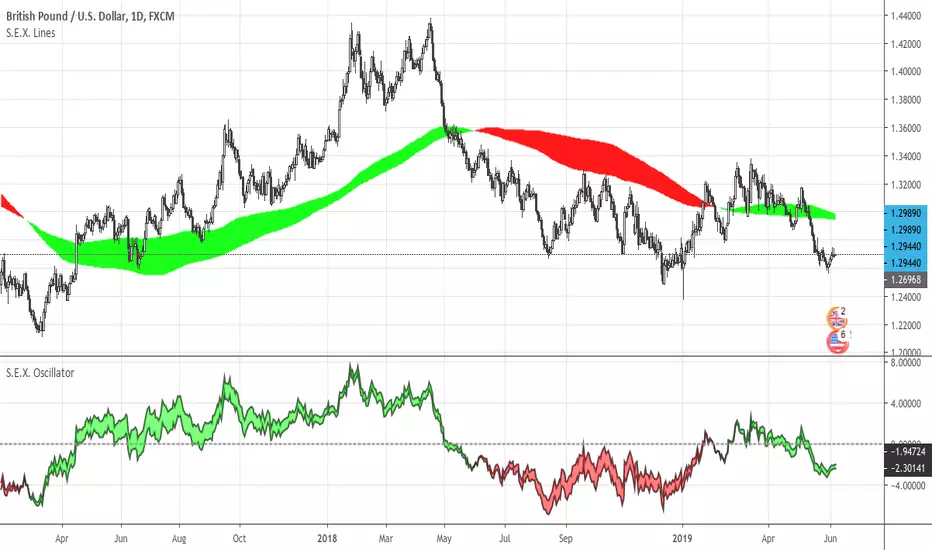
S.E.X. LinesImplementation of S.E.X. Lines as described by Robert Borowski in his book "Forex Sailing".
The indicator allows to plot up to 3 studies, and display them as a Cloud or as Lines.
The indicator allows plotting S.E.X. Lines from higher time frames.
TrendMaster PremiumTrendMaster
TrendMaster is a complete trend following system with strict entry, exit and trade management criteria. The indicator is optimised for weekly, daily and 4-hour candlesticks and can be used for all trending markets. It was developed primarily for less experienced traders that struggle to determine relevant information from irrelevant information when viewing a candlestick chart. The indicator was built to solve the problem that all new traders face.
Setting Up The Indicator
After purchase, open the TradingView indicator library. Under the Invite-Only Scripts section, you will see TrendMaster. Add it to your chart. Next, you must customise your theme settings to allow TrendMaster to take over control of your candle colours. You can find a complete set-up tutorial on our website.
The Cloud
The indicator includes a moving average cloud which serves as a visual guide to local support and resistance. For a signal candle to print, price must trade above the moving average cloud and above the medium-term trend. By requiring multiple criteria we drastically reduce false entries. When price exits the cloud to the upside it typically trends above and finds support at the cloud during retracements.
Candle Colours
By default, TrendMaster will colour your candles in black and white. White candles indicate an uptrend in an asset and the candles will not change colour until the trend has reversed and a counter-trend signal has been printed. Black candles indicate a downtrend, they will remain black until a counter-trend long signal candle has been printed.
Signal candles
A signal candle is printed when the price of an asset closes above or below the moving average cloud and the medium term trend moving average. By requiring two criteria for a single candle to print we will see a drastic reduction in the number of false signals.
The TrendMaster entry technique further reduces the likelihood of false entries. To enter a trade we do not buy the signal candle immediately. Instead, we treat the signal candle as an indication that a trend change is possible. We want to see confirmation of this trend before making an entry. To enter we place a pending order a few ticks above or below the high or low of the signal candle. By doing this we only enter a trade when the asset has shown a continuation in the direction of the suggested trend change.
Once a trade has been taken we remain in that trade until either we have been stopped out on the break of a Williams fractal or the trend has reversed by printing an opposite to trend signal candle. It is important that we remain with the trend to ensure that we capture the maximum opportunity available.
If you would like to use TrendMaster or any of our other Indicators, please visit my site. Here you can purchase one of our packages which include indicators, market scanner bots and a large Discord community. You will also find educational content and how to guides for our indicators.
Our Story
Founded in 2018 by IchimokuScholar and C00kie, TrendMaster is a team that produces technical analysis indicators with an emphasis on simplicity and noise reduction. We support a large community with educational content, automated market scanners and mentoring in our private chat rooms. We produce technical analysis indicators geared primarily towards the emerging Cryptocurrency asset class. We provide educational material to assist trader development and host a large online trend following community. All of our products are designed to help traders distinguish relevant information from background noise. Our indicators encourage disciplined trade management to maximise the opportunity captured while minimising losses.
IchimokuScholar
IchimokuScholar – In 2017 I retired from a career in higher education to focus on Trading. I like to trade long term trends, focusing primarily on continuation setups. I am dedicated to sharing my knowledge of trading and take great pleasure in simplifying technical analysis for newer traders.
C00kie
I started trading crypto in 2017 and immediately started coding a bunch of tools to improve my quality of life. Some definitely worked out better than others. Like to trade the higher timeframes and drawing horizontal lines on charts. I am also pretty much obligated to like cookies.

Momentum Strategy Indicator by ZekisA very powerful strategy with great results that combine a multitude of indicators like Anchored Momentum, Stochastic Momentum Index, Bollinger Bands, Stochastic RSI, a formation of 3 trend indicators that forms a cloud , combinations of EMAs and a lot of condition to met for entries, TP, SL ....
Statistics for March 2019:
*320 long signals for all Binances coins paired with BTC
*208 (65%) winning trades
*108 (33.75%) losing trades
*4 (1.25%) trades still active
*total profit - 486%
*compound profit - 8750%
Time frame recommended: 4h
Conditions for Long entries:
AMOM in bullish cross/side
SMI in bullisih cross/side
Price above BB middle line
SRSI below 50 and heading upward
3x trend cloud must be green/bullish and the price needs to be above the cloud
Price must to be above EMA 400
EMA 100 must to go in an upward direction
The candle must not exceed 10% in height
(all values are preset)
SL line is calculated based on previous structure low (lowest low) from 10 candles in the past(the value can be changed)
TP line is calculated at 1:1 ratio, so at the same distance like SL is from signal, but mirrored
The background is changing when it enters in bull or bear side
Candles are colored for entries for a better view
Alerts are added for entries, TP and SL
Max candle high can be adjusted, according to the market (lower value for a market with low volatility and vice versa)
TP and SL lines calculation(previous structure low) can be adjusted, according to market conditions
(all values are preset, the strategy is ready to go)
Don't go blind with any indicator, do your research before involving real money
Enjoy!
@Zekis

Volume Cloud [LucF]A strictly volume-based cloud. It plots current volume (green line) over its 20-period linear regression (red line) on the chart. Unlike Ichimoku's cloud, it is not offset. While probably not something that you would have on your charts all the time, it can provide a useful way to study the interaction between price and volume.
Because the green line is the current volume, you can forego volume columns when using the indicator.
Volume Cloud does have practical uses. I will show here how I use volume to help me in selecting better probability entries, with only Volume Cloud and my TLD indicator on the chart (the Volume Columns are there to provide context for first-time users of the Volume Cloud).
When looking for entries, I’m trying to find spots where a reversal from a bottom or a continuation after a pause is confirmed by increasing volume (preferably above average) candles with proper wick/body structure. The candle structure of increasing volume candles is important because for me, it provides granularity on the volume action during the candle. I view wicks as failed tests and body height as reinforcement of the price movement. As for candles where volume is not increasing, I mostly ignore them. This is a simplified account of my mindset; just the stories I trade with and that I believe provide an edge—and profits. I certainly don’t pretend having found an infallible way to trade, and there is much more to it that I can explain here, but let’s look at a chart.
Point 1: Solid increasing volume and above average down candle, but I don’t enter on big candles. The volume on that candle has reached a new high though, so I’m thinking bearish sentiment for the next bars.
Point 2: Nicely formed above average increasing volume candle, but I’m looking to short. A similar’ish candle 4 bars back was followed by non-descript action. After 2, a test of past resistance fails before reaching it and a lower low and then a lower high bring us to point 3.
Point 3: Exactly what I’m looking for. No upper wick, solid body that’s not too big, and the highest volume reached on chart yet as a bonus. I enter on the following candle and because of the solid context, I can use a tight stop at the previous candle’s high. Going down, I will move my stop to the high of any increasing volume candle going in my direction, starting when that point is at least as far from my entry as my stop (RR=1).
Point 4: This is the last point where I move my stop at the candle’s high and get stopped out at the following candle for a RR=3.75 trade. Notice how the very high volume at point 4 generates a relatively small body. This is often a sign of stopping volume that portends a reversal or a pause.
Point 5: A first above average increasing volume candle, but with longish wicks that don’t fit my idea of a solid candle. Definitely not a strong enough sign to bet on a reversal from the recent strong descent.
Point 6: This candle is a different story altogether. No lower wick, reasonably sized body, double the volume of previous candle and a close way above the previous 20 candles. Long entry with stop at candle 6’s low. I don’t move my stop on the candle following my entry because it wouldn’t put me at RR=1, so the first time I move my stop up is at candle just before point 7.
Point 7: I get stopped out for RR=3 after that candle because I will have moved my stop a second time, at candle’s 7 low.
I didn’t make these trades (can’t even short on Binance yet), and while this is a typical a posteriori story, it does reflect what I do in reality.

Hull cloudIntroducing a new indicator - Hull cloud. It bears some resemblance to the Ichimoku cloud , but is basically built with the Hull moving average , using a Fibonacci sequence with the usual seed of 0,1 for the lengths and offset (55, 89, 144, 233, 377, 610). These settings can be changed by the user.
1. Simple Hull MA - Hull MA with default of 89 periods.
2. Cloud positive line - Short period of 233 to make the positive line of the cloud.
3. Cloud negative line - Long period of 610 to make the negative line of the cloud.
By default, cloud is offset (forward) by 55 periods.
4. Lagging span - 144 period Hull MA with negative offset of 89 periods.
5. Forward span - 377 period Hull MA with positive offset of 144 periods.


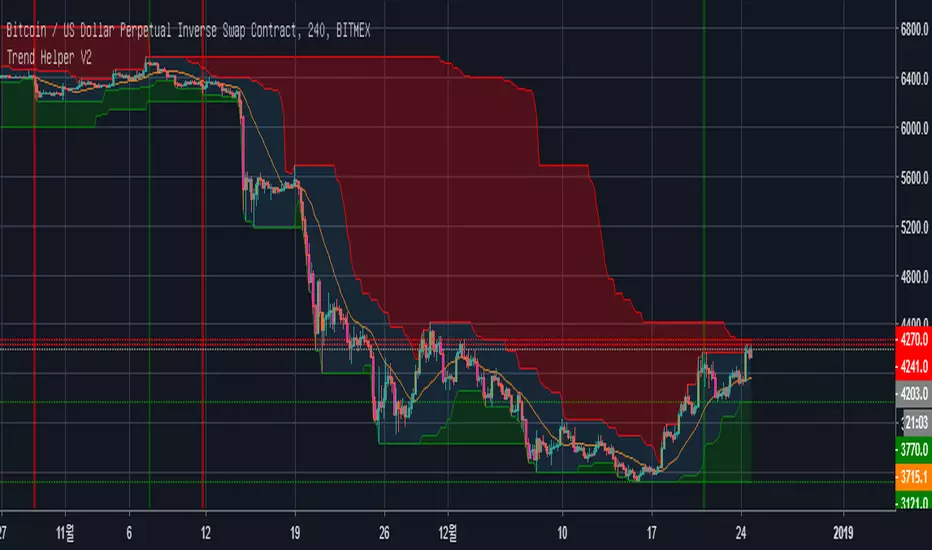
Trend Helper트레이딩의 90%는 추세입니다.
추세에 반대되는 트레이딩은 실패 확률이 매우 높으며
추세에 반대되는 물타기의 끝은 청산입니다.
Swing High/Swing Low 를 통해 만들어지는 구름입니다.
초록색 구름(양운)이 두껍다면 상승추세.
빨간색 구름(음운)이 두껍다면 하락추세.
*일목구름 아닙니다.
--------------------------------------------------------------------
Trading is all about TREND.
Trading against the trend always has high risks, and averaging down against the trend often leads to liquidation.
The script has clouds based on Swing High/Swing Low
If green cloud is thicker than red, it's uptrend.
If red cloud is thicker than green, it's downtrend.
*this is not Ichimoku Cloud.
ATR Volatility Spectrum
This indicator estimates price volatility and it is based on ATR only.
The advantage of this indicator is that it can be used with any pair, any time frame.
The fluctuations of a short period ATR with respect to a gently ATR with high period
are calculated.
The only parameters are the periods of the reference ATR and fast ATR, which could be
safely let untouched and modified by experts.
RED areas depict low volatility
GREEN areas depict high volatility.
When the clouds are outside the region delimited by the aqua lines we have
extreme conditions:
Extremely low volatility = red cloud outside the aqua bands
Extremely high volatility = green cloud outside the aqua bands
Vitelot/yanez/Vts December 2018.
Hitting the like button is free act of gratitude

50% fibbonacci (Lirshah)50% fibonacci is an indicator created by lirshah programming team,
simplicity and showing short waves against the major trend and 100% none repainting signals are the strong points of this indicator.
the 50% fibonacci indicator is compatible with all markets and securities, and can be applied to different time frames.

CryptocloudHere's a cloud witn both, original & crypto settings.
I had to make some little tweaks in order to get the cloud accurate.
Works well & has more fun in low timeframes. 3D effect :)
