Waldo's RSI Color Trend Candles
TradingView Description for Waldo's RSI Color Trend Candles
Title: Waldo's RSI Color Trend Candles
Short Title: Waldo RSI CTC
Overview:
Waldo's RSI Color Trend Candles is a visually intuitive indicator designed to enhance your trading experience by color-coding candlesticks based on the integration of Relative Strength Index (RSI) momentum and moving average trend analysis. This innovative tool overlays directly on your price chart, providing a clear, color-based representation of market sentiment and trend direction.
What is it?
This indicator combines the power of RSI with the simplicity of moving averages to offer traders a unique way to visualize market conditions:
RSI Integration: The RSI is computed with customizable parameters, allowing traders to adjust how momentum is interpreted. The RSI values influence the primary color of the candles, indicating overbought or oversold market states.
Moving Averages: Utilizing two Simple Moving Averages (SMAs) with user-defined lengths, the indicator helps in identifying trend directions through their crossovers. The fast MA and slow MA can be toggled on/off for visual clarity.
Color Trend Candles: The 'Color Trend Candles' feature uses a dynamic color scheme to reflect different market conditions:
Purple for overbought conditions when RSI exceeds the set threshold (default 70).
Blue for oversold conditions when RSI falls below the set threshold (default 44).
Green indicates a bullish trend, confirmed by both price action and RSI being bullish (fast MA crossing above slow MA, with price above the slow MA).
Red signals a bearish trend, when both price and RSI are bearish (fast MA crossing below slow MA, with price below the slow MA).
Gray for neutral or mixed market sentiment, where signals are less clear or contradictory.
How to Use It:
Waldo's RSI Color Trend Candles is tailored for traders who appreciate visual cues in their trading strategy:
Trend and Momentum Insight: The color of each candle gives an immediate visual representation of both the trend (via MA crossovers) and momentum (via RSI). Green and red candles align with bullish or bearish trends, respectively, providing a quick reference for market direction.
Identifying Extreme Conditions: Purple and blue candles highlight potential reversal zones or areas where the market might be overstretched, offering opportunities for contrarian trades or to anticipate market corrections.
Customization: Users can adjust the RSI length, overbought/oversold levels, and the lengths of the moving averages to align with their trading style or the specific characteristics of the asset they're trading.
This customization ensures the indicator can be tailored to various market conditions.
Simplified Decision Making: Designed for traders who prefer a visual approach, this indicator simplifies the decision-making process by encoding complex market data into an easy-to-understand color system.
However, for a robust trading strategy, it's recommended to use it alongside other analytical tools.
Control Over Display: The option to show or hide moving averages and to enable or disable the color-coding of candles provides users with control over how information is presented, allowing for a cleaner chart or more detailed analysis as preferred.
Conclusion:
Waldo's RSI Color Trend Candles offers a fresh, visually appealing method to interpret market trends and momentum through the color of candlesticks. It's ideal for traders looking for a straightforward way to gauge market sentiment at a glance. While this indicator can significantly enhance your trading setup, remember to incorporate it within a broader strategy, using additional confirmation from other indicators or analysis methods to manage risk and validate trading decisions. Dive into the colorful world of trading with Waldo's RSI Color Trend Candles and let the market's mood guide your trades with clarity and ease.
Coloredbars

Dynamic Deviation Levels [BigBeluga]Dynamic Deviation Levels is an innovative indicator designed to analyze price deviations relative to a smoothed midline. It provides traders with visual cues for overbought/oversold zones, price momentum, levels through labeled deviations and gradient candle coloring.
🔵Key Features:
Smoothed Midline:
A central line calculated as a smoothed median of the price source, serving as the baseline for price deviation analysis.
Dynamic Deviation Levels:
- Three deviation levels are plotted above and below the midline, with labels (1, 2, 3, -1, -2, -3) marking significant price movements.
- Helps traders identify overbought and oversold market conditions.
Heat-Colored Candles:
- Candle colors shift in intensity based on the deviation level, with four gradient shades for both upward and downward movements.
- Quickly highlights market extremes or stable zones.
Interactive Color Scale:
- A gradient scale at the bottom right of the chart visually represents deviation values.
- A triangle marker indicates the current price deviation in real time.
Optional Deviation Levels Display:
- Traders can enable all dynamic levels on the chart to visualize support and resistance areas dynamically.
🔵Usage and Benefits:
Identify Overbought/Oversold Zones: Use labeled deviation levels and heat-colored candles to spot stretched market conditions.
Track Trend Reversals and Momentum: Monitor price interactions with deviation levels for potential trend continuation or reversal signals.
Real-Time Deviation Insights: Leverage the color scale and triangle marker for live deviation tracking and actionable insights.
Map Dynamic Support and Resistance: Enable dynamic levels to highlight key areas where price reactions are likely to occur.
Dynamic Deviation Levels is an indispensable tool for traders aiming to combine price dynamics, momentum analysis, and visual clarity in their trading strategies.

Session Bar/Candle ColoringChange the color of candles within a user-defined trading session. Borders and wicks can be changed as well, not just the body color.
PREFACE
This script can be used an educational resource for those who are interested in learning Pine Script. Therefore, the script is published open source and is organized in a manner that follows the recommended Style Guide .
While the main premise of the indicator is rather simple, the script showcases various things that can be achieved such as conditional plotting, alignment of indicator settings, user input validation, script optimization, and more. The script also has examples of taking into consideration the chart timeframe and/or different chart types (Heikin Ashi, Renko, etc.) that a user might be running it on. Note: for complete beginners, I strongly suggest going through the Pine Script User Manual (possibly more than once).
FEATURES
Besides being able to select a specific time window, the indicator also provides additional color settings for changing the background color or changing the colors of neutral/indecisive candles, as shown in the image below.
This allows for a higher level of customization beyond the TradingView chart settings or other similar scripts that are currently available.
HOW TO USE
First, define the intraday trading session that will contain the candles to modify. The session can be limited to specific days of the week.
Next, select the parts of the candles that should be modified: Body, Borders, Wick, and/or Background.
For each of the candle parts that were enabled, you can select the colors that will be used depending on whether a candle is bullish (⇧), bearish (⇩), or neutral (⇆).
All other indicator settings will have a detailed tooltip to describe its usage and/or effect.
LIMITATIONS
The indicator is not intended to function on Daily or higher timeframes due to the intraday nature of session time windows.
The indicator cannot always automatically detect the chart type being used, therefore the user is requested to manually input the chart type via the " Chart Style " setting.
Depending on the available historical data and the selected choice for the " Portion of bar in session " setting, the indicator may not be able to update very old candles on the chart.
EXAMPLE USAGE
This section will show examples of different scenarios that the indicator can be used for.
Emphasizing a main trading session.
Defining a "Pre/post market hours background" like is available for some symbols (e.g., NASDAQ:AAPL ).
Highlighting in which bar the midnight candle occurs.
Hiding indecision bars (neutral candles).
Showing only "Regular Trading Hours" for a chart that does not have the option to toggle ETH/RTH. To achieve this, the actual chart data is hidden, and only the indicator is visible; alternatively, a 2nd instance of the indicator could change colors to match the chart background.
Using a combination of Bars and Japanese Candlesticks. Alternatively, this could be done by hiding the main chart data and using 2 instances of the indicator (one with " Chart Style " setting as Bars , and the other set to Candles ).
Using a combination of thin and thick bars on Range charts. Note: requires disabling the "Thin Bars" setting for Bar charts in the TradingView chart settings.
NOTES
If using more than one instance of this indicator on the same chart, you can use the TradingView "Save Indicator Template" feature to avoid having to re-configure the multiple indicators at a later time.
This indicator is intended to work "out-of-the-box" thanks to the behind_chart option introduced to Pine Script in October 2024. But you can always manually bring the indicator to the front just in case the color changes are not being seen (using the "More" option in the indicator status line: More > Visual Order > Bring to front ).
Many thanks to fikira for their help and inspiring me to create open source scripts.
Any feedback including bug reports or suggestions for improving the indicator (or source code itself) are always welcome in the comments section.

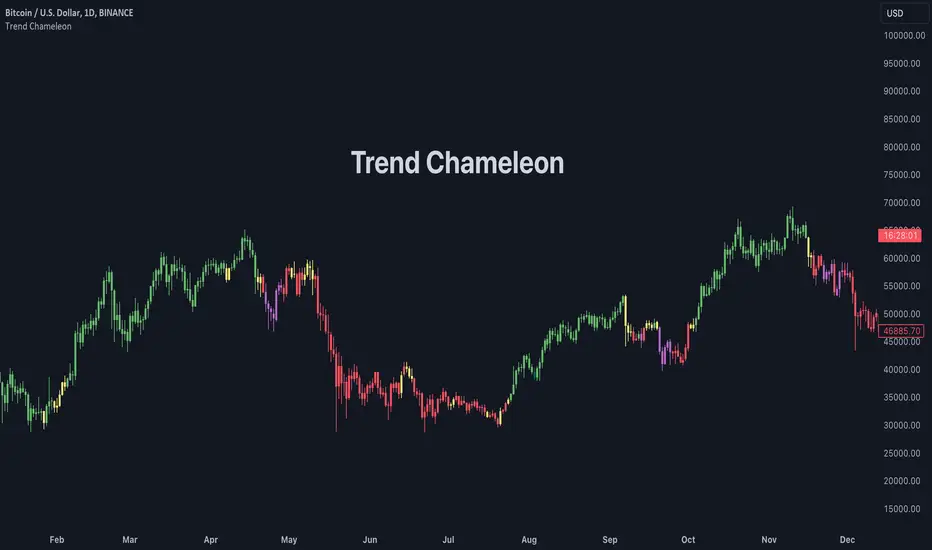
Trend ChameleonThe Trend Chameleon, originally developed by Alex Cole for the Bloomberg Terminal, is a powerful tool designed to simplify trend identification and illuminate potential trading opportunities. It leverages a clear visual display to decode market movements, making it useful for traders of all experience levels.
🟠 Overview
Here's an illustration of how the indicator performs for ES (S&P 500 E-mini Future) on the daily chart:
Trend Chameleon employs a color-coded candle scheme, with each color corresponding to a specific level of trend strength. Purple candles represent the strongest bearish trends, while teal candles signal the most potent bullish momentum. Between these extremes lie red, yellow, and green candles, providing a spectrum of trend direction. This intuitive color coding allows you to quickly grasp the prevailing market sentiment and identify potential entry and exit points for your trades.
🟠 Algorithm
Under the hood, Trend Chameleon evaluates four conditions to provide a directional strength score:
1. Whether the MACD value is positive.
2. Whether the SMA 50 of open prices is above the SMA 50 of the close prices.
3. Whether the ROC indicator value is positive.
4. Whether the current close price is above the SMA 50.
The total number of fulfilled conditions (0 to 4) determines the trend strength, with 0 indicating the most bearish and 4 signifying the strongest bullish trend. This score is then visually represented by coloring the bars on the chart.
🟠 Note
If you don't see the bars being properly colored after adding this indicator, please ensure Trend Chameleon is positioned on top of all other indicators in your chart. This can be easily achieved by hovering over the indicator's name, clicking the three dots, selecting "Visual Order," and then choosing "Bring to front."
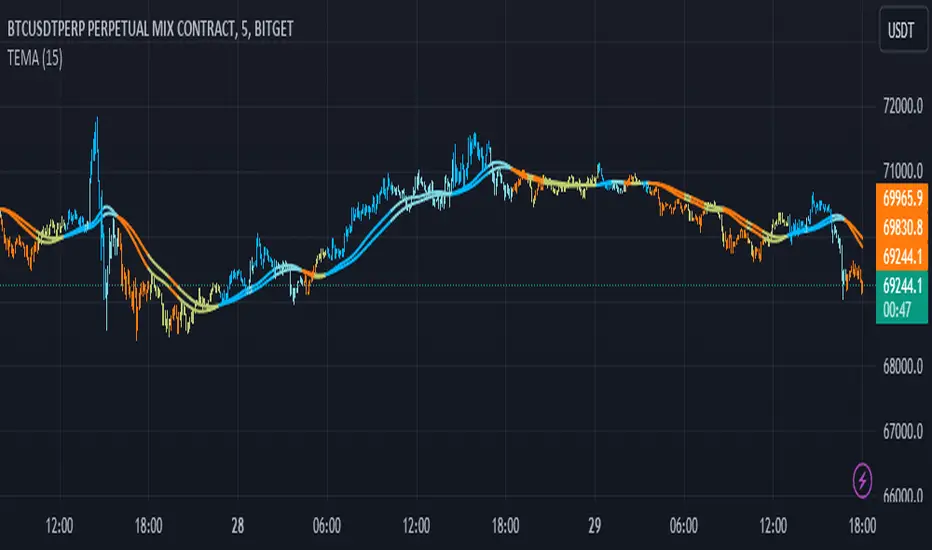
Triple EMA Distance IndicatorTriple EMA Distance Indicator
The Triple EMA Distance indicator comprises two sets of triple exponential moving averages (EMAs). One set uses the same smoothing length for all EMAs, while the other set doubles the length for the last EMA. This indicator provides visual cues based on the relationship between these EMAs and candlestick patterns.
Blue Condition:
Indicates when the fast EMA is above the slow EMA.
The distance between the two EMAs is increasing.
Candlesticks and EMAs are colored light blue.
Orange Condition:
Activates when the fast EMA is below the slow EMA.
The distance between the two EMAs is increasing.
Candlesticks and EMAs are colored orange.
Beige Condition:
Occurs when the fast EMA is below the slow EMA.
The distance between the two EMAs is decreasing.
Candlesticks and EMAs are colored beige.
Light Blue Condition:
Represents when the fast EMA is above the slow EMA.
The distance between the two EMAs is decreasing.
Candlesticks and EMAs are colored light blue.
Gradient Candles
The Gradient Candles indicator is crafted to be a comprehensive replacement for default candlesticks, offering users an enhanced and visually stunning alternative. To experience the intended results and fully immerse in the distinctive features of Gradient Candles, it's recommended to hide the default candlesticks. This ensures that traders can fully appreciate the unique color gradient and dynamic visual representation that this indicator brings to chart analysis.
Designed to elevate chart analysis, Gradient Candles not only offer a fresh perspective on price movements but also captivate users with their visually appealing representation of market dynamics. Departing from traditional candlestick coloration, the dynamic adaptation of colors, the 'color.from_gradient()' function plays a pivotal role in translating the current source value into a color that reflects its proximity to the highest and lowest values and corresponding colors. Beyond its analytical capabilities, Gradient Candles transform market analysis into an aesthetically enriching experience, providing traders with a unique and comprehensive tool for their technical analysis toolkit.
Traders can tailor the indicator's appearance to suit their preferences and seamlessly integrate it into their personal trading environment. From color inversion to transparency adjustments and the option to fill candles instead of outlining them, the customization features empower users to create a visual representation that aligns precisely with their unique preferences.

Candle Color By OHLC ComparisonThis indicator is designed to help you recognize the price movements within a candle/bar more quickly and easily. Typically, candle coloring is based on the opening and closing prices, but in this indicator, I followed the OHLC values in reverse order: starting with closing, low, high, and then opening. Each of these is compared with the value in the previous candle. I assigned the least importance to the opening, hence did not include it in the color determination. To make the colors memorable, I used a rainbow-like color scale; with purple representing the highest value and maroon the lowest. You can also change the colors if you wish. Additionally, if you want to set alarms, I assigned values to the candles; the highest being 16 and the lowest 1. A thicker barchart provides a better visual representation.
For instance, consider the monthly chart of the NASDAQ 100. After a prolonged positive trend, when our indicator shows a negative maroon bar (representing a low value) for the first time, it could signal a change in the trend direction. In this scenario, the appearance of the maroon bar serves as a crucial alert for investors to review their current positions or prepare for a potential downtrend. This indicator provides users with a significant advantage in identifying such critical turning points and assists them in quickly adapting to market dynamics.

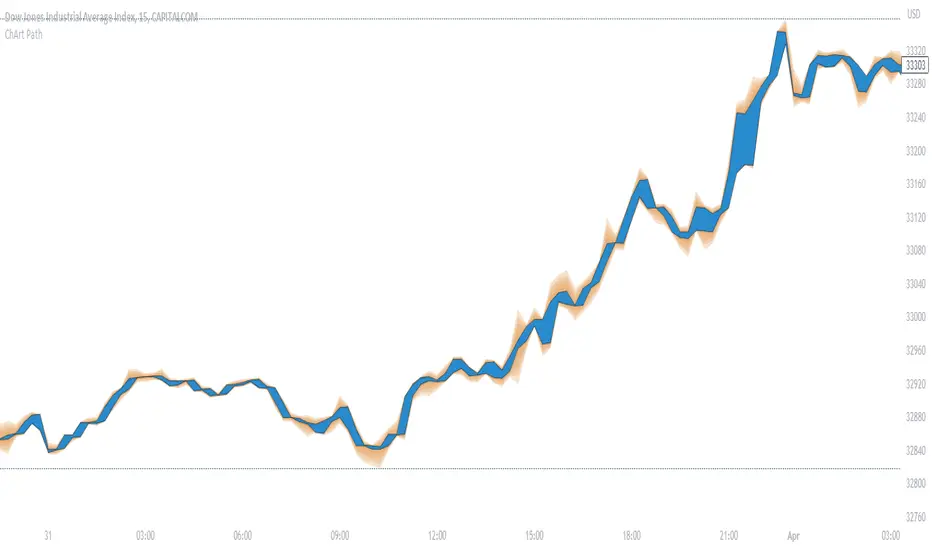
ChArt Path"ChArt Path" shows the same datas as the candles, but as a channel, instead of individual candles.
It allows to focus on the direction of the price (instead of wondering the meaning of each candle), which hopefully simplifies the analysis, and reduces the confusion.
Also, it is artistically customizable!
A little time might be necessary to get used to this indicator.
NOTES FOR INSTALLATION:
- Japanese candles might be more expressive than Heiken Ashi, with this indicator.
- Hide the candles in the chart settings (right click on an empty space in the chart, then "Settings", "Symbol", and uncheck "Body", "Borders" and "Wick").
- Add "ChArt Path" to the chart.
- In the indicator's settings, choose the options you prefer. The Advanced setting are tuned by default for dark themes (bgcolor: black/#0a0c12). Feel free to make them your own!
HOW TO READ THE CHART?
- The path is between 2 borders (black by default) that represent the body of the candle (without the wicks).
- The wicks are represented around the path, as a gradient. This makes a price rejection very easy to spot, as a spike for ex.
SETTINGS
The standard settings are simple. You can pick 2 colors (bullish and bearish) for the path. And 1 color for the wicks.
The advanced settings let you customize the wicks' colors and opacity. You can also activate the gradient of volumes inside the path, to indicate the volume behind each candle.
HOW TO USE CHART PATH?
I use it on 2 timeframes (direction/entry), both with FREMA Trend (See below).
When there is a wick spike (price rejection), followed by an arrow signal in FREMA Trend, then there might be an opportunity. I look for confirmations from different origins, like volume, momentum, and cycles.
DO NOT BASE YOUR TRADING DECISIONS ON 1 SINGLE INDICATOR'S SIGNALS.
Always confirm your ideas by other means, like price action and indicators of a different nature.
NOTES ABOUT THE GRADIENT OF VOLUMES:
The more intense is the color, the bigger is the volume.
The unit is a 400 periods moving average of the volumes, considered as 1 volume.
Each color represents half of this volume. For ex: Grays indicate under (or equal) to the 400 MA (low volumes). Bright yellow represents above 7 times the 400 MA (very high volumes).
When there's no available volume datas, the candles turn bright green by default.
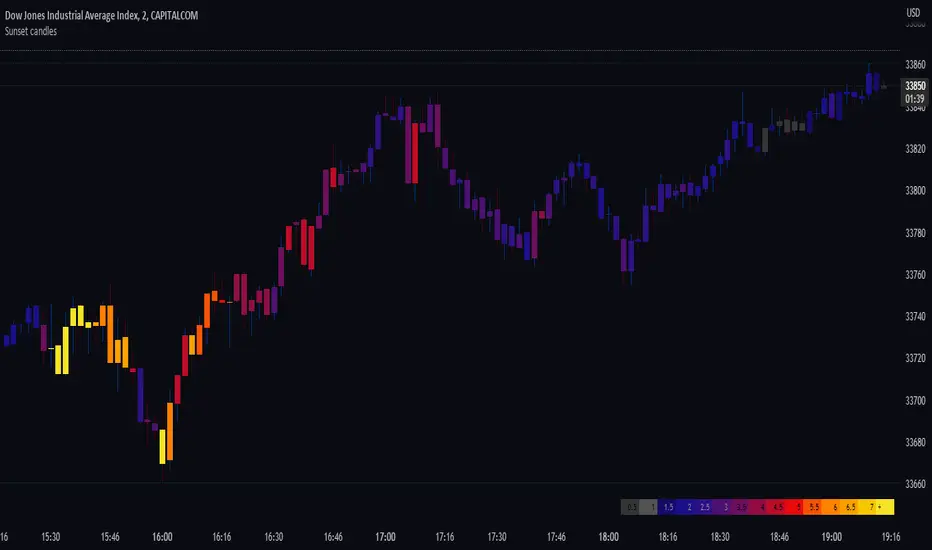
Sunset candlesDisplays the volume behind each candle with colors, to visualise their evolution over time, directly in the chart.
This indicator is best suited for dark mode (Suggested background color: #0a0c12).
The more intense is the color, the bigger is the volume.
The unit is a 400 periods moving average of the volume, considered as 1 volume.
Each color represents half of this volume. For ex: Grays indicate under (or equal) to the 400 MA (low volumes). Bright yellow represents above 7 times the 400 MA (very high volumes).
When there's no available volume datas, the candles turn bright green by default.
The wicks' colors stay the same, and can still indicate the direction of the candle.
In the settings, you can show/hide the gradient of the volume. By moving your chart over this gradient, it is possible to compare the candles to the colors, and read the corresponding volume number.
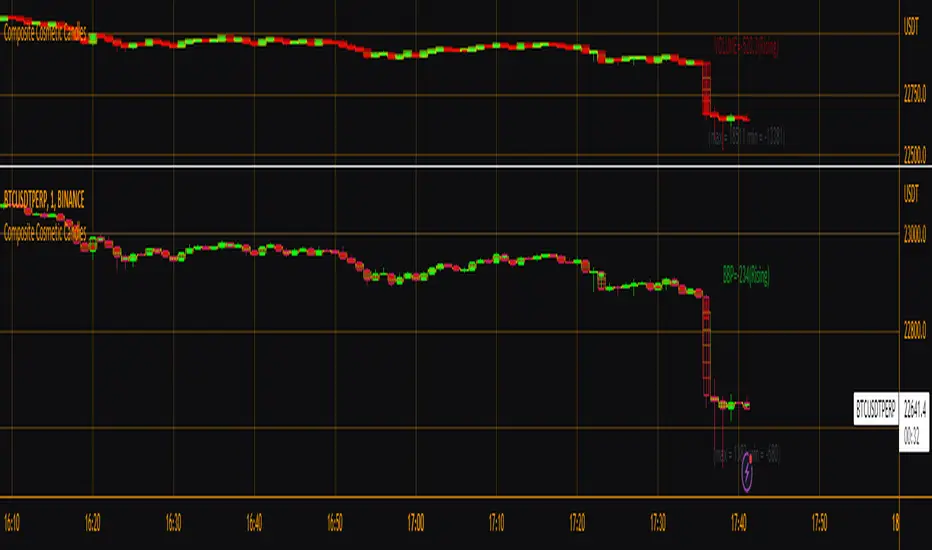
Composite Cosmetic CandlesThis is effectively version 2 of my script "Candle Fill % Meter", with a few different/more options available in a more compact form. Choose between multiple oscillator sources, # of dividing lines, and solid or gradient candle fill. Once again this script is intended for use with hollow candles! This script enables you to see more information with less screen space taken up, not to mention it looks nice. Labels by last bar also toggleable in the settings.
OB EmaCross + BBThis is my setup and the way I like to trade.
It is based in an EMA cross ( 9 x 21) and the Bollinger Bands without the central Moving Average.
I prefer to use the EMA cross in the middle of the bands.
It is also possible to activate "Colored Bars" to paint the candles according to the EMA cross: green if the candles are above both EMAs, white when at least one of them are in between EMAs and red if they are both below EMAs.
My operational works like this:
- Buy when price is above EMAs
- Sell when price is belos EMAs
Of course, I use BB to give me the direction of the trend and I only enter in a trade when the price is in the same trend of the BB.
I avoid trades when the bands are getting narrowed.
I hope you enjoy my indicator and let me know if you have any suggestion! ;)

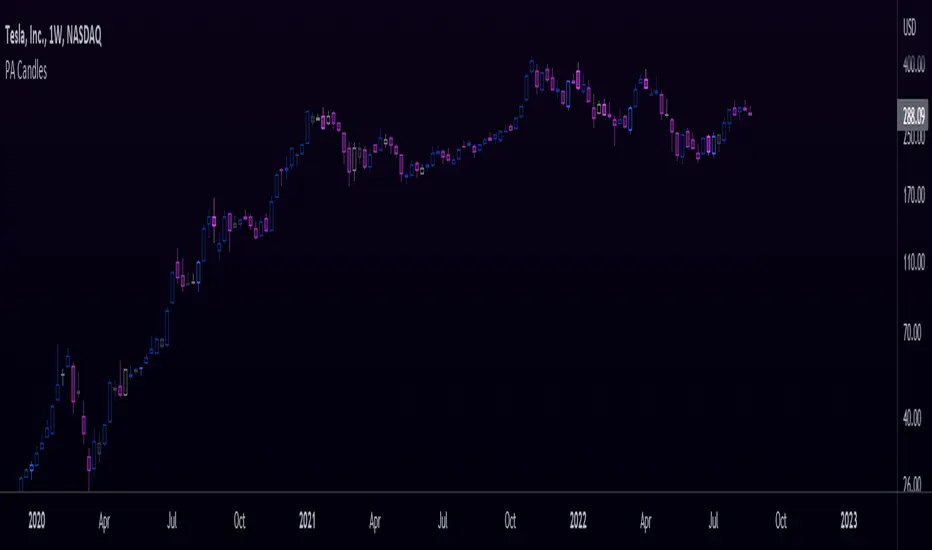
Price Action CandlesThis simple script provides a visual aid for price action traders by coloring outside & inside candles, which in effect leaves the trader with 6 possible candle colors:
-Regular bullish candle
-Outside bullish candle
-Inside bullish candle
-Regular bearish candle
-Outside bearish candle
-Inside bearish candle
These candlesticks may provide powerful signals when used in conjunction with key levels, market structure and chart patterns.
Make sure to disable the regular candlesticks (body, borders and wicks) in the symbol tab inside the configuration menu!
Hope it can help someone!
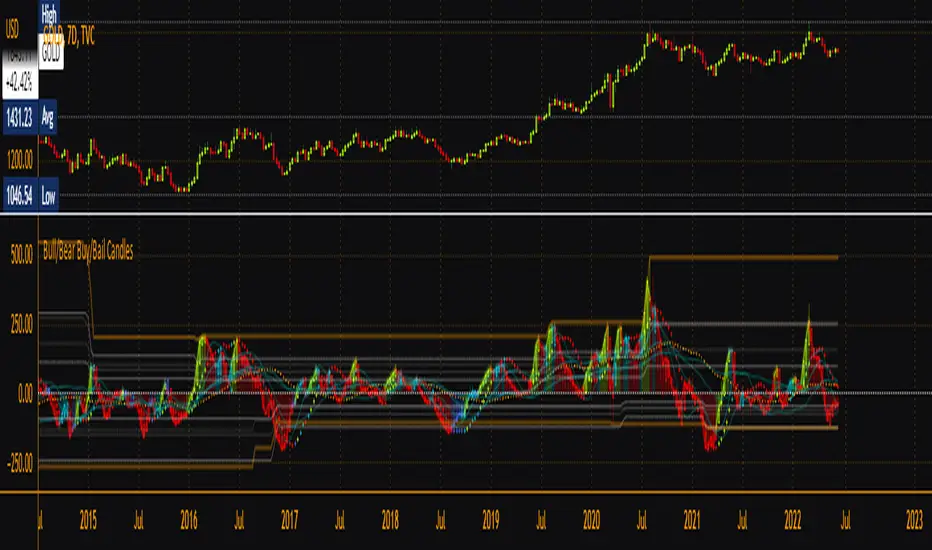
Bull/Bear Buy/Bail CandlesBased on BullBearPower indicator, this is a heavily modified version with colored candles to show when bulls or bears are buying or bailing. Includes Fibonacci Levels based on Highest/Lowest value in variable length, along with optional second timeframe and alternative calculation for candles and linear regression curves for increased versatility. Green = bullish /long, Aqua = still-bullish albeit weakening, blue = weak albeit strengthening and red = weak/short. Perfect as a confirmation indicator for those looking to time markets.
RSI CrayonsThis simple script colors candles based on the Relative Strength Index. RSI Values > 50 are solid colors, RSI values < 50 are pastels, with additional colors/fills/alerts for overheated and oversold (both user adjustable thresholds) conditions.
As an added bonus, RSI can be calculated by non-traditional methods (not using the running/smoothed moving average) using a variety of different moving averages, but you may have to adjust the time-frame for 'faster' moving averages. An option for plotting the moving average basis is also available.
Value Added:
This indicator can be used to chart RSI without adding an "oscillator frame" to your chart, since we don't normally care too much about RSI values between 30 and 70 under normal conditions.

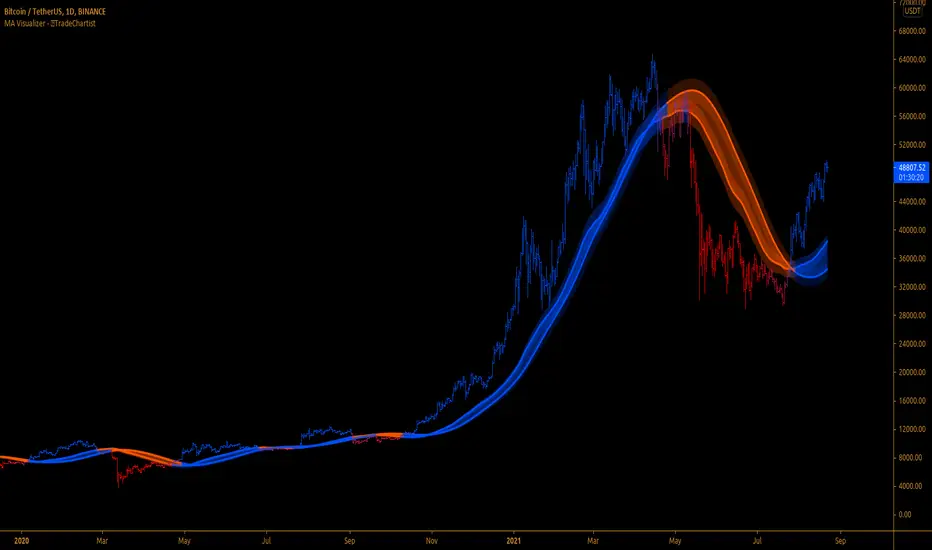
MA Visualizer™TradeChartist MA Visualizer is a Moving Average based indicator aimed to visualize price action in relation to the Moving Average in a visually engaging way.
===================================================================================================================
█ MA Visualizer Features
11 different Moving Averages to choose from the settings to visualize based on MA Visualizer Length (Default - 55 period SMA).
2 Smoothing options (default - 0, 0 uses MA length as Smoothing factor, 1 uses no Smoothing).
4 colour themes to choose from and option to adjust Visualizer Vibrance.
█ Example Charts
1. 1hr chart of OANDA:XAUUSD using 55 period WMA.
2. 15m chart of OANDA:EURUSD using 144 period Tillson T3 MA.
3. 4 hr chart of OANDA:US30USD using 55 period SMMA.
===================================================================================================================
Best Practice: Test with different settings first using Paper Trades before trading with real money
===================================================================================================================
Bollinger Band Color BarsThis is a simple addition to the built in Bollinger Bands script. All it does is replaces the traditional plotting of Bollinger Bands with color bars.

Simple Hull MAA simple code to plot Hull MA with colour coding of plot fill and price bars based on strength.

Heatmap Volume [xdecow]This indicator colors the volume bars and candles according to the volume traded. The calculation of the heat map zones is done as follows:
how many standard deviations the volume are distant from the average volume?
For a better visual experience, place the borders and wicks of the candles in a neutral color.

Ultimate VolumeThis script can display a lot of different volume statistics. It also colours bars depending on a chosen, customisable criterion. Most options are disabled by default and can be reenabled in the settings menu.
FAQ
Why are the bars slightly higher than the default volume bars?
Due to the limitations of Pinescript.
What are the two last values (including the one in white?)
They're there due to the limitations of Pinescript. It used to be possible to prevent certain values from being plotted, but still display them as indicator values, but the functionality of that option was changed and is now WIP so until it's restored, these values are necessary to scale the bars properly.
Why are the percentages formatted as volume?
Due to the limitations of Pinescript.
Why are there so many options?
I don't know. They sort of happened. But you don't have to switch them on.
What is money volume?
It's an average of the bar price multiplied by the bar volume .
Why does the daily average volume display different values than the standard sma volume?
Because mine doesn't take into account the current day. So it doesn't fluctuate intraday. Which, I think, makes more sense.
What is total volume?
It's a sum of the total volume for that day and is reset on the next. This option only works with intraday timeframes.
What is average 1 bar intraday volume?
It's the average volume for 1 intraday bar, based on the current day's values only. Obviously, it only works intraday and changes dynamically. It's not an SMA , it's a simple average of all bars for a given day.
What is all-time 1 bar intraday volume?
It's the average volume for 1 intraday bar, but based on the whole chart's history. It's impossible to select a length for this, again, because of certain limitations.
What is short volume?
It is approximately 1/3rd of the actual short volume , due to the limitations of FINRA. It's multiplied by 3 in the script and it may be not entirely accurate. The short volume % is calculated differently, using the 1/3rd of short and total volume from FINRA.
What are the default threshold values?
They are 150%, 200%, 1000% of the average for the average bar volume and all-time average bar volume options, 10%, 50%, 100% for the average daily volume option and 100K, 500K and 1M for the volume option.

RSI & Volume Coloured BarsCandles get darker when volume is high, and brighter when volume is low. They are red or green depending on whether the RSI is above or below a threshold value, or alternatively you can pick a more vanilla coloring based on current close vs last close or last open.
For personal use as I enjoy the aesthetics of it. The more solid RSI coloring helps highlight the brightness variations from changing volume and makes trends crystal clear.
Inspired by "Volume Based Coloured Bars" by KivancOzbilgic:
and by and by RSI bars chart by taskman9:
BEST Cloud ALL MAHello traders
Hope you're all doing well
This script is a generic cloud generator using a pre-selected set of moving averages (I probably forgot a lot but listed all the ones I used at least once).
A cloud is a visual representation of the gap between two moving averages - it shows right away how big in that gap (=how far they are from each other)
The challenge is to find a cloud such as the price often stay stuck between those 2 MA - and when it's getting finally out (up or down), it would be strong enough to signal a beginning of a trend.
This is a cool intellectual challenge for all aspiring traders
For that script, I defined a trend according to how the 2 MAs are located relative to each other (MA1 > MA2 or MA1 < MA2) and if the price gets out of the cloud.
You'll get :
- the option to color the candles based on a trend
- cool triangles entry signals
- and alerts on those triangles
All the BEST
Dave

Chop FilterIt is common knowledge that most traders lose money by leaving trends too early and not letting profits run. Chop Filter attempts to paint over wrong-colored candles which might psychologically cause traders to bail off the trend. It also tries to detect potential trend reversals (experimental).
How it works. Chop Filter highlights wicks with a shaded background based on close relative to a volume-weighted moving average (vwma). If it closes up, or if there are higher lows, it shades the background blue. If it closes down, or there are lower highs, it colors the background red. Finally, it shows a big arrow indicating the direction prices are headed, based on the vwma. The arrow helps me to consider where prices might go, and play out different scenarios, rather than being a true prediction. In fact, it is often wrong when there is a lot of volatility, which can also be a good thing.
I find the shaded background has a calming effect that reduces stress. It also helps identify trends in the wicks that are otherwise difficult to see.
There are some other options to play with, such as highlighting narrowing or widening price action in yellow or optionally showing the vwma .
Have fun!

