ck - EMA Cross with AlertsDisplays 5 popular EMAs (you can hide any you don’t want to see from the “Styles” screen when editing the config).
Set the values for your EMAs by clicking the cog after adding this indicator to your chart.
A Long or Short signal is fired when EMA1 crosses EMA2 - a cross up is a Long signal, a cross down is a Short signal.
Connect to your Bots (3commas / 3C.exchange recommended) to automate buys and sells!
Cross

MA-KIRILDIM-SANAThis is a lower block indicator. It helps us to follow the moving average crosses in the lower section in a single indicator without adding any moving averages in the main window.
When MA1 breaks MA2 up, the background color turns green or otherwise, the background becomes red. If you want, you can follow the lines of moving averages in here.
Three averages can be used in the system.
- SMA(Simple Moving Average)
- EMA(Exponential Moving Average)
- WMA(Weighted Moving Average)
Thanks

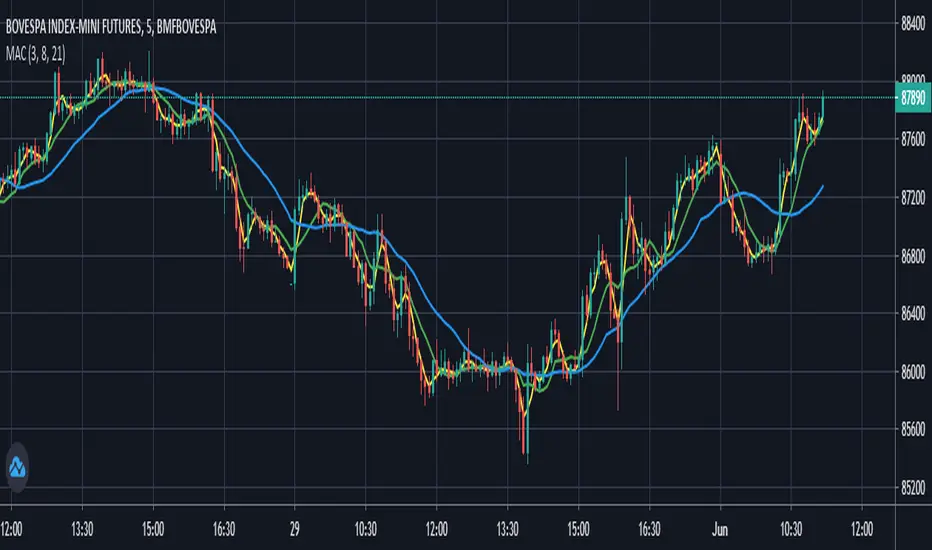
Moving Averages Convergence (Agulhada do Didi)The script is based on a strategy developed by Odir “Didi” Aguiar called “Agulhada do Didi”.
It consists in the use of 3 moving averages:
SMA 3
SMA 8
SMA 21
Strategy:
When the averages come together, preferably they pass through a candle, there is a signal. The crossing of the short average (3) with the long average (21) provides us with a confirma-tion of the entry.
Buy:
The average of 3 periods comes out on top, 8 goes in the middle and 21 goes down.
Sell:
Average of 21 periods comes out on top, 8 in the middle and 3 down.
EMA ConfirmatorShows if the cross of 2 EMAs is bullish or bearish and confirms with the cross of 2 others EMAs from the next upper timeframe.

TTS Triple Threat SMA10-30-200 TLTTS Triple Threat SMA10-30-200 TL is a crossover and crossunder trading system that is based on three simple moving averages (SMA).
The default settings are optimized for 4-hour charts.
The TTS Triple Threat trading system works as follows:
1. Enters BULLISH trade when LE Trade & LONG signals are shown on the chart.
2. Enters BEARISH trade when SE Trade & SHORT signals are shown on the chart.
3. LONG and SHORT signals are shown based on SMA crosses for visual inspection but doesn't mean they are trades. Either LE Trade or SE Trade signals need to be present for a trade to take place.
4. TTS Triple Threat SMA10-30-200 TL uses trailing stop loss settings. The ratios between the profit taking settings and trailing loss stops are important to the strategy. Trailing stop loss exits are shown on the chart as XL STOP LOSS or XS STOP LOSS. Profit exits are shown as XL PROFIT EXIT and XS PROFIT EXIT.

Ichimoku Kumo Switch Indicator [Mehdihz]This simple indicator just shows Ichimoku's Kumo cloud status.
Blue for increasing Kumo
Red for decreasing Kumo

EMA Cross 20/50/100/200EMA Cross 20 50 100 200
Easy identify cross between 20 and 50
Easy identify cross between 20 and 100
Cross between 20 and 50 is good signal for buy and sell.
Cross between 20 and 100 is confirmation signal for buy and sell.
Ichimoku Cloud & ADX & DMI & MACD [tg1]Hi There! Sharing my strategy that is mainly build on Ichimoku Kinko Hyo and its Tenkan and Kijun crosses.
In addition, I added a few other indicators to have less false breakout signals. See more details below:
Long conditions :
1) Tenkan crosses over Kijun
2) Tenkan & Kijun > Kumo
3) Close > Kumo
4) Chikou > Kumo (-n periods)
5) ADX > Custom value
6) DI+ > DI-
7) MACD > Signal
8) SMA > 200
Short conditions are simply the other way around. This indicator has been mainly tested and tuned for BTCUSDT.

ANTS BEAST MODE TRIX+MACD TRIX CROSSThis indicator is both the TRIX + MACD all in one inidicator -- a + sign is displayed whenever the trix crosses
ApopheniaPays Crossing detector & 2-field date/time entryYou specify a horizontal line by value, start date/time, and end date/time, and choose a data source (bar close is the default) and it will label count how many times that source crosses that line between those dates/times.
Enter the start and end dates for your horizontal line as MMDDYY and HHMM (24 hour time).
: Jan 17, 2020 would be 11720 (properly it would be 011720, but Pine inputs delete leading 0s).
: November 17, 2020 would be 110720.
: 8:30 AM would be 0830.
: 8:30 PM would be 2030.
Remember to enter the right time zone.
I believe nobody else has published a 2-input date/time picker on TV, at least the last time I checked they hadn't, they all make you input M,D,Y,H,M as separate fields. Ugh!
If you use any parts of this code, please credit me. If somehow you happen to make a lot of money using this code, please think about what a fair share would be to pay me for my help, then give that amount to a worthwhile charity.

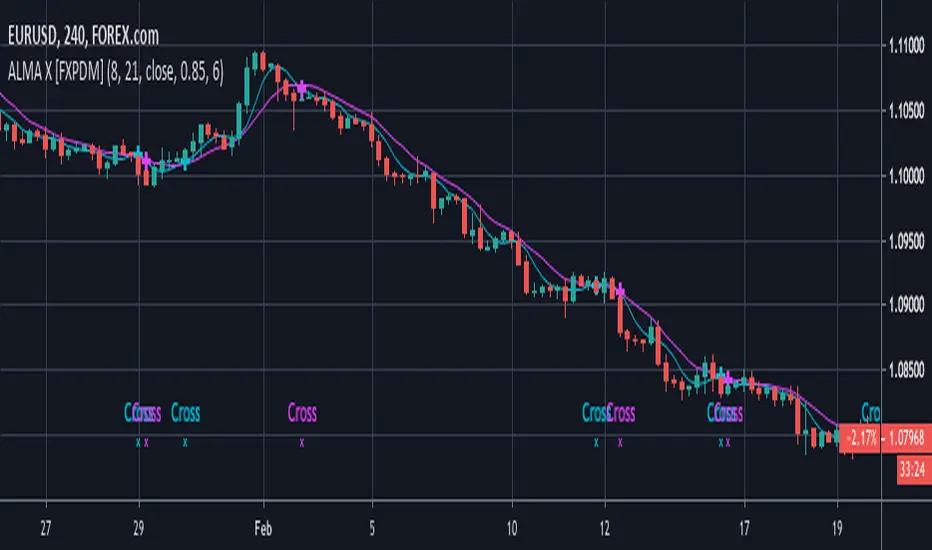
ALMA Crossover [FXPDM]
I created this new version of EMA crossing by replacing it with ALMA, Please take into consideration that the cross signal may occur during the candle. I advise waiting until the candle is close.
I used EMA crossing signals to adapt this code and turn it into an ( Arnaud Legoux Moving Average) ALMA Cross.
I expect it to bring a better signal that an EMA cross, let me know your comments and use under your own risk. this is just an experimental idea.
Long: Get into a long trade when the short moving average crosses up the long moving average.
Short: Get into a short trade when the short moving average crosses down the long moving average.
I recommend using it alongside a volume indicator to avoid sideways trends.
Exit at your own convenience or when the trend direction changes. I recommend using it in 4H and 1D charts.
Double TRIX CrossoverTRIX is a great indicator to use on zero cross setups.... know what's even better? TRIX CROSS setups!!!
Faster in-and-out on trends, safer entry and exit signals in chop or consolidation. Base setup is 6 & 8 TRIX for longer time frames such as 4hr or 8hr; ideal or FX, Crypto, or volatile instruments. I haven't experimented with using this on lower time charts and adjusting the trix settings; if you do, drop a comment.
7EMA_5MA (G/D + Bias + 12/26 Signal)This script alow you to survey multiple crossing signals as Golden/Death cross (MA50/200), Institutional Bias (EMA9/18), or EMA 12/26 crossing. You can show/hide all EMAs/MAs and show/hide all signals. Default config displays EMA 50/100/200 and MA 20. Full script includes display of EMA 9/18/12/26/50/100/200 and MA 20/21/50/100/200.

On Balance Volume with CrossOBV indicator with a few key changes that can turn it into a filter or trading indicator as-is.
Volume calculation given a look-back to help clarify trends without smoothing lag
Change the source (HLC3 indicates a little faster in backtesting)
Smooth the signal if desired
Moving average (MA) added for crossover indication in trend change
MA can be either EMA or HMA**
** My personal use:
EMA for trend filtering trades: Trade long signals if OBV is above the MA, trade short signals if OBV is below the MA.
HMA for scalping and chop: Normally set the HMA to 20 or 15 and trade the crosses. Works on most time frames and generates a lot of noise. 5 min and 15 min seems best for me in day trading
Example of trend trading using only the OBV-C and no other indicators, stops, or trailing stops:
This could obviously be improved using stops, trailing stops, or other indicators to filter when to enter & exit trades or mitigate loss.
Example of trading using the HMA and lower time frames with Elder's Force Index (EFI) used as a filter. Trade with both cross at or very near the same time. Winning trades in green:

EMA Cross <Johnson Lim>EMA Cross basically is for someone who just need to spot as a guideline whether there are 'opportunity' to buy in or out. I had been using this for few years and it always helps for me at the stage of screening typically on Crypto space.

Parametric Corrective Linear Moving AveragesImpulse responses can fully describe their associated systems, for example a linearly weighted moving average (WMA) has a linearly decaying impulse response, therefore we can deduce that lag is reduced since recent values are the ones with the most weights, the Blackman moving average (or Blackman filter) has a bell shaped impulse response, that is mid term values are the ones with the most weights, we can deduce that such moving average is pretty smooth, the least squares moving average has negative weights, we can therefore deduce that it aim to heavily reduce lag, and so on. We could even estimate the lag of a moving average by looking at its impulse response (calculating the lag of a moving average is the aim of my next article with Pinescripters) .
Today a new moving average is presented, such moving average use a parametric rectified linear unit function as weighting function, we will see that such moving average can be used as a low lag moving average as well as a signal moving average, thus creating a moving average crossover system. Finally we will estimate the LSMA using the proposed moving average.
Correctivity And The Parametric Rectified Linear Unit Function
Lot of terms are used, each representing one thing, lets start with the easiest one,"corrective". In some of my posts i may have used the term "underweighting", which refer to the process of attributing negative weights to the input of a moving average, a corrective moving average is simply a moving average underweighting oldest values of the input, simply put most of the low lag moving averages you'll find are corrective. This term was used by Aistis Raudys in its paper "Optimal Negative Weight Moving Average for Stock Price Series Smoothing" and i felt like it was a more elegant term to use instead of "low-lag".
Now we will describe the parametric rectified linear unit function (PReLU), this function is the one used as weighting function and is not that complex. This function has two inputs, alpha , and x , in short if x is greater than 0, x remain unchanged, however if x is lower than 0, then the function output is alpha × x , if alpha is equal to 1 then the function is equivalent to an identity function, if alpha is equal to 0 then the function is equivalent to a rectified unit function.
PReLU is mostly used in neural network design as an activation function, i wont explain to you how neural networks works but remember that neural networks aim to mimic the neural networks in the brain, and the activation function mimic the process of neuron firing. Its a super interesting topic because activation functions regroup many functions that can be used for technical indicators, one example being the inverse fisher RSI who make use of the hyperbolic tangent function.
Finally the term parametric used here refer to the ability of the user to change the aspect of the weighting function thanks to certain settings, thinking about it, it isn't a common things for moving averages indicators to let the user modify the characteristics of the weighting function, an exception being the Arnaud Legoux moving average (ALMA) which weighting function is a gaussian function, the user can control the peak and width of the function.
The Indicator
The indicator has two moving averages displayed on the chart, a trigger moving average (in blue) and a signal moving average (in red), their crosses can generate signals. The length parameter control the filter length, with higher values of length filtering longer term price fluctuations.
The percentage of negative weights parameter aim to determine the percentage of negative weights in the weighting function, note that the signal moving average won't use the same amount and will use instead : 100 - Percentage , this allow to reverse the weighting function thus creating a more lagging output for signal. Note that this parameter is caped at 50, this is because values higher than 50 would make the trigger moving average become the signal moving average, in short it inverse the role of the moving averages, that is a percentage of 25 would be the same than 75.
In red the moving average using 25% of negative weights, in blue the same moving average using 14% percent of negative weights. In theory, more negative weights = less lag = more overshoots.
Here the trigger MA in blue has 0% of negative weights, the trigger MA in green has however 35% of negative weights, the difference in lag can be clearly seen. In the case where there is 0% of negative weights the trigger become a simple WMA while the signal one become a moving average with linearly increasing weights.
The corrective factor is the same as alpha in PReLU, and determine the steepness of the negative weights line, this parameter is constrained in a range of (0,1), lower values will create a less steep negative weights line, this parameter is extremely useful when we want to reduce overshoots, an example :
here the corrective factor is equal to 1 (so the weighting function is an identity function) and we use 45% of negative weights, this create lot of overshoots, however a corrective factor of 0.5 reduce them drastically :
Center Of Linearity
The impulse response of the signal moving average is inverse to the impulse response of the trigger moving average, if we where to show them together we would see that they would crosses at a point, denoted center of linearity, therefore the crosses of each moving averages correspond to the cross of the center of linearity oscillator and 0 of same period.
This is also true with the center of gravity oscillator, linear covariance oscillator and linear correlation oscillator. Of course the center of linearity oscillator is way more efficient than the proposed indicator, and if a moving average crossover system is required, then the wma/sma pair is equivalent and way more efficient, who would know that i would propose something with more efficient alternatives ? xD
Estimating A Least Squares Moving Average
I guess...yeah...but its not my fault you know !!! Its a linear weighting function ! What can i do about it ?
The least squares moving average is corrective, its weighting function is linearly decreasing and posses negative weights with an amount of negative weights inferior to 50%, now we only need to find the exact percentage amount of negative weights. How to do it ? Well its not complicated if we recall the estimation with the WMA/SMA combination.
So, an LSMA of period p is equal to : 3WMA(p) - 2SMA(p) , each coefficient of the combination can give us this percentage, that is 2/3*100 = 33.333 , so there are 33.33% percent of negative weights in the weighting function of the least squares moving average.
In blue the trigger moving average with percentage of negative values et to 33.33, and in green the lsma of both period 50.
Conclusion
Altho inefficient, the proposed moving averages remain extremely interesting. They make use of the PReLU function as weighting function and allow the user to have a more accurate control over the characteristics of the moving averages output such as lag and overshoot amount, such parameters could even be made adaptive.
We have also seen how to estimate the least squares moving average, we have seen that the lsma posses 33.333...% of negative weights in its weighting function, another useful information.
The lsma is always behind me, not letting me focus on cryptobot super profit indicators using massive amount of labels, its like each time i make an indicator, the lsma come back, like a jealous creature, she want the center of attention, but you know well that the proposed indicator is inefficient ! Inefficient elegance (effect of the meds) .
Thanks for reading !
unRekt - KISS CrossKISS Cross is a moving average crossover and is part of the ''keeping it simple' series that have a similar color scheme. With this indicator you can select the moving average you'd like to use either SMA, EMA, WMA, or VWMA. Each moving average can be turned on or off and input changed. The first two MA's will change color on the cross from green to red depending on cross up or a cross down.

SMA Cross Entry & Exit StrategyThis is a TradingView Strategy Script meaning you can't execute real trades using your exchange API connected to your TradingView account, it is designed for backtesting only
This is a basic backtesting script for charting the bullish and bearish cross of two user defined simple moving averages, select the cog next to the name of the script ON the price chart in the left hand corner. The script will print to the screen either "Long Entry" or "Short Entry" depending on the direction of the cross. The script using TradingView strategies will subsequently close the opposite of the position that is executed when the bullish or bearish cross occurs. Simply put, if you are short and a bullish cross occurs, your short trade will close and be logged in strategies and the long will fire. You can pyramid the long and short positions to continue entering as long as the trend doesn't flip. You will find this in the script settings. Since this script is for backtesting you can manually set the "backtesting range" for TradingView Strategies and firing the "Long Entry" and "Short Entry". This as well, is in the settings.
Notice: When the SMA cross occurs, you have to wait till the next candle before TradingView Strategy will print the "Long Entry" or "Short Entry" to the screen
TradingView - How To Use Strategies: www.tradingview.com

BUY and SELL - Backtest single EMA cross By che_traderHi, I hope you're well!
At the request of my friend @jansrbtc I'm going to publish a simple emas crossing strategy.
We will do long or short at the cross of the two ema.
Good strategy for when an asset is in trend.
Warm: In choppy periods this indicator can be very affected by large drawdowns.
Enjoy!

LIVIDITIUM [BTC] {PREMIUM}The LIVIDITIUM is a set of indicators centered around a series of parallel bands call the LVDT guide bands, defined by lines call the LVDT levels. Major LVDT levels have thicker line-widths.
LVDT levels are constructed from a mathematical conjugation of the complex golden ratio solutions.
>> Useful to determine critical levels, indicates possible support levels, as well as major and minor tops/bottoms.
Look at historical interactions to work out key levels for any particular chart, and adjust the displacement offset value to get the LVDT levels to conform better to a particular chart at a particular time-frame.
Major BUY/SELL indicators for top/bottom levels were added specifically for BTCUSD and optimised for the 1D chart (disabled at lower time-frames). These are based on the interaction of the candlestick with various emas and smas as well as with the LVDT levels.
A scoring algorithm also analyses the significance of major and minor death crosses, base on the presence of other indicators in its vicinity to suggest potential local buy/sell prices, and should still work relatively well at lower time-frames.
Various triggers are also implemented, including golden/death cross indicators, as well as pivot and potential reversal points -- labelled with either text-markers, or colored vertical bands.
Signal markers that are only valid for the BTCUSD chart are automatically disabled when LIVIDITIUM is being used on other charts.
~ * ~ * ~ * ~ * ~ * ~ * ~ * ~ * ~ * ~ * ~ * ~ * ~ * ~ * ~ * ~ * ~ * ~ * ~ * ~ * ~
Note:
In no way is this intended as a financial/investment/trading advice. You are responsible for your own investment/trade decisions.
Please exercise your own judgement for your own trades base on your own risk-aversion level and goals as an investor or a trader. The use of OTHER indicators and analysis in conjunction (tailored to your own style of investing/trading) will help improve confidence of your analysis, for you to determine your own trade decisions.
Please PM me for access information.

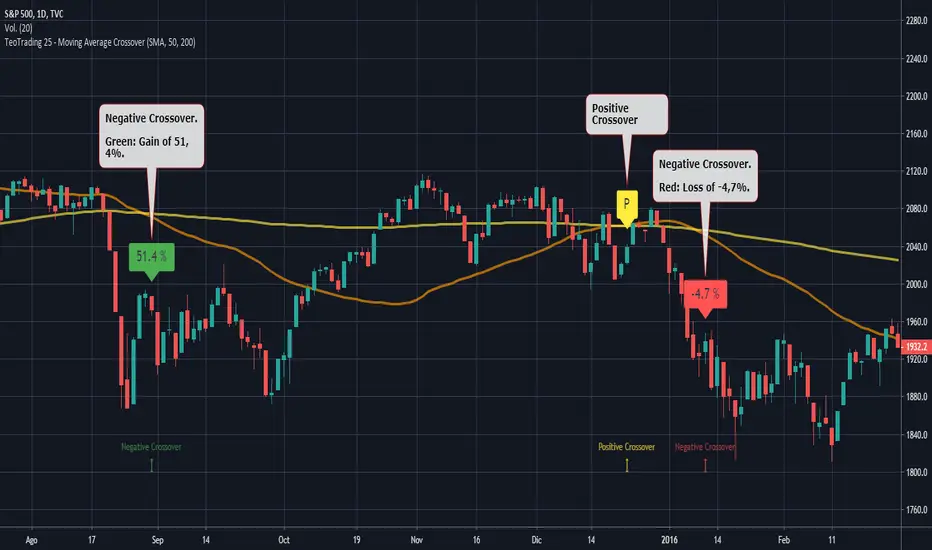
TeoTrading 25 - Moving Average CrossoverThis Script prints different types of moving Average: SMA, EMA, WMA and VWMA.
It is usefull to view in only few minutes differents crossovers.
The crossver´s are indicated with:
Yellow "P": Positive Crossover
Green: Negative Crossover with gain.
Red: Negative Crossover with Loss.
The Percents of gain and loss are indicated in the Negative Crossovers.
Input Parameters:
Type_: Type of Moving Average.
PrintPrice: Enable open value print.
Fast: Fast Moving Average.
Slow: Slow Moving Average.
This indicator does not generate recommendations to buy or to sell. It was designed for educational purposes.
MAC-Z & MACD Leader signal [ChuckBanger]This is a combination of my MACD Leader script and MAC-Z with option to add Laguerre filter. The advantage of the MAC-Z over MACD is that it is a more accurate and “assumption-free” indicator that can more accurately describe how a market actually perform. But you can use this as a regular MACD indicator.
Crossovers signals
The MAC-Z line and signal line can be utilized in the same way as a stochastic oscillator, with the crossover between the two lines providing buy and sell signals. As with most crossover strategies, a buy signal comes when the shorter-term, more reactive line – in this case the MAC-Z line (blue line) crosses above the slower signal line (orange line). For example, when the MAC-Z line crosses below the signal line it provides a bearish sell signal.
Zero line crossing
The zero cross strategy is based on either of the lines crossing the zero line. If the MAC-Z crosses the zero line from below, it is a signal for a possible new uptrend, while the MAC-Z crossing from above is a signal that a new downtrend may be starting. This is special powerful if the lines has a fast up or down movement but the price action doesn't reflect that movement.
Divergences
Bearish and bullish divergences is my favorite signals. When price action and oscillators follow the same path it is called Convergences, when they don’t, it’s called a Divergence. Don't confuse the two because they have not the same meaning. But be aware that for example during consolidation or low liquidity, some small divergences between price and indicators might form, but that doesn't mean we should consider them as real divergences.
There is many different types of divergences. It is easier to show a picture then explaining it so I recommend you to check out the link below. Especially the top image. It sums this up very well
medium.com
MACD Leader
The MACD leader is only showing the crossing of MACD as a vertical line
Green vertical line = MACD Leader Bullish Cross
Red vertical line = MACD Leader Bearish Cross
MACD Leader:
MAC-Z:
More Information
cssanalytics.wordpress.com
en.wikipedia.org
drive.google.com
