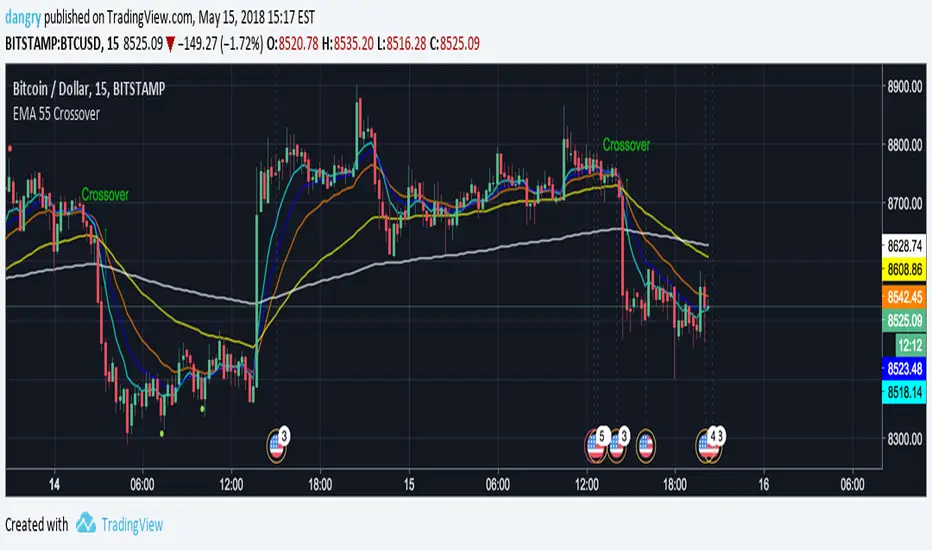
Crossover

drnk_2emaChoose 2 period for daily ema and 2 period for hourly ema
from 1 minute to 1 hour time frames you will see same hourly EMAs
from 1 minute to 1 day time frames you will see same daily EMAs

SMA EMA HMA VWMA Crossover Strategy with MA Turning Point ExitsThis version adds HMA and VWMA, allowing you to backtest different crossover strategies for any combination, with the exits on the turning point of the faster MA. Due to order limitations this will only work on higher timeframes for some combinations, or on more recent exchanges with less history. You can edit the code though to add the timestamp to a recent date.

EMA Cross - Indicator OnlySimple Indicator for Automated Trading Based on EMA Cross.
Displays the BUY/SELL.
Best used with the ALERTS Script.
PM for use.

EMA Cross Alerts /w Take Profit and StoplossSimple Alert for Automated Trading Based on EMA Cross.
Also includes the ability to add Take Profit, Stoploss, and Trailing.
PM for use.


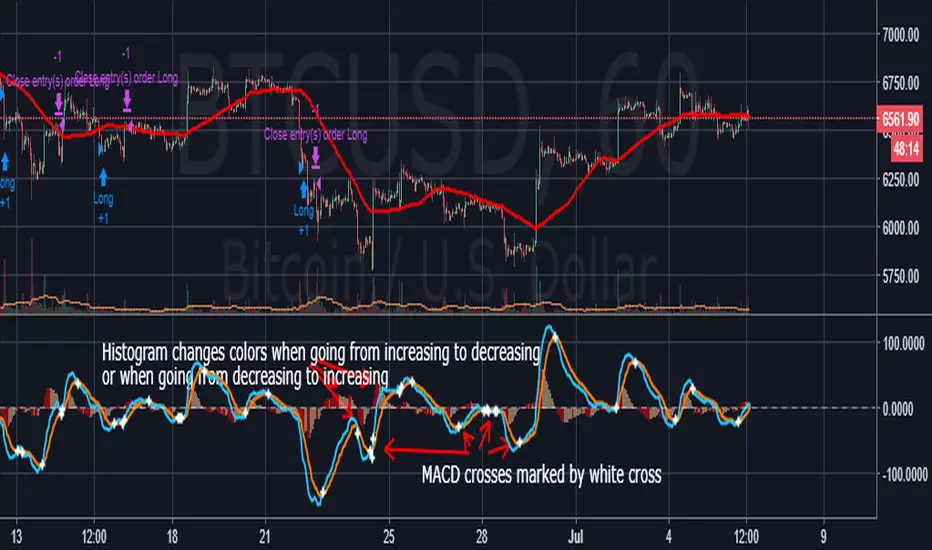
Better MACD with clearer cross and histogram signalsSimple but much needed visual improvements to the default MACD script. First, every time the MACD and signal cross, a white cross is placed on he chart, which lets you quickly identify the crosses. Second, whenever the histogram goes from increasing to decreasing or from increasing to decreasing, a color change occurs. Colors can be customized under "Style" tab under settings.
Reap Hull SMA CrossoverHi this is my first script, it is a HMA 144 crossover with SMA 5 changes background (still needs work), provides alerts for crossover

Moving Average Cross Strategy Simply define your fast and slow M then backtest the strategy.
*First script, work in progress. Will allow you to combine two TV indicators into one.


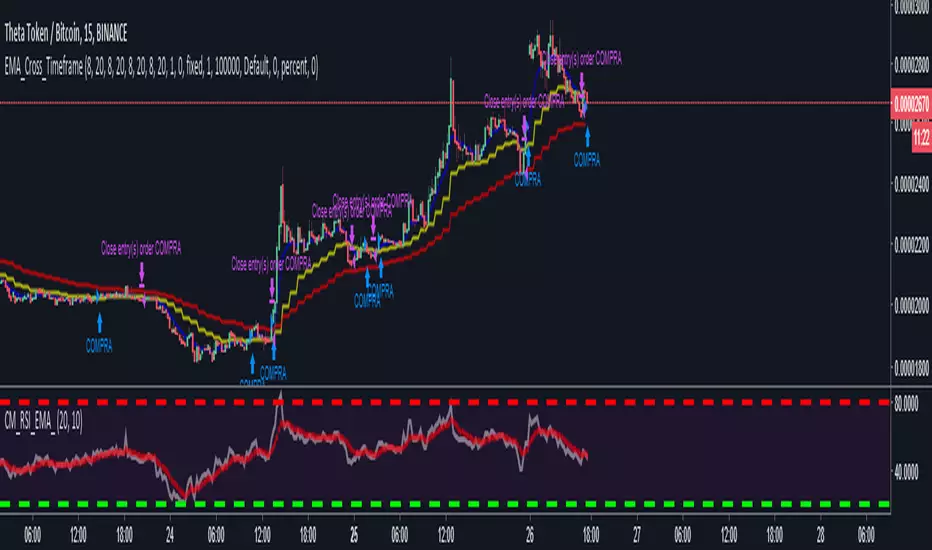
EMA_Cross_TimeframeIndicator made to show the EMAs in different timeframes.
indicator gives buys signal when the EMA of the current chart (emaA1) crosses the EMA of the 1H chart (emaH1). And it gives the signal of sale when the EMA of the current chart (emaA1), crosses down the EMA of the 1H chart (emaH1) and the closing is below the emaH1.
NOTE 1: In the tests that I have done, it has given great signs of purchase, but with the sales signals, I still have to find the best result.
NOTE 2: Do not blindly use any indicators, analyze them, and use the indicator to help confirm your inputs and outputs.
I am open to suggestions for improvements.
Vegas Wave - BronzeThe bronze edition of my code will be the most basic of a series of Vegas Wave codes which I will publish.
EMA 144, 169, 233
Vegas Tunnel - Highlights the price band between the 144 and 169 EMA.
Identifies support and resistance areas
Target price bounces and aid identifying EW counts.
Wave 2 retrace through the waves. Wave 4 bounce off Vegas Tunnel for example.
Provides confluence when used with fib targets and other indicators.
Identify EMA cross-overs and price crosses.
Easy to customise colours and shading for all time periods.
Multiple indicators in one (for those with TV limits).
Silver/Gold versions
I will include highlights/alerts for EMA/Price crossovers.
I hope its helpful and hopefully the first of many scripts to come.
Feel free to leave ideas and tips for future versions.

10 indicators in 1 : MACD RSI PIVOT EMA-CROSS and 7 EMA/SMA10 indicators in 1
MACD
RSI
PIVOT weekly:best
200 sma
100 sma
75 ema
55 ema
50 sma
20 ema
Golden EMA Crossover 13/48 based on tests Results of 1750 Moving Average Crossovers
Alert included, You can find "Bullish signal" and "Bearish signal" When you add Alert

Efmus System : 10 indicators in 1
10 indicators in 1
MACD
RSI
PIVOT weekly:best
200 sma
100 sma
75 ema
55 ema
50 sma
20 ema
Golden EMA Crossover 13/48 based on tests Results of 1750 Moving Average Crossovers :
etfhq.com
Efmus System : 10 indicators in 1
10 indicators in 1
MACD
RSI
PIVOT weekly:best
200 sma
100 sma
75 ema
55 ema
50 sma
20 ema
Golden EMA Crossover 13/48 based on tests Results of 1750 Moving Average Crossovers :
etfhq.com

EMA 55 CrossoverBasically what this does is to flag when EMA 55 crosses over EMA 8, 13, 21, and 200. This strategy was described by @Philakone on this tweet , but I'm not really sure if this is the correct strategy he described.
Simple Fibonacci EMA StrategyThis script gives a buy signal when the 21 EMA crosses above the 55 EMA and a sell signal when the 55 EMA crosses below the 21 EMA. This strategy works well for cryptocurrencies at all time frames. However, it does not work for stocks or forex. Sometimes, the simple strategies are the best strategies, especially in markets that have not been dominated by institutions.
When editing how much of your balance to trade, attach at least one decimal place. For instance, 12.0, 90.0, and 83.3 would work, but 100, 32, or 70 does not work.

Trend Continuation FactorTrend Continuation Factor indicator script.
This indicator was originally developed by M.H. Pee (Stocks & Commodities V. 20:3 (58-64): Trend Continuation Factor).

Frosted 12 EMAsBased on Vykorowsky's 6 EMAs.
This indicator creates 2 separate fans of 6 EMAs each (12 in total).
Everything is configurable in the settings screen.