Bitcoin Futures SentimentMonitors the sentiment across Bitcoin Futures, large discrepancies indicate potential low risk (buy/green) and high risk (sell/red) zones.
加密貨幣

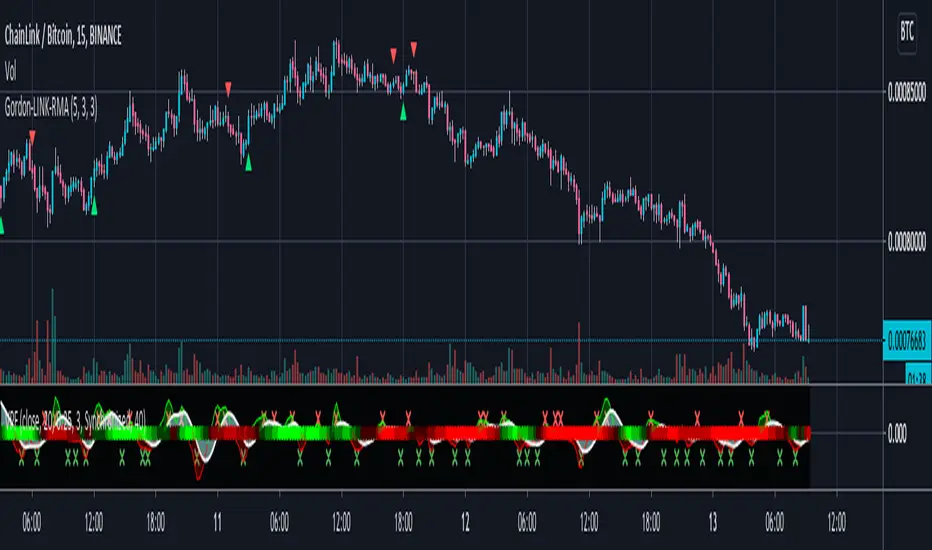
Gordon-LINK-RMA - LINK/BTC - Trend Indicator (Swing)Configured specifically for LINK/BTC Markets on Binance. Plots changes in low timeframe trend based off Multiple timeframe RMA values.
Buy = Green Triangle
Sell = Red Triangle
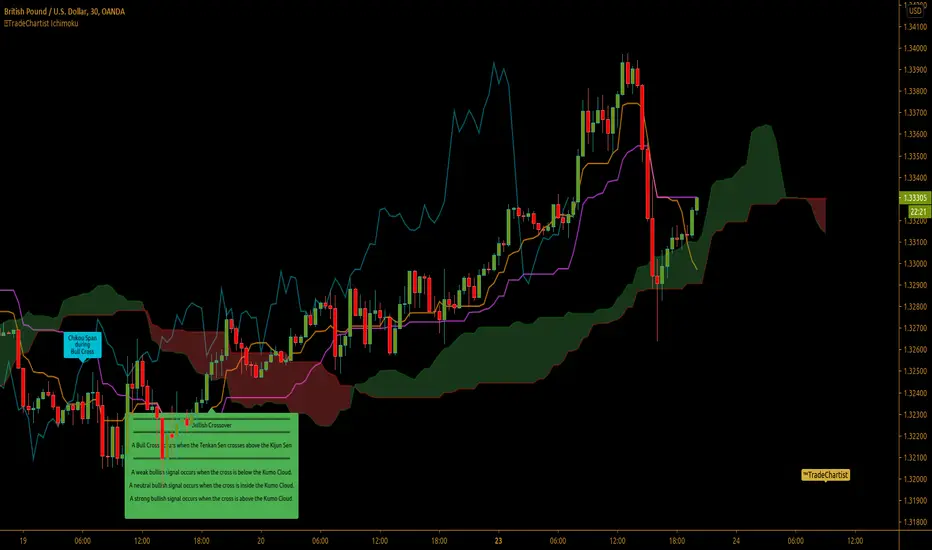
™TradeChartist - Show and Tell - Ichimoku Cloud™TradeChartist Show and Tell - Ichimoku Cloud is a free and easy to use script that helps anyone learn and understand the Ichimoku cloud by using the 'Show and Tell' option from the indicator settings and by choosing the Ichimoku component/Signal from the dropdown box. For individuals new to Ichimoku Cloud , Show and Tell option will help explain the components and signals of Ichimoku Cloud on the chart without having to navigate away from price action, thus making it easier to learn and understand Ichimoku cloud with respect to chart price action on the corresponding time frame.
The indicator automatically detects cryptocurrencies as it uses different settings specific to cryptocurrencies market - (20,60,120,30) respectively as opposed to classic - (9,26,52,26).
When 'Show and Tell' is unchecked from indicator settings, the script detects signals and important Ichimoku events like Bull/Bear crosses, Bullish/Bearish Kumo Twists, Bullish/Bearish Kumo Breakouts etc and plots labels on chart. To turn off this feature, just uncheck 'Labels' from the styles tab under the indicator settings.
This is a free to use indicator. Give a thumbs up or leave a comment if you like the script.
On Balance Volume with CrossOBV indicator with a few key changes that can turn it into a filter or trading indicator as-is.
Volume calculation given a look-back to help clarify trends without smoothing lag
Change the source (HLC3 indicates a little faster in backtesting)
Smooth the signal if desired
Moving average (MA) added for crossover indication in trend change
MA can be either EMA or HMA**
** My personal use:
EMA for trend filtering trades: Trade long signals if OBV is above the MA, trade short signals if OBV is below the MA.
HMA for scalping and chop: Normally set the HMA to 20 or 15 and trade the crosses. Works on most time frames and generates a lot of noise. 5 min and 15 min seems best for me in day trading
Example of trend trading using only the OBV-C and no other indicators, stops, or trailing stops:
This could obviously be improved using stops, trailing stops, or other indicators to filter when to enter & exit trades or mitigate loss.
Example of trading using the HMA and lower time frames with Elder's Force Index (EFI) used as a filter. Trade with both cross at or very near the same time. Winning trades in green:

BEST ABCD Pattern StrategyHello traders
This is the strategy version of this script
I - Concept
I present to you, ladies and gentlemen, the first screener for harmonic patterns.
Starting with an ACBD pattern screener this time!!
I used the calculations from Ricardo Santo's script
In short, he's using fractals (regular or Bill Williams ) for the pattern calculations. A masterpiece !!!
II - Definitions
The ABCD pattern ( AB=CD ) is one of the classic chart patterns which is repeated over and over again.
The ABCD pattern shows perfect harmony between price and time.
The Williams Fractal is an indicator, developed by Bill Williams, that aims to detect reversal points (highs and lows) and marks them with arrows.
Up fractals and down fractals have specific shapes. The Williams Fractal indicator helps users determine in which direction price will develop
💎Strategy filters💎
I included some cool backtest filters:
- flexible take profit in USD value (plotted in blue)
- flexible stop loss in USD value (plotted in red)
The take profit and stop loss should work with Forex/FX pairs as well
All the BEST
Dave

Pivot Boss 4 EMA + BB + Parabolic SAR + IchimokuA combination of a few of my favorite indicators.
1) Pivot Boss 4 EMA
2) Bollinger Bands
3) Parabolic SAR
4) Ichimoku Cloud
All credit to original authors.

MACD & Mayer multpile Crypto-EmbassyThis is a combination of two indicators MACD & The Mayer Multiple.
MACD = Short for moving average convergence/divergence. It is designed to reveal changes in the strength, direction, momentum, and duration of a trend in a stock's price.
You will find the normal histogram and also a generated trend line (green = bullish , red = bearish )
The Mayer Multiple = The Mayer Multiple was created by Trace Mayer as a way to analyse the price of Bitcoin in a historical context. The Mayer Multiple is the multiple of the current price over the 200-days moving average.
"It does NOT tell whether to buy, sell or hold" but it gives you a pretty good idea of where we are at.
Basically
🔵Blue = Please buy🙏
🟢Light green = Looking for good entries 👀
🟢Green = Buy if you wish
🟡Yellow = This is starting to take off
🟠Orange = Looking for good exit 👀
🔴Red = You should get out of this
🔴Dark Red = You have balls, now please sell🙏

Best Volatility Calculator (Multi Instruments)Hello traders
A bit of context
Definition: Volatility is defined as the close of current candle - close of the previous N candle
This is an alternative version of my Best Volatility Calculator
The other version is displayed on a panel below. This one overlays on the chart using the "overlay=true" setting
This indicator shows the average volatility, of last N Periods, for the selected time frames and for 2 selected instruments.
You can select up to 2 timeframes with this version
Presented as Currency, Pip, percentage labels in a panel below.
Will calculate in real-time only for the current instrument on the chart.
The indicator is coded to not be repainting
Example
In the indicator screenshot, I used a lookback period of 1.
That compares the current candle close versus the previous one for the daily and weekly timeframe
Showing how the results look like using FOREX instruments (where using the PIPS labels make more sense than with cryptocurrency assets)
Best regards
Dave

Cryptohopper ATRThe Cryptohopper ATR analyses the volatility of the asset. When the market is rather ranging, the volatility remains low and the ATR line decreases . However, when the market starts moving quickly in one direction, doesn’t matter if it’s up or down, the ATR will start rising.
It can be a very good indicator to spot when the big investors are entering the market to buy or sell.
We have added a moving average of the ATR line to generate signals. In this way, when volume starts flooding the market and the volatility peaks, the ATR line will rise above its moving average. Likewise, when the volatility falls and the market ranges, the ATR line will fall below its moving average.
Last but not least , unlike with other indicators, the ATR does not generate buy or sell signals since it measures the volatility of the market. Therefore, the price can be going up or down.
Then, how can you use this indicator in your automated strategy? It can be described as a volatility filter . When the ATR line goes above the moving average, the market is more volatile and the price is moving, then the ATR will let another indicator(s) to give a buy or sell signal. However, when the volatility is low and the price is ranging, the ATR is below its moving average, and it won’t let another indicator(s) to give any buy or signal.
Therefore, it filters out trades when the market volatility is low and the price doesn’t move much and let your strategy trade when the market is volatile and the price is trending.
--
As you can see in the chart, when the ATR line (orange line) is below the blue line, the price is not volatile and it is likely to be ranging. On the other hand, when the ATR line is above the blue one, the volatility of the market is increasing, which means that the price is initiating a new trade and there will be more trading opportunities.

Trade System Crypto InvestidorTrade System created to facilitate the visualization of crossing and extensions of the movements with Bollinger bands.
Composed by:
Moving Averages of 21, 50, 100 and 200.
Exponential Moving Averages: 17,34,72,144, 200 and 610.
Bollinger bands with standard deviation 2 and 3.
How it works?
The indicators work together, however there are some important cross-averages that need to be identified.
- Crossing the MA21 with 50, 100 and 200 up or down will dictate an up or down trend.
- MA200 and EMA200 are excellent indicators of resistance and support zone, if the price is above these averages it will be a great support, if the price is below these averages it will indicate strong resistance.
- Another important crossover refers to exponential moving averages of 17 to 72 indicates a possible start of a trend
- The crossing of the exponential moving average of 34 with 144 will confirm the crossing mentioned above.
- In addition, the exponential moving average of 610 used by Bo Williams is an excellent reference for dictating an upward or downward trend, if the price is above it it will possibly confirm an upward trend and the downside.
- To conclude we have bollinger bands with standard deviation 2 and 3, they help to identify the maximum movements.

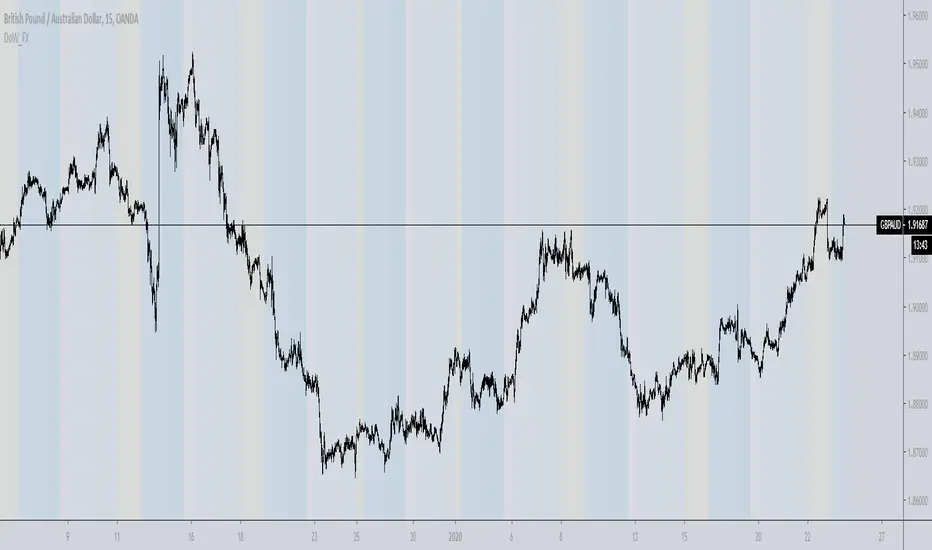
Day of week, Forex FixCalendar to work on instruments that trade a 24 hour day like crypto and forex, also does not display if you are above an intraday time. Main tweak was to end the trading day at 0000 (midnight) instead of 1700 (5pm) NYC time.
This update is geared towards Forex traders, which is why I chose to highlight Wednesday in yellow since that is commonly thought of as a midweek reversal point.
@airscape built a good calendar indicator based on the work of @ChrisMoody, this is really an update to their work and directed towards FX and Crypto
airscape:
ChrisMoody:
Future development:
Toggle for light and dark themes
Adjustment/offset for DLST and local vs/ server time
Additional color bands to denote Asian/London/NYC sessions?
Text label for days instead of color option?
Clean up the code and simplify
Intraday S/RPlots yesterday's low and high, and the current day's open, as intraday support/resistance levels.

Auto-fibsAutomatically plots Fibonacci Retracement levels.
Uses the all time high (ATH) for a specified number of days back, and the lowest value since the ATH, to plot the levels.

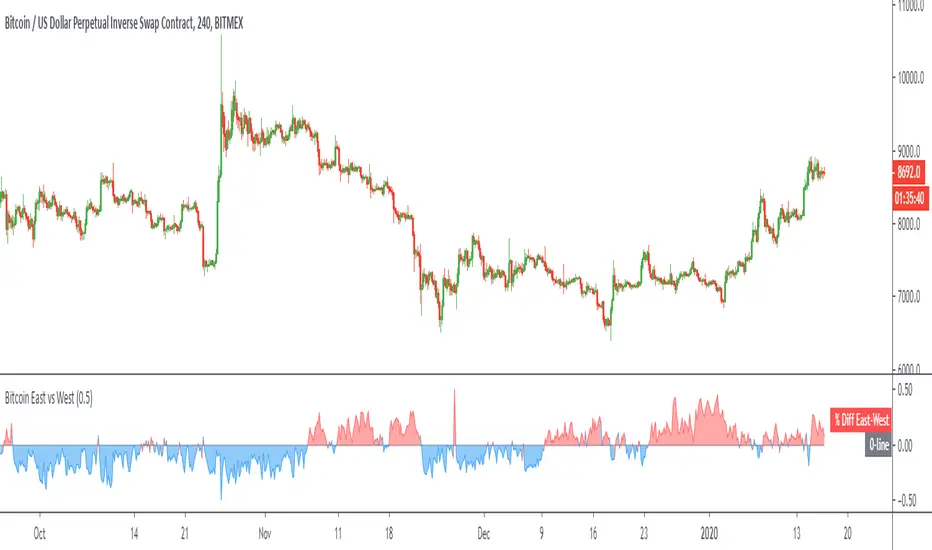
Bitcoin East vs WestPlots the volume weighted price difference between the top spot exchanges in the "East" (Asian markets) versus the "West" (US/UK/EU markets).
Optional: view the volume difference between the two.
BEST Supertrend CCIHello traders
Today I present you a Supertrend not based on candle close but based on a CCI (Commodity Channel Index)
How does it work?
Bull event: CCI crossing over the 0 line
Bear event: CCI crossing below the 0 line
When the event is triggered, the script will plot the Supertrend as follow
UP Trend = High + ATR * Factor
DOWN Trend = Low - ATR * Factor
This is an alternative of the classical Supertrend based on candle close being above/beyond the previous Supertrend level.
Hope you'll enjoy it and it will improve your trading making you a better trader
Dave

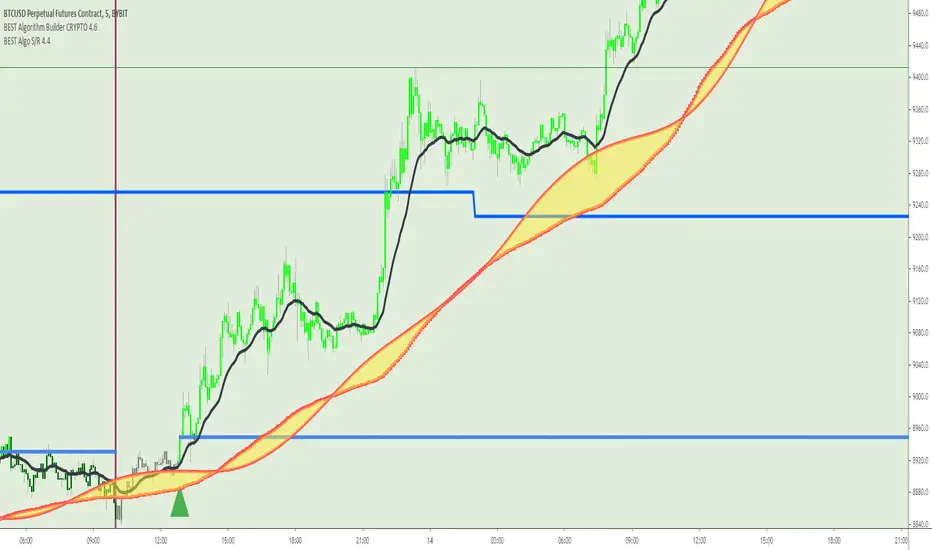
BEST Algorithm Builder CRYPTOHello traders 👋
I. 💎 SCRIPTS ACCESS AND TRIALS 💎
1. Every trial request access has to be done through my website.
2. My website URL is in this script signature at the very bottom (you'll have to scroll down a bit and going past the long description) and in my profile status available here: Daveatt
3. Many video tutorials explaining clearly how all our indicators work are available on your website > guides section and on our Discord forum.
4. You can also contact me directly for more information regarding the trading method included in the indicator or how to access it
II. Forewords
Algorithm trading has THE ambitious goal to reduce the number of decisions we have to make when trading.
It's so much easier to get a signal whenever all indicators are converging rather than monitoring each one individually.
Even better when that convergence has been found by experienced quant traders - so that our subscribers only worry about managing their trades according to our trading method.
We don't only provide scripts. They're based on our trading method we've built over years across many asset classes (including cryptocurrencies)
Feel free to check us out for more information (links in my profile or signature below)
This indicator is for the Intraday CRYPTO traders looking for fixed entries based on a trading method designed by 2 experienced traders.
It's a variation of our Algorithm Builder with a custom method for intraday trading - can be coupled with the UNIVERSAL Algo Builder also for swing positions.
We designed this framework for CRYPTO/USD and CRYPTO/CRYPTO pairing (ex: LTC/BTC, XRP/ETH, ...)
Made for crypto with enough trading volume (big and mid-caps)
ETH/BTC
XRP/ETH
EOS/USD
It includes :
- our proprietary method with fixed entries
- a hard exit system (built-in stop-loss)
- 🔔 Compatible with dynamic alerts 🔔
Dynamic alerts are bringing automated trading to a whole new level. The third-party solutions capturing TradingView alerts are able to use them.
- (optional) we let the users decide to use or not our built-in Trade Manager.
Regardless of the Trade Manager is used or not, one must mandatory exit, once a vertical hard exit bar appears.
- the Algorithmic Supports and Resistances used as safeguards and take profit zones.
Final words
We made it as simple as we could (to be honest it's a very simple system for the end-user) - even with several hundreds of calculations in the indicator.
Please hit me up for any questions/feedback/comments
Become the BEST trader that you deserve to be
Dave
Bitcoin Halving CountdownHello traders,
I offer you today the BTC halving countdown updated in real-time on your charts
I inspired myself greatly from the gentleman @everget's script LTC halving countdown below
(
The countdown date is coming from that source www.bitcoinblockhalf.com.
The halving date is estimated to be around May 13th, 2020 .
That date is hardcoded in the script and is used for the countdown calculation.
The Bitcoin block mining reward halves every 210,000 blocks, the coin reward will decrease from 12.5 to 6.25 coins.
Enjoy the weekend
Dave

Voss Strategy (Filter + Trend Indicator) [Bitduke]Created strategy based on Voss Predictive Filter, implemented by TradingView user e2e4mfck.
Voss Predictive Filter
This is a relatively new filter from John F. Ehlers’ article, “A Peek Into The Future .” Ehlers describes the calculation of a new filter that could help signal cyclical turning points in markets.
But filter has a negative group delay and while an indicator based on it cannot actually see into the future, it may provide the trader with signals in advance of other indicators.
In mentioned article he tested filter on SPY and at one point in time "it went into a trend mode in January 2019, and the cycle signal failed miserably, signaling a short position during the runup. <...> The only way to minimize the impact of this condition is to employ an additional trend detector."
Thus I've added another Ehlers' based trend based indicator Instantaneous Trendline (thanks to LazyBear for implementation) to minimize the impact of the trend mode and got a good results on XBTUSD pair 4h.
Backtest :
> Range: 2016 - 2020
> XBTUSD
> 4h
> ~20% drawdown
> Sharpe (0.361, not too impressive)
I think it can be improved with Risk Management system and experimenting with various trend following indicators.

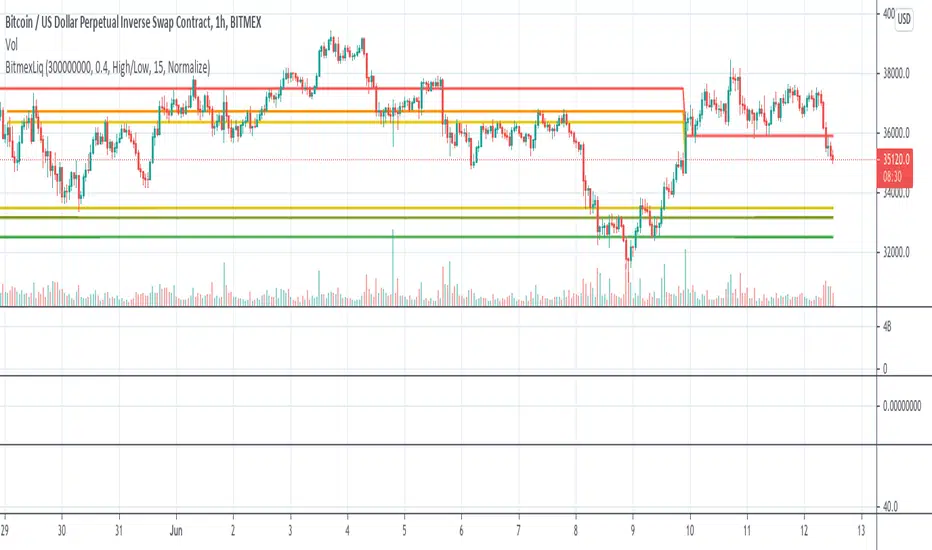
BitMEX Liquidation LevelsThis indicator plots BitMEX liquidation levels:
- 25x
- 50x
- 100x
The indicator works as following:
The underlying assumption (as with all liquidation calculations) obviously is that traders used fixed margin or go "all in" on their cross-margin account.
You then can configure a minimum trade volume and a minimum price change in percent for a candle to start computing liquidation levels from that candle
Additionally: configure the price base for the liqudation level: Candle high or low (default) works well, but you can also set "candle close" or "median high/low"
The indicator will then plot horizontal lines on the main chart showing price levels where many positions opened at the configured "start candle" will likely get liquidated.
It works for all BitMEX contracts and while it has been optimized for BitMEX, it will work on other exchanges with the same leverage levels (25x, 50x, 100x) and maintenance margin requirements too.
This indicator uses the Smart Volume indicator to compute the volume at the "start volume candle" setting where the liquidation level starts. This indicator can be found here: Smart Volume:
BEST Supertrend StrategyHello traders
Sharing a sample Supertrend strategy to illustrate how to calculate a convergence and using it in a strategy
I based the setup as follow:
- Entries on Supertrend MTF breakout + moving average cross. Entering whenever there is a convergence
- exit whenever a Simple Moving Averages cross in the opposite direction happen
- possibility to filter only Longs/Shorts or both
All the best
Dave

Market BuySell RatioA script using 1m small candle size (configurable) to compute the volume of buy (up) vs sell (down) candles (instead of actual market buy vs sell orders which are not available in pine script).
It then plots the buy vs sell ratio as an oscillator below the cart.
This gives traders an idea of current order flow in the market.
To compute the small candles this script uses the "Smart Volume" script which can be found here:

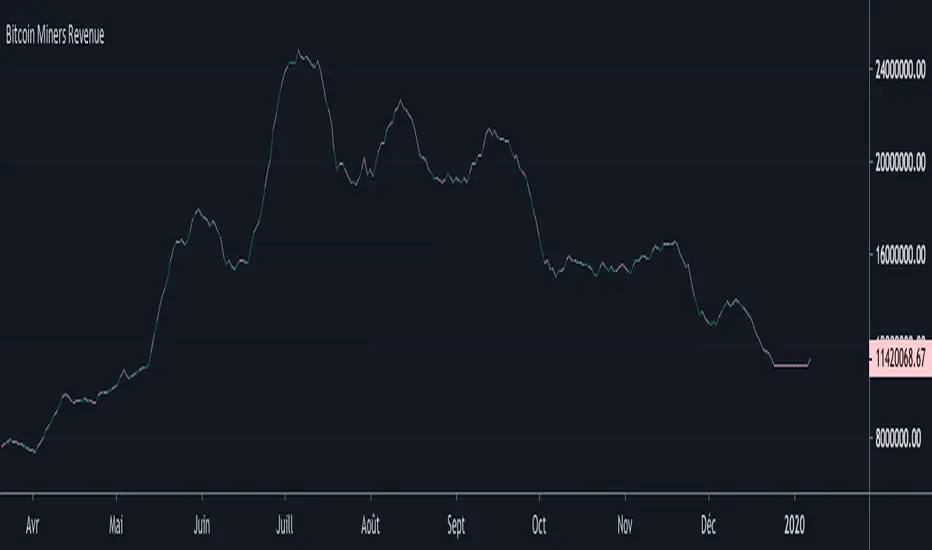
Bitcoin Miners RevenueHello everyone,
Bitcoin Miners Revenue Indicator :
Historical data showing (number of bitcoins mined per day + transaction fees) * market price.
Total value of coinbase block rewards and transaction fees paid to miner
Bitcoin Cost Per TransactionHello,
An indicator for Bitcoin, to have the cost per transaction, on a 10 days average.
