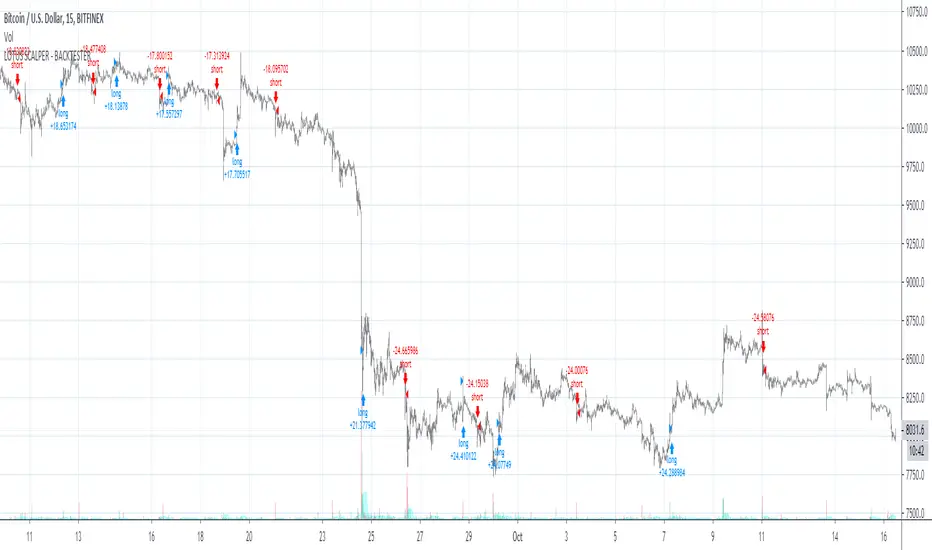
Maverick - Strategy TesterWelcome to the Maverick - Strategy Tester.
This indicator is used for back-testing. Once you have found settings that you like, you can use my other published indicator "Maverick" to set alerts.
How to use: Apply to any chart, on any time frame. You will see LONG and SHORT signals on the chart. A LONG signal represents an entry/buy in, and a SHORT signal represents an exit/sell.
You can use the Maverick - Strategy Tester to scalp on low time frames such as the 5m, 15m, 30m etc. Or use it on higher time frames such as the 1hr, 2hr, 4hr.
You can use regular candles but Heikin Ashi are recommended for better accuracy.
When using Heikin Ashi, I have included a real price line which shows the actual price of the asset/chart at the close of each candle.
You cannot set alerts with this indicator!
加密數字貨幣
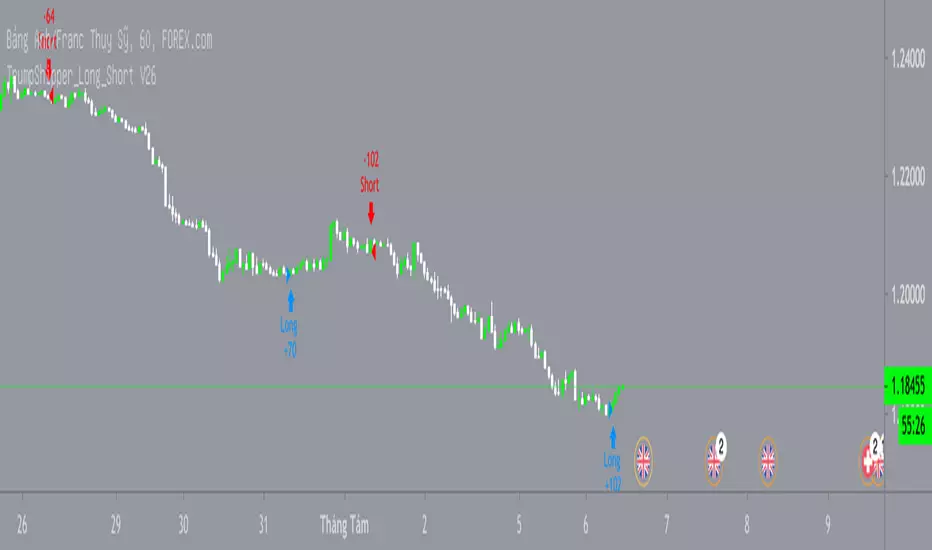
CS Buy/Sell Strategy (read the description)Get Buy/Sell signals and check their profitability in the Strategy Tester.
This script has been tested for the crypto space (Bitcoin, Ethereum, etc.) but works for other assets, as well.
I recommend to apply strategy tests on different time-frames (usually daily and 4hr work best) and go with the most profitable ones.
In the settings you have the ability to test the strategy using from - to dates to narrow down best profitable trade periods.
In order to add this strategy to your chart, click on "Add to favorite scripts" and in then, in your chart, go to Indicator and add it from your favorites.
If you have questions, please send me a message.
There is also a Long/Short focused script available with the ability to set alerts (requires an invite). If you want to add it. Just send me a message to get an invite:

Coinbase ALT/USD IndexA simple ALT/USD pair index of all the altcoins currently trading on Coinbase.

CoinStudio Signals Full (read the description)CoinStudio Signals Full displays long and short, as well as reasonable targets and allows to set custom alerts based on them.
Possible targets are flagged as "C" for the most previously occurred signal. These targets indicate chances to sell before an expected reversal.
If the signals switch from let's say Short to Long and there are no targets between them, it either means the signal failed or the target is falling together with a new signal.
CoinstudioSignals work for any asset (crypto, stocks, gold , silver , etc.) and work for every time-frame.
However, daily and 4hr usually give the best results.
To add this script, please send me a message and ask for an invite!

CS Signals Lite (read the description)CoinStudio Signals Lite displays long and short entries.
Additionally, the Full version supports custom alerts based on the signals.
To get access to the full version and alerts, please message me for an invite.
The signals work for any asset (crypto, stocks, gold , silver , etc.).
In principle, the signals work for every time-frame but depending on the asset some work better than others.
However, daily and 4hr usually give the best results.

CS Signals Full (read the description)CoinStudio Signals Full displays long and short entries and allows to set custom alerts based on them.
The signals work for any asset (crypto, stocks, gold, silver, etc.).
In principle, the signals work for every time-frame but depending on the asset some work better than others.
However, daily and 4hr usually give the best results.
To enable this script, please head to our Discord and ask for an invite:
discord.gg


Bar RatioBar Ratio is an indicator tool that provides real-time likelihood of the current bar closing up or down (green or red).
Technical status, volatility and time are key elements in this indicator.
From the open of a bar, a ratio of 50% is assumed before changes from factors are considered.
The factors that change the likelihood of a bar closing up or down and their relative weight are listed below.
Micro-Trend observed over the last 20 bars - up to 2.5%
Macro-Trend observed over the last 70 bars - up to 2.5%
Current bar price against beginning of Micro-Trend - up to 2.5%
Combination of significant change above average volatility and move against direction of Micro-Trend - up to 2.5%
Combination of significant change above average volatility and move against direction of Macro-Trend - up to 2.5%
Previous bar direction up to 10 consecutive bars - up to 3.75%
Current status of bar (higher or lower) - up to 3.75%
Significance of change against average volatility - up to 5%
Time until bar close - up to 25%
Total: 100%
If all factors are synchronised, the likelihood of the bar closing up or down can be indicated at a probability of 100%.
While the practical ability for this to be used for trading is limited, the tool can be useful for choosing when it is safe to open a trade.
Time is a key element as the likelihood of the bar remaining at current status by the close of the bar is constantly increasing.
The accuracy of this tool is incredible and should be noted as it's primary trait.
You can find and use this indicator on any time-stamp or security such as Cryptocurrency, Forex, Stocks or Indices.
The Bar Ratio can be located by searching in your public indicator library at the top of your chart and adding it to your screen.

Directional Momentum Flux StrategyDirectional Momentum Flux (DMF) is a compound indicator designed to surface signals of projected change in directional momentum. The primary goal is to identify possible momentum inflection points and signal them before they happen, which is reached by applying a set of well-known high-level indicators (e.g. DEMA, RSIs, CCIs and VWAP), lower-level indicators (e.g. BOP, PPO and RMOMO), and some special sauce brewed in-house by yours truly.
This strategy is invite-only. Invitations are offered for a one-time fee of $250 payable in several cryptocurrencies (ETH, BTC, DASH, XMR or ZEC). Once you've got an invitation, you will automatically receive updates forever*.
DMF was designed to work across multiple asset classes. Extensive backtesting has been performed over multiple sample series (not just during the bull runs, for example) and against a randomized pool of assets. But don't take my word for it, I've included some time-based backtesting support tools to make it easy-peasy for you to validate the results yourself!
Under the hood, DMF is powered by numerous indicators, including:
✓ Double EMA & Composite SMA;
✓ Double RSI (fast & slow, variable);
✓ Composite StochRSI & VWAP (StochRSI+, two series);
✓ Composite Commodity Channel Index (CCI+, two series);
✓ Volume-Weighted Balance of Power (BOP itself was adapted from BOP_LB, kudos to LazyBear);
✓ Percentage Price Oscillator (PPO, split, two series);
✓ Range-adjusted Momentum Oscillator (RMOMO, my fancy MOM variant);
It crunches all that data and generates signals which are issued in two ways:
✓ Vertical Bands (or VBs) - Entry/Exit windows as vertical bands that remain "lit" (e.g. the background of a series of candles is semi-opaque white) while the top-level signals are showing sufficiently strong BUY signals. These windows are the primary entry/exit targets and can be relied upon with sufficient risk mitigation (e.g. a reasonable stop-loss or other scale-out exit mechanism). A VB followed immediately by an egg is as good as gold.
✓ Eggs - Entry/Exit validation signals that confirm the condition indicated by VBs. A lit VB without an egg in the same or next candle session is considered to be valid , but not safe (see above warning). Waiting for an egg can improve performance at the risk of missing the best possible entry point. Consider your risk tolerance and act accordingly.
Basic Instructions:
✓ Configure The Settings! The defaults are pretty good, but don't be scared to try variations. For example, by default SHORT positions are disabled. You might want to enable them if your risk tolerance allows them. (IMO there's gold on both ends of the rainbow. 🌈)
✓ Pay attention to the VBs. If you see a lit band being placed in an otherwise dark area, it's a projected inflection point. This is expected to be validated and confirmed in the same or immediately following period with an egg. You can enter a LONG position at this time.
✓ Pay attention to the eggs. If you see an egg, it's a confirmation that the VB changes in the same or immediately preceding candle period is valid. If you did not enter or exit your position at the point of the VB shift, now is the time to do so.
✓ Watch for the end of a VB period and be prepared to exit your position quickly as the next egg may be accompanied by a large directional momentum inflection.
Things to Note:
📉 - DMF is designed for day trading with aggressive position TTLs (15m was the upper bound during development and strategy testing). It appears to issue valid signals for other intervals, but it was not designed for >15m and YMMV. Don't go manually opening a LONG with no exit strategy and go to sleep... it probably won't work out to your benefit. You should be prepared to exit positions at any time. (Pro tip: automation is your friend!)
💸 - DMF indicator is not free from risk. As with all investment strategies, it is crucial to exercise caution and only trade with funds you are comfortable losing. DMF does not offer any form of guarantee or warranty, implied or otherwise. If you lose money, your house, your 401K... that's on you. (Pro tip: don't risk anything you're not ready to lose, because losses are part of the game and you WILL have them.)
🤔 - By using this indicator, you understand that any and all risks are the sole and complete responsibility of the end user (yeah, that's you). Don't use it if you're not 100% clear that you know exactly what you're doing. (Pro tip: always ask questions if you're feeling confused.)
⏱ - * Forever in this context means that, where room for improvement exists, I will improve it over time and you'll get all updates until I stop making them. (Pro tip: nobody lives forever.)

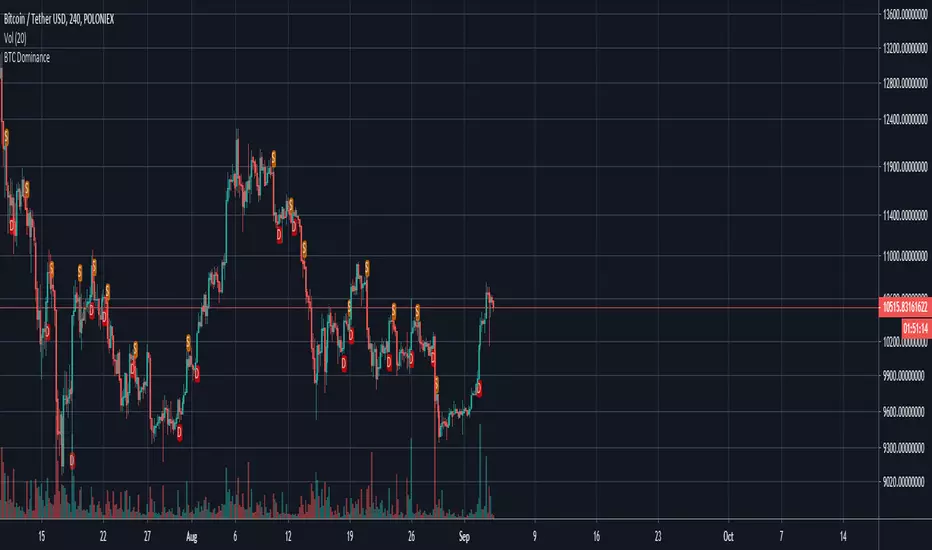
BTC Dominance IndicatorThis script calculates the BTC dominance and adds markers as overlays on top of your crypto chart.
A red "D" means "BTC dominating" and an orange "S" means "BTC submissive". In both cases further price actions are imminent.
You can use this script for any crypto asset to see how it performs while btc is dominating.
If you are for example trading a BTC paired asset, then this can give you a warning if BTC starts to dominate (BTC paired assets tend to dump if BTC dominates).
On the other hand, you can use this as signal on USD paired cryptos if BTC dominates as USD paired cryptos tend to go with BTC.
It is recommended to use additional indicators with this as it is not meant as buy/sell signalling tool.

MaverickWelcome to the Maverick.
How to use: Apply to any chart, on any time frame. You will see BULL and BEAR signals on the chart. A BULL signal represents an entry/buy in, and a BEAR represents an exit/ sell.
You can use the Maverick to scalp on low time frames such as the 5m, 15m, 30m etc. Or use the Maverick on higher time frames such as the 1hr, 2hr, 4hr.
You can use regular candles but Heikin Ashi are recommended for better accuracy.
When using Heikin Ashi, I have included a real price line which shows the actual price of the asset/chart at the close of each candle.
Settings alerts: You can easily set buy/sell alerts by selecting Maverick in the set alerts tab and selecting Bull for buy alerts and BEAR for sell alerts.
To gain access to this INVITE ONLY script, please join the discord for a free trial: discord.gg

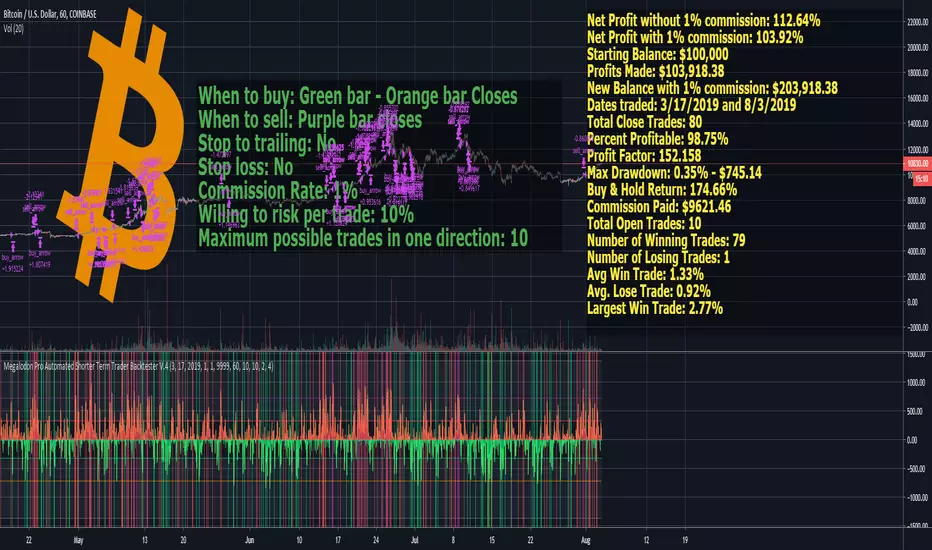
Megalodon Pro Automated Shorter Term Trader BacktesterSTRATEGY
When to buy: Green bar - Orange bar Closes
When to sell: Purple bar closes
Stop to trailing: No
Stop loss: No
Commission Rate: 1%
Willing to risk per trade: 10%
Maximum possible trades in one direction: 10
RESULTS
Net Profit without 1% commission: 112.64%
Net Profit with 1% commission: 103.92%
Starting Balance: $100,000
Profits Made: $103,918.38
New Balance with 1% commission: $203,918.38
Dates traded: 3/17/2019 and 8/3/2019
Total Close Trades: 80
Percent Profitable: 98.75%
Profit Factor: 152.158
Max Drawdown: 0.35% - $745.14
Buy & Hold Return: 174.66%
Commission Paid: $9621.46
Total Open Trades: 10
Number of Winning Trades: 79
Number of Losing Trades: 1
Avg Win Trade: 1.33%
Avg. Lose Trade: 0.92%
Largest Win Trade: 2.77%
Let me know what you guys think about the results?
Due to the tradingview's limitations on providing the shorter time frame price data, we had to provide a 60 minute time frame backtesting results.
The shorter time frames including 1 minute and 15 minutes backtesting results are way more accurate and precise than 60 minutes time frame results.
Megalodon Trading
Enlightening the Modern Investors
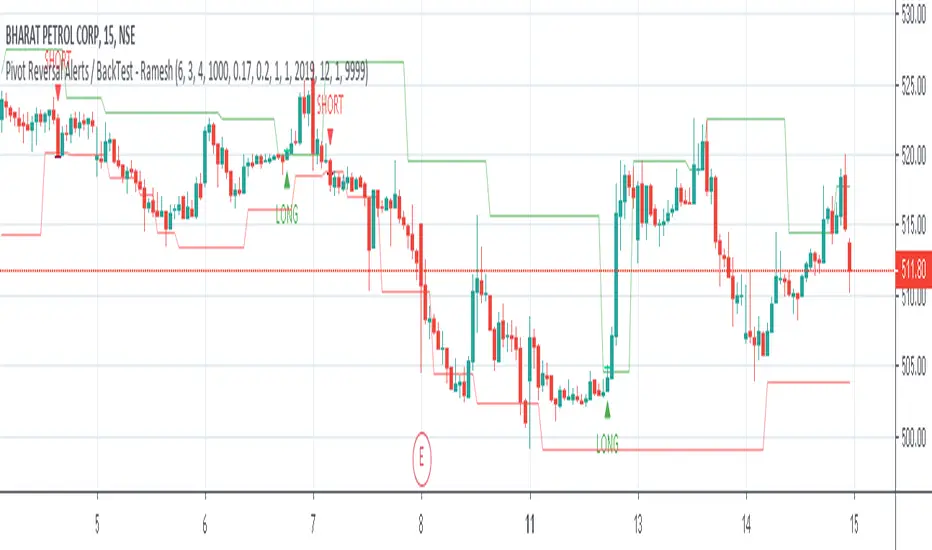
Pivot Reversal Strategy with ADX filter and Alerts V2 - RameshOne script with 80% Win Rate, applicable for 15m time period, more filters added to remove false signal.
Intelligent Exponential Moving Average Private AccessView the full documentation on this indicator here: www.kenzing.com
Note: This indicator is now intended for those who have been granted private access and may be more frequently updated than the previous versions.
Introduction
This indicator uses machine learning (Artificial Intelligence) to solve a real human problem.
The Exponential Moving Average ( EMA ) is one of the most used indicators on the planet, yet no one really knows what pair of exponential moving average lengths works best in combination with each other.
A reason for this is because no two EMA lengths are always going to be the best on every instrument, time-frame, and at any given point in time.
The " Intelligent Exponential Moving Average " solves the moving average problem by adapting the period length to match the most profitable combination of exponential moving averages in real time.
How does the Intelligent Exponential Moving Average work?
The artificial intelligence that operates these moving average lengths was created by an algorithm that tests every single combination across the entire chart history of an instrument for maximum profitability in real-time.
No matter what happens, the combination of these exponential moving averages will be the most profitable.
Can we learn from the Intelligent Moving Average?
There are many lessons to be learned from the Intelligent EMA . Most will come with time as it is still a new concept. Adopting the usefulness of this AI will change how we perceive moving averages to work.
Limitations
Ultimately, there are no limiting factors within the range of combinations that has been programmed. The exponential moving averages will operate normally, but may change lengths in unexpected ways - maybe it knows something we don't?
Thresholds
The range of exponential moving average lengths is between 5 to 40.
Additional coverage resulted in TradingView server errors.
Future Updates!
Soon, I will be publishing tools to test the AI and visualise what moving average combination the AI is currently using.
Follow and like for more content!

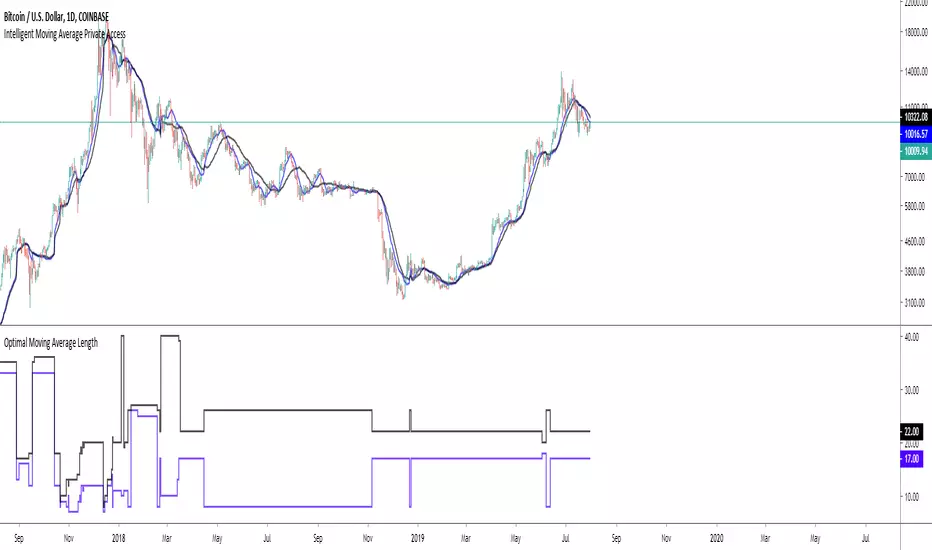
Intelligent Moving Average Private AccessNote: This indicator is intended for those who have been granted private access and may be more frequently updated than the previous versions.
Introduction
This indicator uses machine learning (Artificial Intelligence) to solve a real human problem.
The Moving Average is the most used indicator on the planet, yet no one really knows what pair of moving average lengths works best in combination with each other.
A reason for this is because no two moving averages are always going to be the best on every instrument, time-frame, and at any given point in time.
The " Intelligent Moving Average " solves the moving average problem by adapting the period length to match the most profitable combination of moving averages in real time.
How does the Intelligent Moving Average work?
The artificial intelligence that operates these moving average lengths was created by an algorithm that tests every single combination across the entire chart history of an instrument for maximum profitability in real-time.
No matter what happens, the combination of these moving averages will be the most profitable.
Can we learn from the Intelligent Moving Average?
There are many lessons to be learned from the Intelligent Moving Average. Most will come with time as it is still a new concept.
Adopting the usefulness of this AI will change how we perceive moving averages to work.
Limitations
Ultimately, there are no limiting factors within the range of combinations that has been programmed. The moving averages will operate normally, but may change lengths in unexpected ways - maybe it knows something we don't?
Thresholds
The range of moving average lengths is between 5 to 40.
Additional coverage resulted in TradingView server errors.
Future Updates!
This indicator will be maintained and many updates will come in the near future! Stay tuned.
View the documentation on this indicator here: www.kenzing.com
Tenkan Kijun Cross AlertTenkan Kijun cross alert, best used alongside a Volume indicator to help aid with finding those trend continuation patterns.
I prefer to use the Chaikin Money Flow, when it indicates and holds above the 0 line then you will bias Longs, and when below then you will Bias shorts
If you like this then please donate
BTC: 1LRbUgrkvFLQ5Mt7C62EJRD9aMvhDNT22K
ETH: 0xa509b89bccb788234278eFE63470c10946E26F3c
LTC: LV7MUr6arvCffS5N6pbTWgav5S3Yi1Eejp

Eunsa Bit_Teaching - pub> 매매 진행중에, 간헐적으로 도움을 받아 볼 수 있는 보조지표입니다
> 절대적인 지표가 아니며, 말 그대로 보조적으로 해당 시장상황에 맞춰 참조, 참고가 가능한 지표입니다
* 매수Position은 총 2차 분할매수로 이루어집니다
> Long (-) : 매수 Signal (1차 분할 매수진입) > Long(-) 1차 분할매수 진입이후, 재차 뜬다면 재진입이 가능하다는 Signal
> Long (+) : 매수 Signal (2차 분할 매수진입) > Long(+) 2차 분할매수 진입 영역입니다
> 따라서, Long(-) 2 ~ 3번 뜬다고, 2 ~ 3번 계속 누적진입 하는 것이 아니라, Long(-) 에 1번 진입입니다, 진입했는데 또 뜬다면 재진입이 가능하다고 인식하시면 됩니다
* 매도Position은 총 2차 분할매도로 이루어집니다
> Short (-) : 매도 Signal (1차 분할 매도진입) > Short(-) 1차 분할매도 진입이후, 재차 뜬다면 재진입이 가능하다는 Signal
> SHort (+) : 매도 Signal (2차 분할 매도진입) > Short(+) 2차 분할매도 진입 영역입니다
> 따라서, Short(-) 2 ~ 3번 뜬다고, 2 ~ 3번 계속 누적진입 하는 것이 아니라, Short(-) 에 1번 진입입니다, 진입했는데 또 뜬다면 재진입이 가능하다고 인식하시면 됩니다
> Long Danger : 급격한 매도세 감지
> Short Danger : 급격한 매수세 감지
(* Long Danger 가 뜬경우, 과매도권이라 보통의 경우 해당 시점부터 반등이 진행되는 경우가 많으며, Bear Trap일 경우가 많습니다. 그러나, 저같은 경우 안전하게 Long Danger시 Long Position에 대한 손절을 진행하며, 손절Sign 으로 인식합니다)
(* Short Danger 가 뜬경우, 과매수권이라 보통의 경우 해당 시점부터 조정이 진행되는 경우가 많으며, Bull Trap일 경우가 많습니다. 그러나, 저같은 경우 안전하게 Short Danger시 Short Position에 대한 손절을 진행하며, 손절Sign으로 인식합니다)
> Long 진입자를 위해, Long TP가 제공되오나 익절은 자유에 맡기고 있습니다
> Short 진입자를 위해, Short TP가 제공되오나 익절은 자유에 맡기고 있습니다
> TP에 꼭 익절하신다는 느낌보다 보조적으로 보시는게 좋습니다
* 가장 중요 *
> Long Term (장기추세) : Long Trend or Short Trend 표기
> Short Term (단기추세) : Long Trend or Short Trend 표기
> 장기추세와 단기추세가, 실시간으로 즉각 차트에 표기가 되어집니다
> 해당 경우를 응용하여 사용하는 경우에 대해서 예시를 보겠습니다
예시1)
- Long Term : Long / Short Term : Long => 장기추세와 단기추세가 모두 Long일 경우, 장기/단기추세가 상승추세를 의미합니다
- 예시1의 상황이 발생할 경우, 추세트레이딩을 하신다면 Short Signal이 나와도 Short 진입에 대해서 고려하지 않습니다
- 예시1의 상황이 발생할 경우, 추세트레이딩으로써 Long 진입에 대해서만 집중합니다
- 예시1의 상황이 발생할 경우, 역추세트레이딩을 하신다면 Short Signal이 나올 시, 진입하여 짧게 먹고 나옵니다
- 역추세트레이딩은 길게 가져 가는것이 결코 아닙니다
예시2)
- Long Term : Short / Short Term : Short => 장기추세와 단기추세가 모두 Short일 경우, 장기/단기추세가 하락추세를 의미합니다
- 예시2의 상황이 발생할 경우, 추세트레이딩을 하신다면 Long Signal이 나와도 Long 진입에 대해서 고려하지 않습니다
- 예시2의 상황이 발생할 경우, 추세트레이딩으로써 Short 진입에 대해서만 집중합니다
- 예시2의 상황이 발생할 경우, 역추세트레이딩을 하신다면 Long Signal이 나올 시, 진입하여 짧게 먹고 나옵니다
- 역추세트레이딩은 길게 가져 가는것이 결코 아닙니다
예시3)
- Long Term : Long / Short Term : Short
=> 장기추세와 단기추세가, 엇갈린 순간
=> 시장의 굉장한 급격한 변동과 추세돌파 및 이탈시점을 의미하며, 이경우 장기추세와 단기추세가 서로 엇갈림을 의미함
=> 해당 경우가 발생할 경우, '추세의 모호함'이라 칭하며, 장세의 방향이 어느곳으로 튈 지 추세가 정확히 잡히지 않은 상황을 의미함
=> 보수적, 안정적으로 트레이딩을 하신다면, '추세의 모호함'이 발생할 경우 매매진입은 고려하지않으며, 관망합니다
예시4)
- Long Term : Short / Short Term : Long
=> 예시3) 과 같습니다
*** 가장 중요 한 것 ***
> 해당 지표는, 말 그대로 보조지표 입니다
> 수익에 대해서 보장 하지 않으며, 손실이 날 수 있습니다
> 오히려, '손절' 에 대한 'Danger' 경고 표시를 함으로써, 해당 지표를 참조, 참고 함으로써 '수익극대화'보다는 '손실최소화'에 중점을 맞추고 있습니다
> 진입에 대한 Risk/Reward (손익비)가 최소 1:1 ~ 1:2 비율로 잡혀지게끔, 알고리즘이 짜여있습니다
> '손절'에 대한 경고를 표시함으로써, 승률 100%를 목표로 하는게 아니며, 승률 51~55% 정도를 겨냥하여 최대한 안정적 보수적인 '손실최소화' 중점의 지표입니다

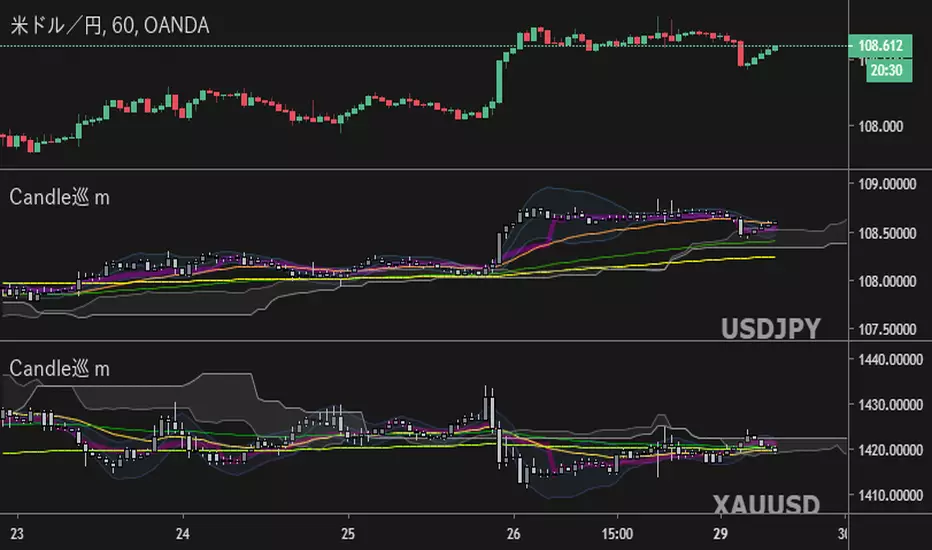
Candles [Meguru] MobileMulti-currency Indication For mobile "Candles[Meguru]Mobile"
The display of exchanges and major currencies has been made selective. (I thought about the use with a smartphone etc. and made it possible to omit the trouble of character input. It is also possible to enter manually.)
モバイル向け多通貨表示インジ『Candles[Meguru]Mobile』
取引所やメジャーな通貨の表示を選択式にしました。(移動時・スマホなどでの利用を考え、文字入力の手間を省略できるよう作成しました。手入力での設定も利用できます。)
反転チャート・時足の固定も可能です。
複数表示することで、多通貨を同時に表示・監視することもできます。
詳細、購入などはこちらにて
note.mu
Various Volume RSI (UNLIMITED)RSI displaying multiple currencies together (arbitrary input version)
forex or cryptcurrencies...economic index or metal or energy...and more...
複数の通貨をまとめて表示するRSIです。(任意入力版)
外国為替や暗号通貨...経済指数・金属・エネルギー...その他を表示できます。
同時に多通貨を監視することで見えてくるものがあります。
詳細、購入などはこちらにて
note.mu
