Trendmaster - Crypto Collated Open Interest OscillatorThe Crypto Collated Open Interest Oscillator collates Open Interest for Crypto Futures
Across the Crypto Exchanges and updated on the Daily Timeframe.
This is then smoothed to be actionable when massive Green structure on the oscillator
shows potentially a top before dumping and massive Red structure on the oscillator
加密數字貨幣

BTC Hashrate with smoothingBTC Hashrate with smoothing - thanks to the recent integration of IntoTheBlock data into Tradingview, we can now effortlessly show Hashrate data on our chart.
One popular use for Hashrate is to buy when the 30 day moving average crosses above the 60 day moving average, signifying that miner capitulation is over and recovery has started.
Definition
The Bitcoin hash rate is the number of times per second that computers on the Bitcoin network are hashing data to verify transactions and perform the encryption that secures the network. The hash rate is an indicator of how healthy the Bitcoin network is at any given time, and is driven primarily by difficulty mining and the number of miners. Generally, a high hash rate is considered a good thing.
More precisely, the Bitcoin hash rate is the number of times per second that computers on the Bitcoin network are hashing data to verify transactions and perform the encryption that secures the network.

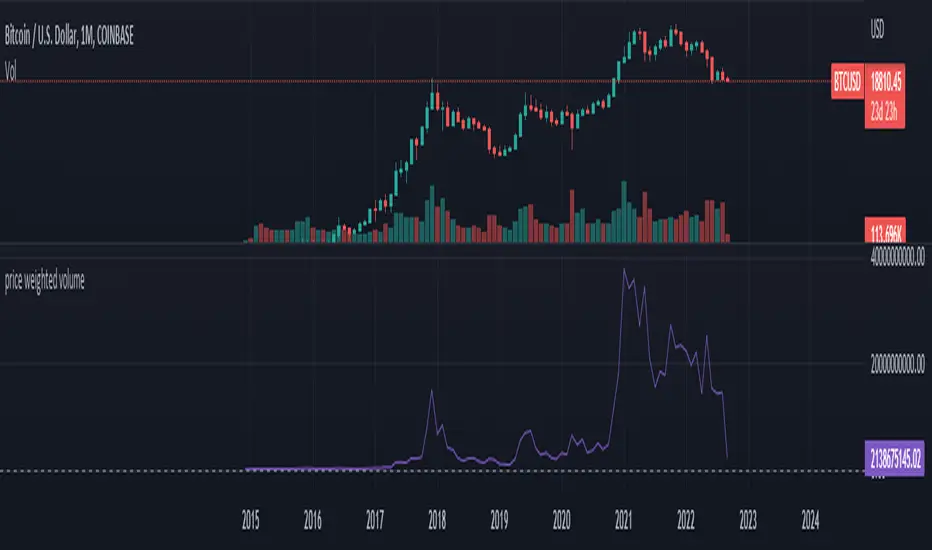
PWV - Price Weighted VolumeThis indicator charts
PWV = volume * close
in order to better visualize exchange volume.
TARVIS Labs - Alts Macro Bottom/Top SignalsSCRIPT DESCRIPTION
PLEASE READ THROUGH THIS CAREFULLY.
This is a script specifically written to help provide indicators from a macro view for ALTS. This script needs to be run on the 1 day. It helps indicate when to accumulate alts, and when its in a bull run when this a bull run top beginning to form with warnings, and a indicator that a top is in. This is described further below.
NOTE - in order to accomodate most alts the script had to be broad enough in its indicators to cover many different scenarios. If you are trading a smaller altcoin I suggest taking a more conservative approach to accumulation.
FAQs:
1. Why is there no accumulation zone showing up before an uptrend?
This could be because the trend has been so strong for this coin that there hasn't been a strong enough signal to accumulate or this could be that the chart doesnt have enough historical data (needs over 2 years) for the indicators to flash green.
2. Why is there no tops shown for a chart Im looking at?
This is either because there isn't enough historical data (needs over 2 years) for the indicators to build or because the altcoin didnt perform as well as the rest of the market. The altcoin has to perform as well as the market over the length of the bull run in order for the signals to show. Typically an altcoin that shows sharp increases and sharp drops shortly after will not have signals show up.
3. The "Potential End of Bull Run Top Indicator" showed up but we weren't near the top yet, why is that?
The alts indicator has to work across many altcoins, and their trends are not all the same. This can lead to the indicator showing but not necessarily being the exact top. The data from the alts macro bottom/top signals should be paired with the "TARVIS Labs bitcoin macro bottom/top signals" indicator for BTC. The reasoning is because if the top is not showing that its in for Bitcoin its likely that the altcoin's top is also not in. You should use the two in tandem to know if the bull run top is very likely in.
ACCUMULATION ZONE INDICATOR - LIGHT GREEN
Description
When we look at the general crypto landscape, the 200d & 300d EMAs are extremely useful. We can use their cross and momentum in order to determine a bottom forming. If the price has fallen over 40% below the 200 day EMA and the 200 day EMA has crossed below the 300d EMA, its a downtrend with a steep fall, which could indicate a good time to accumulate. When we see the 200 day EMA's slope drop drastically (over 5% w/w) it is also a good signal to accumulate.
Strategy for Usage
For alts, the strategy can vary drastically. You need to take into account:
1. the market cap of the altcoin, is it a smaller market cap altcoin or a larger one?
2. historical trend, does it typically trend strongly with a smaller accumulation zone?
Once you've taken these into account you can form a strategy. For example, if the altcoin has had smaller accumulation zones historically you'll want to take advantage of the accumulation zones when they pop up and be more aggressive (say a 30 day accumulation). If the altcoin has historically had longer accumulation zones then you'll want to be more conservative with your strategy and potentially have a 100 day (or even longer) accumulation period. If the altcoin is a smaller market cap alt, you will want to also take that into account. You'll want to likely be more conservative,
STRONG BUY IN ACCUMULATION ZONE INDICATOR - DARK GREEN
Description
We can add to the bottoming signal by looking for strong downtrends inside the bottoming signal. We do this by seeing when the 36 day EMA has a slope decreasing by 2% day/day.
Strategy for Usage
These strong downtrend days can be used to add more to our accumulation strategy. We can add more on these days (ex. double what you were planning to on a typical accumulation day).
LOCAL TOP NEAR BULL RUN TOP INDICATOR - RED
Description
When the 100 week EMA is in a strong uptrend (4% increase w/w) we can look for significant loss of momentum in order to determine if a local top is in near a bull run top. This strategy uses a MACD with 9/36/9 config for the daily chart. We look for the signals momentum loss, when the slope becomes negative.
Strategy for Usage
Ideally the right strategy to use here is to exit the market when this indicator starts. When the indicator ends if the "Potential End of Bull Run Top Indicator" is not showing on the chart you can buy back into the market.
POTENTIAL END OF BULL RUN TOP INDICATOR - DARK RED
Description
When the 100 week EMA is in a strong uptrend (3% increase w/w), and a MACD config of 108/234/9 has a negative signal slope signifying a very large momentum loss, but the 1d 18 EMA is still above the 1d 63 EMA we show this signal.
Strategy for Usage
This is a strong indicator that the top is in, and it potentially being the bull run top. Because alts can vary strongly in their charts, this should be a strong warning but not necessarily a certainty that the bull run is over.

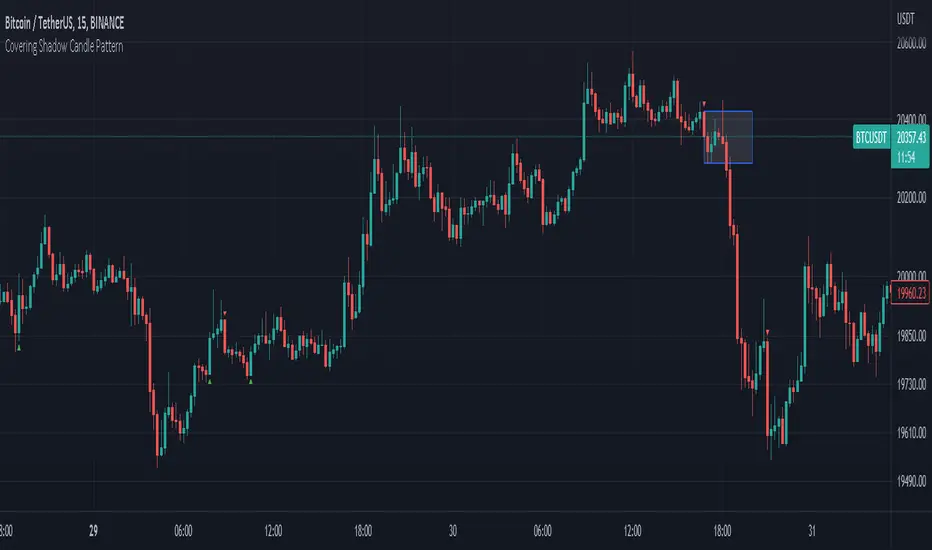
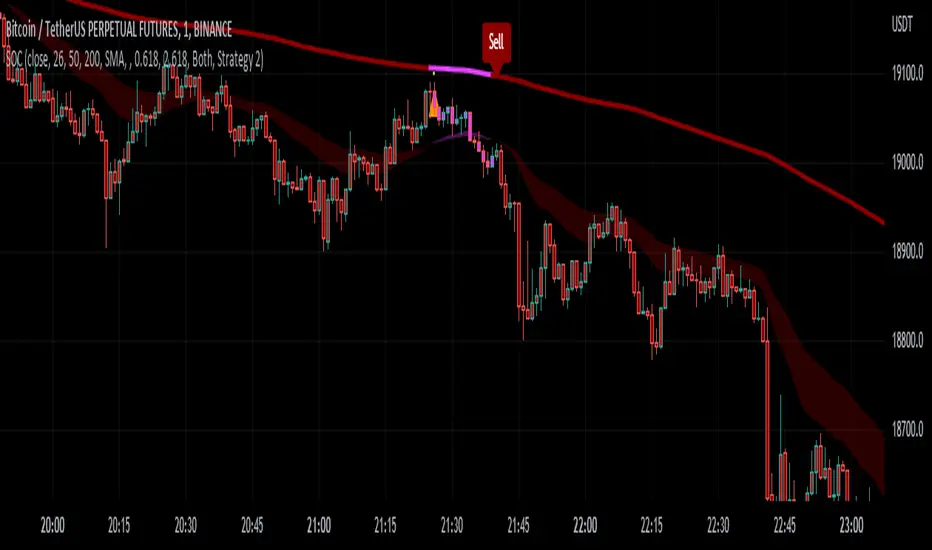
Covering Shadow Candle PatternThis indicator shows 3 types of objects on chart:
1. downward red triangle above a candle: 3 green candles followed by a fourth red candle of which the low price is lower than the low of the 3 previous green candles, this is usually the sign of reversal from upward movement to a downward one.
2. 1. upward green triangle below a candle: 3 red candles followed by a fourth green candle of which the high price is higher than the high of the 3 previous red candles, this is usually the sign of reversal from downward movement to a upward one.
3. boxes: these boxes are drawn when the patterns of cases 1 and 2 fails to perform as expected which means we have some important areas at that level so it can be a resistance or support zone .
TARVIS Labs - Bitcoin Macro Bottom/Top SignalsSCRIPT DESCRIPTION
This is a script specifically written to help provide indicators from a macro view. This script is best run on the 1 day interval on Bitstamp's $BTCUSD chart. It helps indicate when to accumulate bitcoin, and when its in a bull run when there are local tops, strong top warnings, and a signal to exit a bull run. This is described further below.
If you don't have interest in trading on the way to the top I suggest turning off the following indicators in the settings of the indicator:
- Opportunity To Buy Back In Indicator
- Local Top Near Bull Run Top Indicator
ACCUMULATION ZONE INDICATOR - LIGHT GREEN
Description
When we look at the history of Bitcoin every bottom has crossed below the 100 week EMA. Once it does its accompanied by hash ribbon cross with miner capitulation. After that is the prime time to accumulate as theres a clearer signal the bottom is in. Specifically, a signal to look for is the 14 day MACD/signal cross and the 14 day MACD continuing to stay above the signal until the price returns above the 100 week EMA. This is prime accumulation territory.
Strategy for Usage
A good strategy to use when accumulating the bottom is dollar-cost averaging over a 30 day period. The accumulation zone can last longer than 30 days but 30 days is a good range of time to DCA.
STRONG BUY IN ACCUMULATION ZONE INDICATOR - DARK GREEN
Description
We can add to the bottoming signal by looking for post-downtrend reversals inside the bottoming signal. We do this by using a 9/19 daily cross.
Strategy for Usage
These post-downtrend reversals can potentially provide better targeted days for accumulation than the broader bottoming signal and can be used to add more on that day than on an average day for the dollar cost average strategy. Say for example, use 1/3 of funds on these days rather than 1/30th.
OPPORTUNITY TO BUY BACK IN INDICATOR - BLUE
Description
When the 1d 18 EMA > 1d 63 EMA and the 12/52 1d crosses. These together provide good buy opportunities to buy bitcoin.
Strategy for Usage
If you happen to find yourself out of the market from your own TA or a trade, this signal can provide a buy opportunity to reenter the market if you're out of it.
BULL RUN LOCAL TOP INDICATOR - ORANGE
Description
We will similarly use the 100 week EMA to determine trend reversal into a bull run. When we see the 100 week EMA uptrending, we can begin to look for local tops using the 9/19 daily MACD/signal bearish cross along with the 12 EMA having a negative slope, which could be the beginning signal for a local top.
Strategy for Usage
This is a rather light indicator, but can be used in tandem with your own technical analysis to determine if you want to reenter after you exit from its signal.
LOCAL TOP NEAR BULL RUN TOP INDICATOR - RED
Description
When the 100 week EMA is in an uptrend we can look for significant loss of momentum in order to determine if a local top is in near a bull run top. Similar to the Bull Run Local Top Indicator, this strategy uses a MACD/signal cross but instead uses the 30/65 day EMAs.
Strategy for Usage
Ideally the right strategy to use here is to exit the market when this indicator starts. When the indicator ends if the "End of Bull Run Indicator" is not showing on the chart you can buy back into the market.
TOP IS LIKELY IN INDICATOR
Description
When the 100 week EMA is in a very strong uptrend and the 9/19 weekly MACD/signal bearish cross occurs, and the 63 EMA begins to downtrend.
Strategy for Usage
This signal typically accompanies the "Local Top Near Bull Run Top Indicator" therefore if you're following the strategy you would likely already be out of the market, but if you're not and this signal fires its a strong signal the top is in and we're likely going to start seeing a strong retrace. This is typically right before we see the "End of Bull Run Indicator". There is only one occurrence where it wasn't followed by a large drop & the "End of Bull Run Indicator" and that was in the 2017 bull run where there were many strong retracements post local top. The likelihood we see that again is low, but if it were to happen you can buy back into the market when the "Top is Likely In Indicator" and the "Local Top Near Bull Run Top Indicator" are not firing.
TOP IS LIKELY IN INDICATOR
Description
When the 100 week EMA is in a strong uptrend and the 9/19 weekly MACD/signal bearish cross occurs, and the 63 EMA begins to downtrend.
Strategy for Usage
This signal typically accompanies the "Local Top Near Bull Run Top Indicator" therefore if you're following the strategy you would likely already be out of the market, but if you're not and this signal fires its a strong signal the top is in and we're likely going to start seeing a strong retrace. This is typically right before we see the "End of Bull Run Indicator". There is only one occurrence where it wasn't followed by a large drop & the "End of Bull Run Indicator" and that was in the 2017 bull run where there were many strong retracements post local top. The likelihood we see that again is low, but if it were to happen you can buy back into the market when the "Top is Likely In Indicator" and the "Local Top Near Bull Run Top Indicator" are not firing.
END OF BULL RUN INDICATOR
Description
When the 100 week EMA is in an uptrend and the 1d 18 EMA crosses the 1d 63 EMA.
Strategy for Usage
When the 100 week EMA is a strong uptrend and the 18/63 cross occurs the top is very likely in. It has occurred in every bull run top leading to the bear market.

Stablecoins CorrelationThe indicator shows the correlation between stablecoins and bitcoin by means of liquidity flowing from stables to crypto and back. Where the indicator has highs, the bitcoin is usually the bottom and vice versa.

Trendmaster - Collated Funding RatesCollated Funding Rates is a Crypto Specific Indicator that pulls Exchange Funding Rate Data from several exchanges for both Bitcoin and Ethereum.
By combining both the Funding Data for Bitcoin and Ethereum across several exchanges, a Trader can see the Collated Funding Rates from several Crypto Exchanges.
What are Funding Rates?
Funding rates are periodic payments either to traders that are long or short based on the difference between perpetual contract markets and spot prices.
Therefore, depending on open positions, traders will either pay or receive funding. Crypto funding rates prevent lasting divergence in the price of both markets
These Funding Rates also incentivize Liquidity Providers to take certain positions whether Long or Short based on the Funding Rate.
What are Liquidity Providers?
A Liquidity Provider, also known as a Market Maker, is someone who provides their crypto assets to a platform to help with the decentralization of trading.
In return, they are rewarded with fees generated by trades on that platform, which can be thought of as a form of passive income.
H ow to use Collated Funding Rates:
When the Funding Rate is positive, the price of the perpetual contract is usually higher than the market price.
Thus, traders who are long pay for short positions. Conversely, a negative Funding Rate means that short positions pay for longs.
As the funding rate increases from negative to positive Traders and Liquidity Providers are incentivized to take short positions.
This can be seen on the indicator as it moves from down to up and changes from red to green.
As the funding rate decreases from positive to negative Traders and Liquidity Providers are incentivized to take long positions.
This can be seen on the indicator as it moves from up to down and changes from green to red.
Funding Rates are used by Exchanges to manipulate the price.
Because of this fact, Collated Funding Rates can show trend changes based on when a specific up or down move in Price is incentivized by Exchange Funding Rates.

Trendmaster - LiquidationsTrendmaster™ - Liquidations is a Crypto Specific Indicator that shows liquidation levels depending on the leverage of positions entered within a certain period.
What are Liquidation Levels?
A liquidation level is expressed as a percentage value of the assets in a trader's margin account.
If a Crypto trader's positions go against them, their account will eventually reach the liquidation level, unless the trader injects additional funds.
Another name for liquidation level is liquidation margin.
How to use Liquidations:
High leverage positions such as 100x or 50x traders have a higher probability of being liquidated within intraday trading.
The lower a trader's leverage is, can decrease the probability of their position getting liquidated.
This means that using the Liquidations Indicator, users can see other traders’ liquidation levels based on several time periods.
The liquidation levels shown by the Indicator are 100x, 50x, 20x, 10x, 5x, 3x, and 2x in the periods Daily, Weekly, Monthly, and Yearly.
This means that within a certain period users can see the liquidation positions of other traders at all of those periods and use that information to predict price movements and reversal points.

[KRONOS] FlowDescription
The main indicator component is a white signal line calculated from the price and strength of the current market pair filtered using the Fourier transformation formula (by Joseph Fourier).
It includes
Trend confirmation. The grayish line is the signal line moving average which can either be used as a support/resistance line or as a strong trend confirmation in the case of a crossover/crossunder.
Oversold and overbought areas. These areas are marked with multiple hues of red and blue color for them to be more easily noticeable.
Extreme areas. Arrows around extreme areas are showing points where a reversal is very likely to occur.
How to use?
Buy/Long on a blue arrow (or after a crossover if you want more confirmations)
Sell/Short on a red arrow (or after a crossunder if you want more confirmations)
extra tip: use the zero line and overbought/oversold areas as a take profit area and place your stop loss at the previous swing low.

[KRONOS] MomentumDescription
This indicator is based on an algorithm which provides accurate momentum tracking on every timeframe. It is visualized as a colored histogram and through some other tools.
The value is calculated from an exponentially weighted moving average that is used to get a high and a low deviation, merging the last value into a range.
It includes
Overbought and oversold fixed areas. Their purpose is to facilitate the recognition of areas where the trend is likely to end or cool down. They are also marked with a background coloring.
Zero line. It typically represents a change of trend when the price crosses under or over it.
Volume shifts. Colored arrows will appear whenever a volume change is detected.
How to use?
Buy/Long on a blue confirmation arrow
Sell/Short on a red confirmation arrow
Take profit when the indicator starts showing a blue background
Take profit when the indicator starts showing a red background
extra tip: the zero line often acts as support / resistance similarly to the overbought and oversold areas

Investing - Order HelperFYI: This idea is not new and I believe there is plenty of other indicator similar to this. I have used 'Scaled.orders' from @highewaterr and add in additional calculation.
This is for education purposes only, if you decide to use it LIVE and you lose money using it, it is not my fault. Do not risk what you can't afford to lose.
Order Helper was improved to better help simplify my investing journey.
It calculates each size and price automatically for me after inputting into the settings.
Unlike the common investing method (DCA Daily/Weekly/Monthly or Support & Resistance).
There is issue for these investing method.
DCA based on time is prompt to buying at higher price which will bring your average cost and your risk higher .
So why risk more when you have plenty of time to wait for the project/stocks to be at a discount?
Support & Resistance based can be a hustle to some investor like me.
Why?
1. Complication when drawing multiple support & resistance line / zone.
2. Time Consuming (Refer to point 1)
To reduce/eliminate the issue prompt by these 2 investing method, I use order helper.
It free up that few minutes of each chart, reduce the complexity in drawing support & resistance.
However, it bring method is prompt to 'missing out'.
IF I were to stick to the prices and size based on this indicator, my order might not be triggered and price just continue going.
But personally, I am fine with it. As I would rather miss out than putting my hard earned money in a higher risk.
---------------------------------------------------------------------------------------------------------------------------------
Main Component of this indicator
Scaling options is the main component of this indicator.
There is 4 options to this component:
Linear
Ease-in -> The amount of orders/size CLOSEST to the START price, will be higher.
Ease-out -> The amount of orders/size FURTHEREST to the START price, will be higher.
Ease-in-out -> It's a mixture of Ease-in and Ease-out.
How to use this indicator?
It is best for you to play around with the settings, as it will be easier to understand rather than reading how I do it.
There is no right or wrong method in using this indicator. But this is how I use it.
Go to a higher time frame (Weekly/Monthly)
Identify major support & resistance
Open up 'Order Helper' settings
Input your preferred options (Linear/Ease-in/Ease-out/Ease-in-out)
Input the start price -> referring to the first major support & resistance line (closes to the current price)
Input the end price -> referring to the last major support & resistance line (furtherest away from the current price)
Input the number of orders you preferred
Position Size that you wish to purchase
I decide not to share the source code of this as I do not fully understand the math calculation behind.
But if it works, and it helps me. Then those math calculation doesn't really matter.
Hopefully this will help simplify your investing journey.
If there is any question, feel free to comment it below and I will try my best to assist.

Investing - Correlation Table This correlation tables idea is nothing new, many sites provides it.
However, I couldn't find any simple correlation indicator on TradingView despite how simple this indicator is.
This indicator works as its called. Calculating the correlation between 2 projects (can be used in stocks as well) using the 'ta.correlation' feature built into pinescript.
When it comes to investing, we do not want our stocks / crypto project to be heavily correlated to each other.
If they are heavily correlated to each other, then there isn't much point in diversifying.
That being said, it can be useful for traders who trade multiple pairs.
-----------------------------------------------------------------------------------------------------------------------------------------------------------
In this indicator, consist of 5 primary input and 15 secondary input (Symbol List).
Correlation Source:
This input options allow you to change how the correlation is calculated. By default, it uses 'close'.
Correlation Percentage(%):
This input options allows you configure how many (%) of correlation is considered as 'decoupled'.
This correlation will only move between -100% ~ 100%.
100% refers to it moving together.
-100% refers to it moving the opposite direction.
For example, Project A rises in Price, what is the possibility of Project B following:
A 100% correlation between Project A and Project B, refers to Project B will follow Project A movement.
A 50% correlation between Project A and Project B, refers to there is only 50% chance for Project B to follow Project A movement.
A -20% correlation between Project A and Project B, refers to there is a 20% chance of Project B moving the opposite direction of Project A
(Refers to the table on chart above to better understand what the numbers means. DOT/USD has a 100% correlation to DOT/USD. However. MXCUSDT has a -37.2% correlation to DOT/USD.)
Amounts Bars To Check:
This input options will check the amount of bars since the last bar in the chart.
If you want to know the correlation of the past 100 days in a daily chart, you will enter '100' into this options and it will check only the past 100 days.
Symbol List
This will allow you to input all the project symbol ticker ID to add into the correlation table.
-----------------------------------------------------------------------------------------------------------------------------------------------------------
Originally, I wish to use for loop to go through the symbol list to reduce the amount of code required. However, due to limitation of 'request.security' feature, I had to abandon that idea and use hard-coded for requesting security and use a while loop to identify the symbol correlation value in the array set then set the table value accordingly.
If there is any script writer could improve this or any unclear explanation, feel free to drop a comment below.

Crypto Terminal [Kioseff Trading]Hello!
Introducing Crypto Terminal (:
The indicator makes use of cryptocurrency data provided by vendor INTOTHEBLOCK.
NOTE: The cryptocurrency on your chart must be paired with USD or USDT. Data won't load otherwise - possibly transient. For instance, BTCUSD or BTCUSDT, ETHUSD or ETHUSDT.
Provided datasets:
Twitter Sentiment Data
Telegram Sentiment Data
Whale Data (i.e. % of Asset Belonging to Whales)
$100,000+ Transactions
Bulls/Bears (Bulls Buying | Bears Selling)
Current Position PnL (Currently Open Positions for the Coin are Retrieved and Plotted. Data is Split into Currently Profitable Positions, Losing Positions, and B/E Positions)
Average Balance
Holders/Traders Percentage (Addresses are Retrieved and Classified as Holding Accounts or Trader Accounts)
Correlation
Futures OI
Perpetual OI
Zero Balance Addresses
Flow (Money Inflow & Outflow)
Active Addresses
Average Transaction Time
Realized PnL (Addresses with Realized Profits, Realized Losses, and B/E)
Cruisers
A few more data points are provided.
Additionally, you can plot the values of any dataset in a pane below price.
Below are images of plottable data; different cryptocurrencies will be shown for each example (:
Twitter sentiment data.
Assess this data lightly; difficult to confirm accuracy.
Telegram sentiment data.
Assess this data lightly; difficult to confirm accuracy.
Percentage of asset belonging to whales.
$100,000+ transactions (volume oriented)
Bulls buying; bears selling.
Current positions at profit; current positions at loss; current positions at breakeven.
Average balance.
Percentage of asset belonging to traders; percentage of asset belonging to holders.
Asset's 30-interval correlation to BTC.
Perpetual open interest.
Zero-balance addresses.
Flows.
Active addresses.
Average transaction time.
Addresses at realized profit; addresses at realized loss; addresses at breakeven.
Cruiser data.
Futures open interest.
Naturally, this data isn't provided for every cryptocurrency; NaN values are returned in some instances.
Table 1
I provided three data tables, which load independently, so you don't have to change plotted data to access values.
Table 2
Lastly, you can create a 10-asset crypto index and run calculations against it.
The image shows an example.
I'll update this script with additional calculations/data in the near future. If you've any suggestions - please let me know!
Enjoy (:

MASIG#2this indicator founded from easy combined
1.EMA
2.ATR/Supertrend
3.ADX/DI+DI-
4.MACD
5.Dochian
6.OBV
and show by line label and background

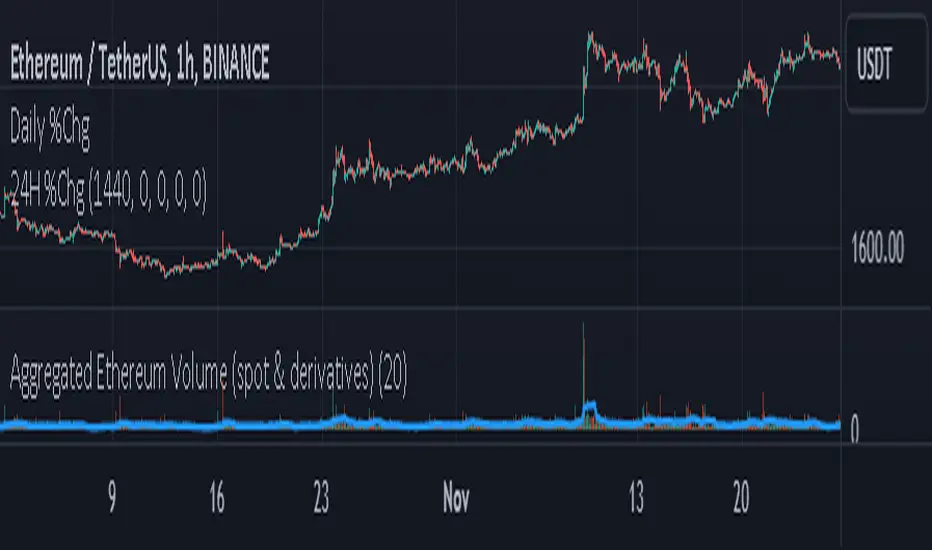
Aggregated Ethereum Volume (spot & derivatives)AGGREGATED ETHEREUM VOLUME INDICATOR (spot & derivatives)
This indicator aggregates volume for the most liquid ethereum pairs AND instruments, from exchanges known to *not* have fake volume . A few legit exchanges are missing as not available in Tradingview at the moment (e.g. FTX US).
Volume is separated into four categories: spot (stablecoin pairs), spot (fiat pairs), derivatives (perpetuals), and tradfi derivatives ( CME futures ). Can plot them all four together (default setting) or individually.
Volume is "aggregated in equivalent number of eth" (default setting) -- although users can change that to "aggregated in total USD". Doing so required converting volume for some ETH pairs and (derivatives) contracts that don't record volume in number of eth (but rather record it in USD or number of contracts).
Volume from crypto futures contracts (i.e. not Tradfi) is missing given how these contracts expire, and rolling them over would require extensive manual input. Futures' volume track perpetuals' volume , and are considerably smaller than perpetuals', therefore its absence does not have a noticeable impact on output. Time series for CME futures don't suffer from this inconvenient as the CME offers a continuous time series.
For the sake of simplicity, the price time series used for normalizing volume into ETH units is Bitstamp's (as it is the longest time series available). Prices of USDT and USDC is ignored in this first version.
List of exchanges included: Binance, Binance US, OKX, Huobi, FTX, Bittrex, Gate, Kucoin, Poloniex, Coinbase, Bitfinex, Bitstamp , Gemini, Bitflyer, Upbit, Kraken, Bybit, Bitmex, Deribit, CME
List of pairs/instruments that had to be converted from total USD into number of eth: FTX:BTCUSDT, FTX:BTCUSD, BITMEX:XBTUSD, BYBIT:BTCUSD, DERIBIT:BTCPERP, FTX:BTCPERP
List of pairs/instruments that had to be converted from number of contracts into number of eth: BINANCE:BTCPERP, OKEX:BTCPERP, OKEX:BTCUSDTPERP, CME:BTC
Final note: I recommend to look at aggregated ethereum volume in ETH (not in USD) and for all categories (spot and derivatives) to get a better picture of what's happening in the market. Looking at volume in USD rather than in ETH makes volume obviously dependent on ethereum's price. This is a major problem for volume analysis. Given how volatile ETHUSD is, price then accounts for most of the variance in volume , making volume comparisons across time difficult.
If you have any suggestions please drop them in the comments.
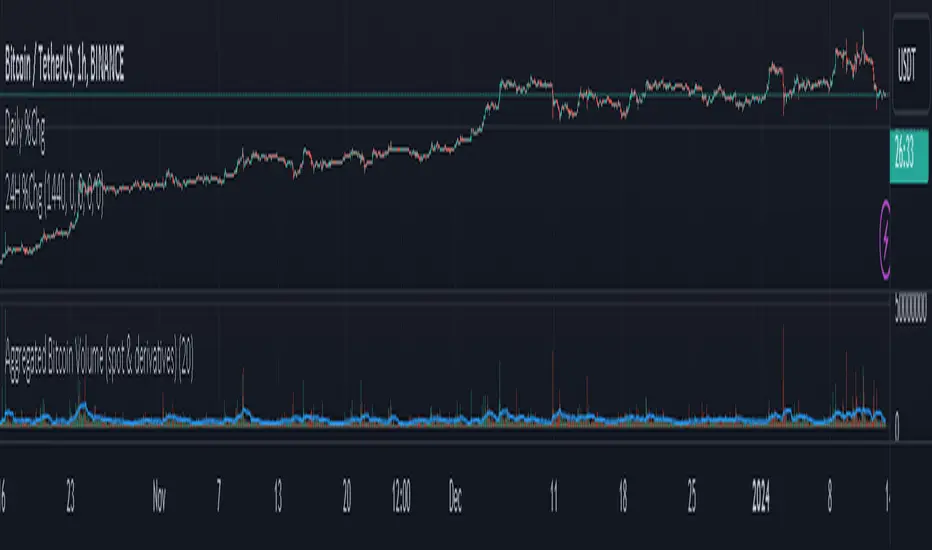
Aggregated Bitcoin Volume (spot & derivatives)AGGREGATED BITCOIN VOLUME INDICATOR (spot & derivatives)
This indicator aggregates volume for the most liquid bitcoin pairs AND instruments, from exchanges known to *not* have fake volume. A few legit exchanges are missing as not available in Tradingview at the moment (e.g. FTX US).
Volume is separated into four categories: spot (stablecoin pairs), spot (fiat pairs), derivatives (perpetuals), and tradfi derivatives (CME futures). Can plot them all four together (default setting) or individually.
Volume is "aggregated in equivalent number of bitcoin" (default setting) -- although users can change that to "aggregated in total USD". Doing so required converting volume for some bitcoin pairs and (derivatives) contracts that don't record volume in number of bitcoin (but rather record it in USD or number of contracts).
Volume from crypto futures contracts (i.e. not Tradfi) is missing given how these contracts expire, and rolling them over would require extensive manual input. Futures' volume track perpetuals' volume, and are considerably smaller than perpetuals', therefore its absence does not have a noticeable impact on output. Time series for CME futures don't suffer from this inconvenient as the CME offers a continuous time series.
For the sake of simplicity, the price time series used for normalizing volume into BTC units is Bitstamp's (as it is the longest time series available).
List of exchanges included: Binance, Binance US, OKX, Huobi, FTX, Bittrex, Gate, Kucoin, Poloniex, Coinbase, Bitfinex, Bitstamp, Gemini, Bitflyer, Upbit, Kraken, Bybit, Bitmex, Deribit, CME
List of pairs/instruments that had to be converted from total USD into number of bitcoin: FTX:BTCUSDT, FTX:BTCUSD, BITMEX:XBTUSD, BYBIT:BTCUSD, DERIBIT:BTCPERP, FTX:BTCPERP
List of pairs/instruments that had to be converted from number of contracts into number of bitcoin: BINANCE:BTCPERP, OKEX:BTCPERP, OKEX:BTCUSDTPERP, CME:BTC
Final note: I recommend to look at aggregated bitcoin volume in bitcoin (not in USD) and for all categories (spot and derivatives) to get a better picture of what's happening in the market. Looking at volume in USD rather than in BTC makes volume obviously dependent on bitcoin's price. This is a major problem for volume analysis. Given how volatile BTCUSD is, price then accounts for most of the variance in volume, making volume comparisons across time difficult.
If you have any suggestions please drop them in the comments.
Wave Strength Oscillator By CryptoScriptsThe Wave Strength Oscillator uses a combination of wave strength and momentum to help catch the best entries for reversals and does so using a few methods. I'm currently using the 1h timeframe for BTC but feel free to experiment on different timeframes to see what works best for you. In the description below, I'll go over each signal, how it's derived, and how to use them!
Oversold (Green shaded area) - The oversold indication appears whenever both oscillators are oversold and is usually a good indicator that a reversal to the upside is around the corner (at least for a short period). Be advised these are the weakest of the three signals so I recommend using this signal with other indicators.
Overbought (Red shaded area) - The overbought indication appears whenever both oscillators are overbought and is usually a good indicator that a reversal to the downside is around the corner (at least for a short period). Be advised these are the weakest of the three signals so I recommend using this signal with other indicators.
Green Diamond - The green diamonds indicate whenever one or both of the oscillators are oversold AND they are both outside of the bollinger bands which is great for catching reversals to the upside (as seen in the chart). These may come two or three at a time so it may be best to wait until they have all printed before entering.
Red Diamond - The red diamonds indicate whenever one or both of the oscillators are overbought AND they are both outside of the bollinger bands which is great for catching reversals to the downside (as seen in the chart). These may come two or three at a time so it may be best to wait until they have all printed before entering.
Rocket - The rocket symbol occurs whenever BOTH oscillators are oversold and BOTH oscillators are outside of the bollinger bands. This is great for catching reversals to the upside but may come two or three at a time so it may be best to wait until they have all printed before entering.
Red Alarm - The red alarm symbol occurs whenever BOTH oscillators are oversold and BOTH oscillators are outside of the bollinger bands. This is great for catching reversals to the downside but may come two or three at a time so it may be best to wait until they have all printed before entering.
Input Options
Show Histogram - I also included a Histogram in the indicator to help gauge the level of buys/sell strength but kept it hidden for the default levels (i.e a green diamond with a red histogram bar is usually a good sign a reversal is about to happen to the upside whereas a green diamond with a green histogram bar may indicate a false reversal and there's still more room to the downside until a red bar appears. Always backtest this!)
Show Overbought/Oversold Levels - This is if you want to ignore all of the green/red shaded areas and only focus on the diamonds and rocket/alarm signals
Wave Overbought/Oversold Levels - Free free to change to value of the overbought/oversold levels to change where the green/red shades areas print
Momentum Overbought/Oversold Levels - Free free to change to value of the overbought/oversold levels to change where the green/red shades areas print
Histogram Length - This will not change anything with the signals but I included it so you can change the visuals if it helps you
Momentum Length - This will change where the signals plot
Momentum Signal - This only changes the yellow signal line and nothing else. It's not incorporated into any equation
Average Length - This will change where the signals plot
Alerts
I've set alerts on this indicator for each icon (Oversold, Overbought, Green Diamond, Red Diamond, Rocket, Red Alarm). I HIGHLY recommend setting the alerts for Candle Close so that you can be sure the signal is confirmed.
You may notice that the indicator can give multiple signals back-to-back or be overbought/oversold for multiple candles. When this happens, it's best to look at other indicators such as the RSI , MFI Pro, etc to nail the best entry and have confluence with your decision. With that said, having multiple signals back-to-back can also be an indication that the move is close to happening. This indicator works with crypto and stocks as well.
If you have any questions or would like to purchase this indicator, please comment below or PM me. I also made a video tutorial for the indicator on my Youtube channel (link is next to my profile pic)
Be advised past performance is not indicative of future returns. Backtest EVERY timeframe and NEVER blindly take signals! Also, never invest more than you can afford to lose.
Enjoy :)

TBT Base to Quote Currency ConverterKnowing how much volume is traded on a chart is essential, but only knowing the Base volume can be confusing- especially when it's for a token only worth 0.00000210 sats. Put away your calculators and use this indicator instead to instantly convert the Base traded volume to Quote.
For example, on the chart above for BTCUSDT:BINANCE, if you add the Volume indicator, it is showing volume traded in the Base currency, which is Bitcoin. But it's more important to know how much QUOTE currency has been traded, which would be USDT in this case.
This is particularly useful when trading low-volume charts for AB Trading, something we teach in several of our courses.
Lastly, we have included a 30-period SMA to show average trading volume over the last 30 periods. Keep in mind that this will be more helpful when used on the daily time frame to get a general idea of the average trading volume over time for a trading pair.

Bitcoin Indicator CBitcoin Indicator C is the missing part of the whole picture. It must be used together with Bitcoin Indicator B for the best results possible!
Indicator B is to find the entry on the market sharp, while the new Indicator C will help you to find the zone where it's time to look for the entry. The dots do NOT represent the start nor the end of the trend, they only show the cross of the waves. Indicator C was created to see the bigger picture of the market. You will see 3 waves on the indicator. The white wave is the main indication of the trend, however all of them should be considered together. Think about it as a painting so just step back and watch the whole picture. If you see the waves topping and start to form a downtrend it's time to find your entry on Indicator B. Also when you see waves bottoming it's time to look for the entry of the Long trade.
When all of 3 waves moving together parallel from the top to the bottom that's a strong downtrend. Opposite occurs when there is a strong uptrend on the market.
These waves were created to show unique repeating patterns, too. For example: White wave bottoming while others keep painting on the upside of the zero line. Other example if repeating waves getting lower and lower... Learn more about unique patterns on our website!

Sherry on cryptoIf the price is above the 200 EMA, you are allowed to open only long positions and avoid shorts.
If the price is below the 200 EMA, you are allowed to open only short position and avoid longs. Don't use this indicator alone, use RSI, Stochastic RSI etc. Do not use this indicator like a bot, do TA and FA as well. This is just an indicator, do not always rely on it. It requires experience. This indicator has different winrate in different timeframes. Set its value accordingly.
Monday Highlight (Crypto & Stocks)Hello Traders
This is a very simple indicator that will highlight the background vertically over every Monday for Crypto and Stock markets. I use this indicator in all my technical analysis as it lets me very quickly see where each week begins without being too distracting. It can be easily customizable to whatever color, transparency level and visibility you want. Because of the way closing times are processed in different markets I could not make a single indicator to include all markets, but check out my second Monday Highlight indicator for Futures, Forex and CFD markets.
Hope you find them useful and don't forget to add them to your "favorites" list for easy access.

CANDLE FILTER Todays scripts is based on my Pullback And Rally Candles with other meaningful candles such as Hammers and Dojis.
You can choose which Candles to show on the cart and if you want to candles to appear above or below a moving average.
If you follow my work, you may recognise some of these candles which I'm about to show you however these candles are 1) more refined and 2) has moving average filters.
Ive included a D,6H,1H Candle in this script as on different timeframes - each swing low on average has a different amount of bars within the swing low / swing high so the DPB and RD will only work on the Daily
//Pullback candle
This candle is very powerful when used with simple Price Action such as Market Structure//Demand zones and support zones. (((((WORKS BEST IN UPTRENDS AND BOTTOM OF RANGES)))))
Ive included a D,6H,1H Pullback Candle in this script as on different timeframes - each swing low on average has a different amount of bars within the swing low so the DPB will only work on the Daily
//DAILY PULLBACK (Swing Traders)
snapshot
//4H PULLBACK (Swing Traders)
snapshot
- this signal will produce more signals due to the swing low filter on the 4H
//1H PULLBACK
snapshot
- this signal has been refined due to too many candle displaying in weak areas
!!!IF YOU DONT WANT TO USE PULLBACKS DURING DOWNTRENDS THEN USE THE EMA FILTER TO TURN OFF THE PULLBACKS WHEN PRICE IS BELOW THE MOVING AVERAGE!!!
//Rally candle (My personal Favourite) (((((WORKS BEST IN DOWNTRENDS AND TOP OF RANGES)))))
This candle is very powerful when used with simple Price Action such as Market Structure//Supply zones and Resistance zones.
//DAILY RALLY(Swing Traders)
snapshot
//4H RALLY(Swing Traders)
snapshot
- this signal will produce more signals due to the swing high filter on the 4H
!!!IF YOU DONT WANT TO USE RALLIES DURING UPTRENDSTHEN USE THE EMA FILTER TO TURN OFF THE RALLIES WHEN PRICE IS ABOVE THE MOVING AVERAGE!!!
//POWERFUL DOJIS (INDECISION)
snapshot
We look for indecision in key areas to see if momentum is shifting. When combined with Pullbacks or Rallys - this will enhance the odds of a probably area.
//HAMMERS
snapshot
//MOVING AVERAGES
snapshot
Short EMA = 50
Long EMA = 200
This filter can be used when the market is trending - look out for rejections off the moving averages
Also you can chance the Short And Long EMA to choose which MA cross you want to use
snapshot
ALSO ALL THE CANDLES HAVE A ALERT CONDITIONS WHICH YOU CAN ACCESS - THIS WILL ALERT ANY CANDLE YOU CHOOSE
Please leave a like/comment on this post as this is much appreciated....
