RiskCraft - Advanced Risk Management SystemRiskCraft – Risk Intelligence Dashboard
Trade like you actually respect risk
"I know the setup looks good… but how much am I actually risking right now?"
RiskCraft is an open-source Pine Script v6 indicator that keeps risk transparent directly on the chart. It is not a signal generator; it is a risk desk that calculates size, frames volatility, and reminds you when your behaviour drifts away from the plan.
Core utilities
Calculates professional-style position sizing in real time.
Reads volatility and market regime before position size is confirmed.
Adjusts risk based on the trader’s emotional state and confidence inputs.
Maps session risk across Asian, London, and New York hours.
Draws exactly one stop line and one target line in the preferred direction.
Provides rotating education tips plus contextual warnings when risk escalates.
It is intentionally conservative and keeps you in the game long enough for any separate entry logic to matter.
---
Chart layout checklist
Use a clean chart on a liquid symbol (e.g., AMEX:SPY or major FX pairs).
Main RiskCraft dashboard placed on the right edge.
Session Risk box on the left with UTC time visible.
Floating risk badge above price.
Stop/target guide lines enabled.
Education panel visible in the bottom-right corner.
---
1. On-chart components
Right-side dashboard : account risk %, position size/value, stop, target, risk/reward, regime, trend strength, emotional state, behavioural score, correlation, and preferred trade direction.
Session Risk box : highlights active session (Asian, London, NY), current UTC time, and risk label (High/Med/Low) per session.
Floating risk badge : keeps actual account risk percent visible with colour-coded wording from Ultra Cautious to Very Aggressive.
Stop/target lines : exactly one dashed stop and one dashed target aligned with the preferred bias.
Education panel : rotates core principles and AI-style warnings tied to volatility, risk %, and behaviour flags.
---
2. Volatility engine – ATR with context 📈
atr = ta.atr(atrLength)
atrPercent = (atr / close) * 100
atrSMA = ta.sma(atr, atrLength)
volatilityRatio = atr / atrSMA
isHighVol = volatilityRatio > volThreshold
ATR vs ATR SMA shows how wild price is relative to recent history.
Volatility ratio above the threshold flips isHighVol , which immediately trims risk.
An ATR percentile rank over the last 100 bars indicates calm versus chaotic regimes.
Daily ATR sampling via request.security() gives higher time-frame context for intraday sessions.
When volatility spikes the script dials position size down automatically instead of cheering for maximum exposure.
---
3. Market regime radar – Danger or Drift 🌊
ema20 = ta.ema(close, 20)
ema50 = ta.ema(close, 50)
ema200 = ta.ema(close, 200)
trendScore = (close > ema20 ? 1 : -1) +
(ema20 > ema50 ? 1 : -1) +
(ema50 > ema200 ? 1 : -1)
= ta.dmi(14, 14)
Regimes covered:
Danger : high volatility with weak trend.
Volatile : volatility elevated but structure still directional.
Choppy : low ADX and noisy action.
Trending : directional flows without extreme volatility.
Mixed : anything between.
Each regime maps to a 1–10 risk score and a multiplier that feeds the final position size. Danger and Choppy clamp size; Trending restores normal risk.
---
4. Behaviour engine – trader inputs matter 🧠
You provide:
Emotional state : Confident, Neutral, FOMO, Revenge, Fearful.
Confidence : slider from 1 to 10.
Toggle for behavioural adjustment on/off.
Behind the scenes:
Each state triggers an emotional multiplier .
Confidence produces a confidence multiplier .
Combined they form behavioralFactor and a 0–100 Behavioural Score .
High-risk emotions or low conviction clamp the final risk. Calm inputs allow normal size. The dashboard prints both fields to keep accountability on-screen.
---
5. Correlation guardrail – avoid stacking identical risk 📊
Optional correlation mode compares the active symbol to a reference (default AMEX:SPY ):
corrClose = request.security(correlationSymbol, timeframe.period, close)
priceReturn = ta.change(close) / close
corrReturn = ta.change(corrClose) / corrClose
correlation = calcCorrelation()
Absolute correlation above the threshold applies a correlation multiplier (< 1) to reduce size.
Dashboard row shows the live correlation and reference ticker.
When disabled, the row simply echoes the current symbol, keeping the table readable.
---
6. Position sizing engine – heart of the script 💰
baseRiskAmount = accountSize * (baseRiskPercent / 100)
adjustedRisk = baseRiskAmount * behavioralFactor *
regimeAdjustment * volAdjustment *
correlationAdjustment
finalRiskAmount = math.min(adjustedRisk,
accountSize * (maxRiskCap / 100))
stopDistance = atr * atrStopMultiplier
takeProfit = atr * atrTargetMultiplier
positionSize = stopDistance > 0 ? finalRiskAmount / stopDistance : 0
positionValue = positionSize * close
Outputs shown on the dashboard:
Position size in units and value in currency.
Actual risk % back on account after adjustments.
Risk/Reward derived from ATR-based stop and target.
---
7. Intelligent trade direction – bias without signals 🎯
Direction score ingredients:
EMA stack alignment.
Price versus EMA20.
RSI momentum relative to 50.
MACD line vs signal.
Directional Movement (DI+/DI–).
The resulting Trade Direction row prints LONG, SHORT, or NEUTRAL. No orders are generated—this is guidance so you only risk capital when the structure supports it.
---
8. Stop/target guide lines – two lines only ✂️
if showStopLines
if preferLong
// long stop below, target above
else if preferShort
// short stop above, target below
Lines refresh each bar to keep clutter low.
When the direction score is neutral, no lines appear.
Use them as visual anchors, not auto-orders.
---
9. Session Risk map – global volatility clock 🌍
Tracks Asian, London, and New York windows via UTC.
Computes average ATR per session versus global ATR SMA.
Labels each session High/Med/Low and colours the cells accordingly.
Top row shows the active session plus current UTC time so you always know the regime you are trading.
One glance tells you whether you are trading quiet drift or the part of the day that hunts stops.
---
10. Floating risk badge – honesty above price 🪪
Text ranges from Ultra Cautious through Very Aggressive.
Colour matches the risk palette inputs (High/Med/Low).
Updates on the last bar only, keeping historical clutter off the chart.
Account risk becomes impossible to ignore while you stare at price.
---
11. Education engine & warnings 📚
Rotates evergreen principles (risk 1–2%, journal trades, respect plan).
Triggers contextual warnings when volatility and risk % conflict.
Flags when emotional state = FOMO or Revenge.
Highlights sub-standard risk/reward setups.
When multiple danger flags stack, an AI-style warning overrides the tip text so you can course-correct before capital is exposed.
---
12. Alerts – hard guard rails 🚨
Excessive Risk Alert : actual risk % crosses custom threshold.
High Volatility Alert : ATR behaviour signals danger regime.
Emotional State Warning : FOMO or Revenge selected.
Poor Risk/Reward Alert : risk/reward drops below your standard.
All alerts reinforce discipline; none suggest entries or exits.
---
13. Multi-market behaviour 🕒
Intraday (1m–1h): session box and badge react quickly; ideal for scalpers needing constant risk context.
Higher time frames (1D–1W): dashboard shifts slowly, supporting swing planning.
Asset classes confirmed in validation: crypto majors, large-cap equities, indices, major FX pairs, and liquid commodities.
Risk logic is price-based, so it adapts across markets without bespoke tuning.
15. Key inputs & recommended defaults
Account Size : 10,000 (modify to match actual account; min 100).
Base Risk % : 1.0 with a Maximum Risk Cap of 2.5%.
ATR Period : 14, Stop Multiplier 2.0, Target Multiplier 3.0.
High Vol Threshold : 1.5 for ATR ratio.
Behavioural Adjustment : enabled by default; disable for fixed risk.
Correlation Check : optional; default symbol AMEX:SPY , threshold 0.7.
Display toggles : main dashboard, risk badge, session map, education panel, and stop lines can be individually disabled to reduce clutter.
16. Usage notes & limits
Indicator mode only; no automated entries or exits.
Trade history panel intentionally disabled (requires strategy context).
Correlation analysis depends on additional data requests and may lag slightly on illiquid symbols.
Session timing uses UTC; adjust expectations if you trade localized instruments.
HTF ATR sampling uses daily data, so bar replay on lower charts may show brief data gaps while HTF loads.
What does everyone think RISK really means?
Cryptomarket

Structure Analysis + Hammer Alert# Structure Resistance + Hammer Alert
## 📊 Indicator Overview
This indicator integrates Structure Breakout Analysis with Candlestick Pattern Recognition, helping traders identify market trend reversal points and strong momentum signals. Through visual markers and background colors, you can quickly grasp the bullish/bearish market structure.
---
## 🎯 Core Features
### 1️⃣ Structure Resistance System
- Auto-plot Previous High/Low: Automatically marks key support/resistance based on pivot points
- Structure Breakout Detection: Shows "BULL" when price breaks above previous high, "BEAR" when breaking below previous low
- Trend Background Color: Green background for bullish structure, red background for bearish structure
### 2️⃣ Bullish Momentum Candles (Hammer Patterns)
Detects candles with long lower shadows, indicating strong buying pressure at lows:
- 💪Strong Bull (Bullish Hammer): Green marker, bullish close with significant lower shadow
- 💪Weak Bull (Bearish Hammer): Teal marker, bearish close but strong lower shadow
### 3️⃣ Bearish Momentum Candles (Inverted Hammer/Shooting Star)
Detects candles with long upper shadows, indicating strong selling pressure at highs:
- 💪Weak Bear (Bullish Inverted Hammer): Orange marker, bullish close but significant upper shadow
- 💪Strong Bear (Shooting Star): Red marker, bearish close with significant upper shadow
### 4️⃣ Smart Marker Sizing
Markers automatically adjust size based on current trend:
- With-Trend Signals: Larger markers (e.g., hammer in bullish trend)
- Counter-Trend Signals: Smaller markers (e.g., shooting star in bullish trend)
- Neutral Trend: Medium-sized markers
---
## ⚙️ Parameter Settings
### Structure Resistance Parameters
- Swing Length: Default 5, higher values = clearer structure but fewer signals
- Show Lines/Labels: Toggle on/off options
### Bullish Momentum (Hammer) Parameters
- Lower Shadow/Body Ratio: Default 2.0, lower shadow must be 2x body size
- Upper Shadow/Body Ratio Limit: Default 0.2, upper shadow cannot be too long
- Body Position Ratio: Default 2.0, ensures body is at the top of candle
### Bearish Momentum (Inverted Hammer) Parameters
- Upper Shadow/Body Ratio: Default 2.0, upper shadow must be 2x body size
- Lower Shadow/Body Ratio Limit: Default 0.2, lower shadow cannot be too long
- Body Position Ratio: Default 2.0, ensures body is at the bottom of candle
### Filter & Display Settings
- Minimum Body Size: Filters out doji-like candles with tiny bodies
- Pattern Type Toggles: Show/hide different pattern types individually
- Background Transparency: Adjust background color intensity (higher = more transparent)
- Label Distance: Adjust marker distance from candles
---
## 📈 Usage Guidelines
### Trading Signal Interpretation
**Long Signals (Strongest to Weakest):**
1. Bullish Structure + Bullish Hammer (💪Strong Bull) → Strongest long signal
2. Bullish Structure + Bearish Hammer (💪Weak Bull) → Secondary long signal
3. Bearish Structure + Hammer → Potential reversal signal
**Short Signals (Strongest to Weakest):**
1. Bearish Structure + Shooting Star (💪Strong Bear) → Strongest short signal
2. Bearish Structure + Bullish Inverted Hammer (💪Weak Bear) → Secondary short signal
3. Bullish Structure + Shooting Star → Potential reversal signal
### Practical Tips
✅ Trend Following: Prioritize large marker signals (aligned with trend)
✅ Structure Confirmation: Wait for structure breakout before entry to avoid false breaks
✅ Multiple Timeframes: Confirm trend direction with higher timeframes
⚠️ Counter-Trend Caution: Small marker signals (counter-trend) require stricter risk management
---
## 🔔 Alert Setup
This indicator provides 9 alert conditions:
- Individual Patterns: Bullish Hammer, Bearish Hammer, Bullish Inverted Hammer, Shooting Star
- Combined Signals: Bullish Momentum, Bearish Momentum, Bull/Bear Momentum
- Structure Breakouts: Bullish Structure Break, Bearish Structure Break
---
## 💡 FAQ
**Q: Why do hammers sometimes appear without markers?**
A: Check "Minimum Body Size" setting - the candle body may be too small and filtered out
**Q: Too many or too few markers?**
A: Adjust "Lower Shadow/Body Ratio" or "Upper Shadow/Body Ratio" parameters - higher ratios = stricter conditions
**Q: How to see only the strongest signals?**
A: Disable "Bearish Hammer" and "Bullish Inverted Hammer", keep only "Bullish Hammer" and "Shooting Star"
**Q: Can it be used on all timeframes?**
A: Yes, but recommended for 15-minute and higher timeframes - shorter timeframes have more noise
---
## 📝 Disclaimer
⚠️ This indicator is a supplementary tool and should be used with other technical analysis methods
⚠️ Past performance does not guarantee future results - always practice proper risk management
⚠️ Recommended to test on demo account before live trading
---
**Version:** Pine Script v6
**Applicable Markets:** Stocks, Futures, Cryptocurrencies, and all markets

Hash SupertrendHash Supertrend is a visually enhanced Supertrend-based indicator designed by Hash Capital Research, tuned specifically for crypto trend trading on Solana (SOL) and Bitcoin (BTC). It combines institutional-style color coding, an optional session time filter, and production-ready alerts for systematic and discretionary traders alike.
What This Indicator Is
Hash Supertrend is a trend-following volatility band indicator built on TradingView’s native ta.supertrend() function.
It’s optimized and visually styled for:
High-volatility crypto pairs (especially SOL/USDT, SOL/USD, BTC/USDT, BTC/USD)
Timeframes typically used by crypto traders (from 5m scalping to 4H swing and 1D trend following)
The script is an indicator, not a strategy:
It does not place trades or show backtest results.
It provides clear trend states, flips, and alerts that you can plug into your own execution stack or manual trading.
Key Features
✅ Tuned for Crypto (Solana & Bitcoin)
Parameters are chosen to respond well to the volatility profile of SOL and BTC, reducing noise while still catching strong moves.
✅ Non-repainting Supertrend Core
Uses TradingView’s built-in ta.supertrend — values may move intrabar as the bar forms, but once a bar closes, the historical line and signals do not repaint.
✅ Fluorescent Trend Visualization
Bright green for bullish phases
Bright red for bearish phases
Adaptive color intensity based on user setting
✅ Glow Layer & Trend Zones
Glow effect around the Supertrend line for instant visual recognition
Optional filled zones between price and line for “trend cloud” style visualization
✅ Time Filter (Session Control)
Option to only mark signals during specific hours for those wanting to integrate with webhooks
Designed for traders who avoid certain sessions (e.g., low-liquidity hours)
✅ Signal Dots & Alerts
Tiny green dots for bullish flips
Tiny red dots for bearish flips
Professional, preconfigured alerts for:
Long Entry
Short Entry
Any Trend Change
Filtered signals outside trading hours (for monitoring only)
The core logic is built on:
ATR Length (ATR Length) Default: 16
Lower values (7–10): more sensitive, more signals, more noise
Higher values (12–20): smoother, fewer but stronger trend signals
Factor (Factor) Default: 3.11
Lower values (1.5–2.5): tighter bands, earlier entries, higher whipsaws
Higher values (3.0–4.0+): wider bands, later entries, stronger trend confirmation
The indicator reads direction from ta.supertrend and classifies:
Bullish Trend: direction < 0
Bearish Trend: direction > 0
A trend flip happens when direction changes sign:
longSignal: Supertrend flips from above price to below price (bearish → bullish)
shortSignal: Supertrend flips from below price to above price (bullish → bearish)

ATM PROThe world’s strongest indicator that combines multiple indicators together, providing you with entry points, targets, and stop-loss levels with extreme accuracy. You can adjust its inputs to suit Forex and crypto pairs according to your needs. It contains these tools, and you can modify them based on your requirements.
المؤشر الاقوى عالميا الذي جمع عدة مؤشرات معا , من خلاله سيعطيك نقاط ( دخول واهداف وايقاف خسارة ) بدقة متناهية وتستطيع ان تعدل المدخلات ليتناسب مع ازواج الفوركس والكريبتو بشكل يتناسب مع ما تحتاجه
يحتوي على هذه الادوات ويمكنك تعديلها حسب متطلباتك
SHORT EMA
LONG EMA
TREND EMA
MACD SHORT
MACD LONG
MACD SIGNAL
RSI LENGTH
ATR LENGTH
VOLUME MULTIPLIER
ATR TARGET 1.2.3.4.5
STOP LOSS MULTIPLIER
BY ATM TEAM

Myfxschool-HeatWave V25Introducing the MyFXSchool Leading Indicator™, a next-generation market prediction tool designed exclusively for traders who want accuracy, clarity, and early trend identification. Built using advanced price-action logic, institutional order-flow concepts, and dynamic volatility algorithms, this indicator gives you a true leading advantage—not just lagging signals.

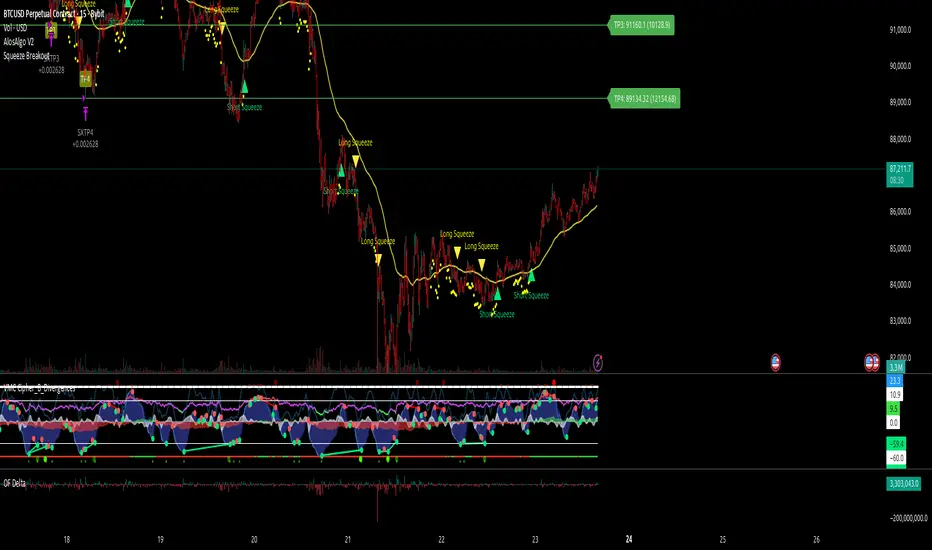
AlosAlgo V2 (BETA)— V2 BETA —
V2 – 2025-11-21 (Update)
• Rebuilt the core signal engine to remove repainting – higher-timeframe Heikin Ashi / Renko now use confirmed bars only for more stable signals & alerts.
• Added Trend Filter MA so longs are only taken above the MA and shorts only below (optional).
• Added MACD momentum filter and Price Action filter (Higher Low for longs, Lower High for shorts) to cut a lot of chop.
• Introduced a loss-streak “circuit breaker” – after X consecutive losing trades the strategy pauses for a set number of bars.
• New TP/SL engine with 2 modes: ATR-based or Fixed % moves, with 4 staged TPs plus an optional runner and break-even SL after TP2.
• Cleaned up TP/SL lines & labels so levels are fixed per trade and easier to read.
• General refactor for more realistic backtests, better live behaviour and easier parameter tuning compared to V1.
ABOUT
AlosAlgo V2 is a multi-timeframe trend + momentum strategy designed for BTC and other high-liquidity markets. It takes directional bias from a higher timeframe, then filters that bias with volatility, momentum and simple price-action structure before it ever opens a trade.
Purely rule-based, no AI / Bayesian / ML.
Core idea
– Use higher-timeframe structure for direction.
– Only trade when trend, momentum and basic price action agree.
– Manage exits with multiple TPs, an optional runner and a hard SL so risk is defined from the start.
Setups
Two main engines:
• Open/Close – Higher-timeframe Heikin Ashi body direction (close vs open) as the core trend signal.
• Renko – ATR-based Renko feed with EMA cross (fast vs slow) as the core trend signal.
Classic sideways filters (ATR + RSI) can be layered on top if you want to only trade in trending or ranging conditions.
Filters added in V2
• Trend Filter MA – Longs only above the MA, shorts only below (length configurable).
• Momentum Filter – Optional MACD filter; only takes longs when MACD is bullish and shorts when MACD is bearish.
• Price Action Filter – Optional HL/LH logic using pivots: longs after a Higher Low, shorts after a Lower High.
• Loss-Streak Circuit Breaker – After N losing trades in a row, the strategy pauses entries for a set number of bars to avoid bad regimes / tilt.
Risk & exits
Two TP/SL modes:
• ATR mode – SL and TP1–TP4 based on ATR at entry (stopFactor / profitFactor).
• Fixed % mode – SL and TP1–TP4 defined as % moves from entry.
On entry the strategy:
• Opens a single position.
• Places 4 staged TPs (TP1–TP4) with user-defined % sizing.
• Optionally leaves a “runner” managed only by SL and trend changes.
• Can move SL to break-even automatically after TP2 (toggle).
All TP/SL levels are locked at entry and drawn on the chart with labels so you can see exactly what the trade is trying to do.
Non-repainting behaviour
V2 is refactored to avoid the repainting behaviour that V1 used. Higher-timeframe and Renko data are taken from confirmed bars only, and entries are based on state (e.g. > / <) instead of repaint-prone crosses. Backtests are much closer to what you’ll see live, and alerts line up with executed trades more reliably.
How to use (suggested defaults)
• Setup: Open/Close
• TPSType: Fixed %
• Trend Filter: ON
• Momentum Filter: ON
• Price Action Filter: ON
• Sideways Filter: No Filtering
Then tweak TP/SL distances and filters per asset + timeframe, and forward-test before sizing up.
Disclaimer
This is not financial advice, not a guarantee of profit and not a “set and forget” money printer. Always forward-test, paper trade and tune risk before using real capital or automation. Markets change – this is a tool, not a promise.
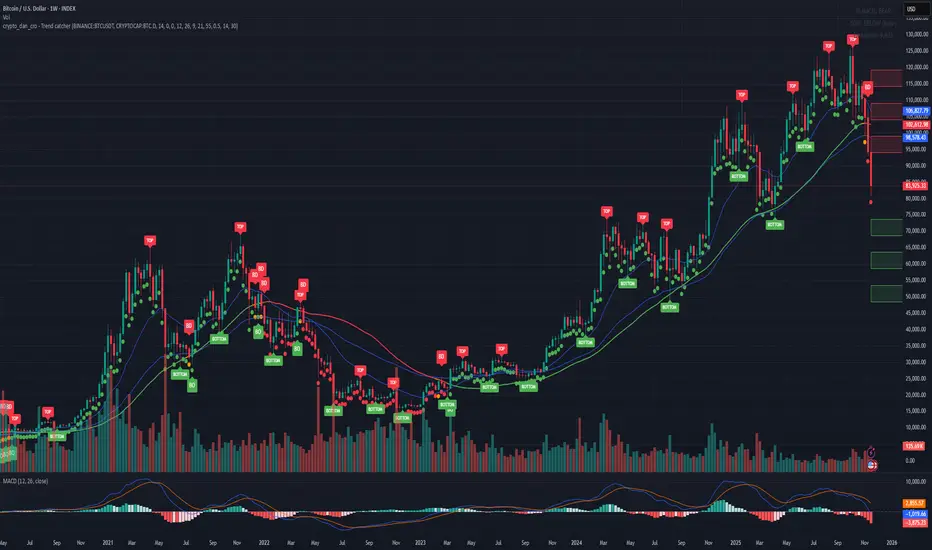
Crypto_Dan - Trend catcher - All projectsCrypto_dan_cro - Trend catcher indicator
This indicator will show you the Macro trend - ALL PROJECTS.
DOTS
Red dots - mean we are in Bearish part of the cycle where prices are expected to drop further
Yellow dots - mean we are in the area where either breakout or breakdown are possible
Green dots - mean we are in a Bullish part of the cycle, where prices are expected to raise
SMA LINE
Crossing below line, will make line red - bearmarket
Crossing above line, will make line green - bullmarket
Trading on the line, will make line yellow - direction still not decided
TOP & BOTTOM
Top - showing you tops
Bottom - showing you bottoms
BREAKOUTS & BREAKDOWNS
BO - BreakOut - showing you change in trend, and prices are expected to raise
BD - BreakDown - showing you change in trend, and prices are expected to drop.
SUPPORT & RESISTANCE
Red squares on the last candle - showing you 3 closest resistances (on every timeframe)
Green squares on the last candle - showing you 3 closest supports (on every timeframe)
Crypto markets are volatile, if you choose to use this indicator in trading, you are doing it on your own. Crypto_dan_cro is not responsible for any profits or losses created by using this Indicator.
Good luck ;)
If you want to get this indicator for free, follow me on
X handle: @crypto_dan_cro
Turn notifications on and engage with my posts

Crypto_dan_cro - Trend catcher - BTC OnlyCrypto_dan_cro - Trend catcher indicator
This indicator will show you the Macro trend BTC ONLY.
DOTS
Red dots - mean we are in Bearish part of the cycle where prices are expected to drop further
Yellow dots - mean we are in the area where either breakout or breakdown are possible
Green dots - mean we are in a Bullish part of the cycle, where prices are expected to raise
SMA LINE
Crossing below line, will make line red - bearmarket
Crossing above line, will make line green - bullmarket
Trading on the line, will make line yellow - direction still not decided
TOP & BOTTOM
Top - showing you tops
Bottom - showing you bottoms
BREAKOUTS & BREAKDOWNS
BO - BreakOut - showing you change in trend, and prices are expected to raise
BD - BreakDown - showing you change in trend, and prices are expected to drop.
SUPPORT & RESISTANCE
Red squares on the last candle - showing you 3 closest resistances (on every timeframe)
Green squares on the last candle - showing you 3 closest supports (on every timeframe)
Crypto markets are volatile, if you choose to use this indicator in trading, you are doing it on your own. Crypto_dan_cro is not responsible for any profits or losses created by using this Indicator.
Good luck ;)
If you want to get this indicator for free, follow me on
X handle: @crypto_dan_cro
Turn notifications on and engage with my posts
NAMI Lite │ Zero-Repaint Momentum Wave + Reg Divergences (FREE)
NAMI Lite │ 100% Zero-Repaint Momentum Wave + Divergences (FREE)
The only zero-repaint, zero-lag momentum indicator that calls reversals hours early — even the free version beats all paid indicators.
No repainting on closed bars • Instant wave flips • Clean regular divergences • Money Flow confluence
Zero-Repaint Momentum Wave – CCI-based oscillator with real-time color flips (no lag, no lies)
Regular Bull/Bear Divergences – Faded lines on confirmed pivots only
Money Flow Oscillator – Volume-weighted filled areas for extra confirmation
This Lite version is intentionally limited — powerful enough to replace monthly subscriptions, but missing the pro features that make trading effortless.
Upgrade to Full NAMI Suite (One-Time Payment – Cancel Recurring Fees Forever):
Hidden Divergences with Divergence LABELS (catch 70% more massive moves)
200-Color Stochastic Heat Ribbon (gorgeous visual heatmaps)
True VWAP Oscillator + multi-source options
Buy/Sell Dots + Full Alerts (divergence, money flow, wave flips)
Full and Complete Customization (themes, lengths, colors)
Plus our other toolkits: TRAVIS, SMC Pro, and all future tools free
SEE IMAGE FOR COMPLETE NAMI VIEW
Over 800 traders already switched and saved thousands.

Crypto Index Price# Crypto Index Price - Indicator Description
## 📊 What is this indicator?
**Crypto Index Price** is an indicator for creating your own cryptocurrency index based on an equal-weighted portfolio. It allows you to track the overall dynamics of the cryptocurrency market through a composite index of selected assets.
## 🎯 Key Features
- **Up to 20 assets in the index** — create an index from any trading pairs
- **Equal-weighted methodology** — each asset has the same weight in the index
- **Moving average** — optional trend filter for the index
- **Flexible visualization settings** — customizable colors and line thickness
## 📈 How to Use
The indicator is displayed in a separate pane below the chart and shows:
1. **Blue line** — crypto index value
2. **Orange line** (optional) — moving average of the index
### Trading Applications:
- **Identify overall market trend** — if the index is rising, most coins are in an uptrend
- **Divergences** — divergence between your asset and the index may signal local opportunities
- **Signal confirmation** — use the index to confirm trading decisions on individual coins
- **Market condition filter** — trade longs when index is above MA, shorts when below
## ⚙️ Settings
### Assets (Symbols)
- **Asset 1-10** — main cryptocurrencies (default: BTC, ETH, BNB, SOL, XRP, ADA, AVAX, LINK, DOGE, TRX)
- **Asset 11-20** — additional slots for index expansion
### Visual Parameters
- **Index line color** — main line color (default: blue)
- **Line width** — from 1 to 5 pixels
- **Show moving average** — enable/disable MA
- **MA period** — moving average calculation period (default: 20)
- **MA color** — moving average line color (default: orange)
## 💡 Recommendations
- For a top coins index, use 5-10 largest cryptocurrencies by market cap
- For an altcoin index, add medium and small coins from your sector
- Use MA to filter false signals and identify the global trend
- Compare individual asset behavior with the index to find anomalies
## ⚠️ Important
The indicator uses equal-weighted methodology — each coin contributes equally regardless of price or market cap. This differs from cap-weighted indices and may provide a different market perspective.
---
*This indicator is intended for analysis and is not trading advice. Always conduct your own analysis before making trading decisions.*
---

EMA 21 Big Candle SetupKey Features:
EMA 21 plotted in yellow
Detects big candles that are 1.5x larger than the average candle size (using ATR)
Bullish Setup: Green triangle when a big bullish candle crosses above EMA 21
Bearish Setup: Red triangle when a big bearish candle crosses below EMA 21
Visual feedback: Big candles are highlighted with transparent colors
Info box: Shows current EMA value, candle size, and whether it's a big candle

Universal Regime Alpha Thermocline StrategyCurrents settings adapted for BTCUSD Daily timeframe
This description is written to comply with TradingView House Rules and Script Publishing Rules. It is self contained, in English first, free of advertising, and explains originality, method, use, defaults, and limitations. No external links are included. Nothing here is investment advice.
0. Publication mode and rationale
This script is published as Protected . Anyone can add and test it from the Public Library, yet the source code is not visible.
Why Protected
The engine combines three independent lenses into one regime score and then uses an adaptive centering layer and a thermo risk unit that share a common AAR measure. The exact mapping and interactions are the result of original research and extensive validation. Keeping the implementation protected preserves that work and avoids low effort clones that would fragment feedback and confuse users.
Protection supports a single maintained build for users. It reduces accidental misuse of internal functions outside their intended context which might lead to misleading results.
1. What the strategy does in one paragraph
Universal Regime Alpha Thermocline builds a single number between zero and one that answers a practical question for any market and timeframe. How aligned is current price action with a persistent directional regime right now. To answer this the script fuses three views of the tape. Directional entropy of up versus down closes to measure unanimity.
Convexity drift that rewards true geometric compounding and penalizes drag that comes from chop where arithmetic pace is high but growth is poor.
Tail imbalance that counts decisive bursts in one direction relative to typical bar amplitude. The three channels are blended, optionally confirmed by a higher timeframe, and then adaptively centered to remove local bias. Entries fire when the score clears an entry gate. Exits occur when the score mean reverts below an exit gate or when thermo stops remove risk. Position size can scale with the certainty of the signal.
2. Why it is original and useful
It mixes orthogonal evidence instead of leaning on a single family of tools. Many regime filters depend on moving averages or volatility compression. Here we add an information view from entropy, a growth view from geometric drift, and a structural view from tail imbalance.
The drift channel separates growth from speed. Arithmetic pace can look strong in whipsaw, yet geometric growth stays weak. The engine measures both and subtracts drag so that only sequences with compounding quality rise.
Tail counting is anchored to AAR which is the average absolute return of bars in the window. This makes the threshold self scaling and portable across symbols and timeframes without hand tuned constants.
Adaptive centering prevents the score from living above or below neutral for long stretches on assets with strong skew. It recovers neutrality while still allowing persistent regimes to dominate once evidence accumulates.
The same AAR unit used in the signal also sets stop distance and trail distance. Signal and risk speak the same language which makes the method portable and easier to reason about.
3. Plain language overview of the math
Log returns . The base series is r equal to the natural log of close divided by the previous close. Log return allows clean aggregation and makes growth comparisons natural.
Directional entropy . Inside the lookback we compute the proportion p of bars where r is positive. Binary entropy of p is high when the mix of up and down closes is balanced and low when one direction dominates. Intensity is one minus entropy. Directional sign is two times p minus one. The trend channel is zero point five plus one half times sign times intensity. It lives between zero and one and grows stronger as unanimity increases.
Convexity drift with drag . Arithmetic mean of r measures pace. Geometric mean of the price ratio over the window measures compounding. Drag is the positive part of arithmetic minus geometric. Drift raw equals geometric minus drag multiplier times drag. We then map drift through an arctangent normalizer scaled by AAR and a nonlinearity parameter so the result is stable and remains between zero and one.
Tail imbalance . AAR equals the average of the absolute value of r in the window. We count up tails where r is greater than aar_mult times AAR and down tails where r is less than minus aar_mult times AAR. The imbalance is their difference over their total, mapped to zero to one. This detects directional impulse flow.
Fusion and centering . A weighted average of the three channels yields the raw score. If a higher timeframe is requested, the same function is executed on that timeframe with lookahead off and blended with a weight. Finally we subtract a fraction of the rolling mean of the score to recover neutrality. The result is clipped to the zero to one band.
4. Entries, exits, and position sizing
Enter long when score is strictly greater than the entry gate. Enter short when score is strictly less than one minus the entry gate unless direction is restricted in inputs.
Exit a long when score falls below the exit gate. Exit a short when score rises above one minus the exit gate.
Thermo stops are expressed in AAR units. A long uses the maximum of an initial stop sized by the entry price and AAR and a trail stop that references the running high since entry with a separate multiple. Shorts mirror this with the running low. If the trail is disabled the initial stop is active.
Cooldown is a simple bar counter that begins when the position returns to flat. It prevents immediate re entry in churn.
Dynamic position size is optional. When enabled the order percent of equity scales between a floor and a cap as the score rises above the gate for longs or below the symmetric gate for shorts.
5. Inputs quick guide with recommended ranges
Every input has a tooltip in the script. The same guidance appears here for fast reading.
Core window . Shared lookback for entropy, drift, and tails. Start near 80 on daily charts. Try 60 to 120 on intraday and 80 to 200 for swing.
Entry threshold . Typical range 0.55 to 0.65 for trend following. Faster entries 0.50 to 0.55.
Exit threshold . Typical range 0.35 to 0.50. Lower holds longer yet gives back more.
Weight directional entropy . Starting value 0.40. Raise on markets with clean persistence.
Weight convexity drift . Starting value 0.40. Raise when compounding quality is critical.
Weight tail imbalance . Starting value 0.20. Raise on breakout prone markets.
Tail threshold vs AAR . Typical range 1.0 to 1.5 to count decisive bursts.
Drag penalty . Typical range 0.25 to 0.75. Higher punishes chop more.
Nonlinearity scale . Typical range 0.8 to 2.0. Larger compresses extremes.
AAR floor in percent . Typical range 0.0005 to 0.002 for liquid instruments. This stabilizes the math during quiet regimes.
Adaptive centering . Keep on for most symbols. Center strength 0.40 to 0.70.
Confirm timeframe optional . Leave empty to disable. If used, try a multiple between three and five of the chart timeframe with a blend weight near 0.20.
Dynamic position size . Enable if you want size to reflect certainty. Floor and cap define the percent of equity band. A practical band for many accounts is 0.5 to 2.
Cooldown bars after exit . Start at 3 on daily or slightly higher on shorter charts.
Thermo stop multiple . Start between 1.5 and 3.0 on daily. Adjust to your tolerance and symbol behavior.
Thermo trailing stop and Trail multiple . Trail on locks gains earlier. A trail multiple near 1.0 to 2.0 is common. You can keep trail off and let the exit gate handle exits.
Background heat opacity . Cosmetic. Set to taste. Zero disables it.
6. Properties used on the published chart
The example publication uses BTCUSD on the daily timeframe. The following Properties and inputs are used so everyone can reproduce the same results.
Initial capital 100000
Base currency USD
Order size 2 percent of equity coming from our risk management inputs.
Pyramiding 0
Commission 0.05 percent
Slippage 10 ticks in the publication for clarity. Users should introduce slippage in their own research.
Recalculate after order is filled off. On every tick off.
Using bar magnifier on. On bar close on.
Risk inputs on the published chart. Dynamic position size on. Size floor percent 2. Size cap percent 2. Cooldown bars after exit 3. Thermo stop multiple 2.5. Thermo trailing stop off. Trail multiple 1.
7. Visual elements and alerts
The score is painted as a subtle dot rail near the bottom. A background heat map runs from red to green to convey regime strength at a glance. A compact HUD at the top right shows current score, the three component channels, the active AAR, and the remaining cooldown. Four alerts are included. Long Setup and Short Setup on entry gates. Exit Long by Score and Exit Short by Score on exit gates. You can disable trading and use alerts only if you want the score as a risk switch inside a discretionary plan.
8. How to reproduce the example
Open a BTCUSD daily chart with regular candles.
Add the strategy and load the defaults that match the values above.
Set Properties as listed in section 6.(they are set by default) Confirm that bar magnifier is on and process on bar close is on.
Run the Strategy Tester. Confirm that the trade count is reasonable for the sample. If the count is too low, slightly lower the entry threshold or extend history. If the count is excessively high, raise the threshold or add a small cooldown.
9. Practical tuning recipes
Trend following focus . Raise the entry threshold toward 0.60. Raise the trend weight to 0.50 and reduce tail weight to 0.15. Keep drift near 0.35 to retain the growth filter. Consider leaving the trail off and let the exit threshold manage positions.
Breakout focus . Keep entry near 0.55. Raise tail weight to 0.35. Keep aar_mult near 1.3 so only decisive bursts count. A modest cooldown near 5 can reduce immediate false flips after the first burst bar.
Chop defense . Raise drag multiplier to 0.70. Raise exit threshold toward 0.48 to recycle capital earlier. Consider a higher cooldown, for example 8 to 12 on intraday.
Higher timeframe blend . On a daily chart try a weekly confirm with a blend near 0.20. On a five minute chart try a fifteen minute confirm. This moderates transitions.
Sizing discipline . If you want constant position size, set floor equal to cap. If you want certainty scaling, set a band like 0.5 to 2 and monitor drawdown behavior before widening it.
10. Strengths and limitations
Strengths
Self scaling unit through AAR makes the tool portable across markets and timeframes.
Blends evidence that target different failure modes. Unanimity, growth quality, and impulse flow rarely agree by chance which raises confidence when they align.
Adaptive centering reduces structural bias at the score level which helps during regime flips.
Limitations
In very quiet regimes AAR becomes small even with a floor. If your symbol is thin or gap prone, raise the floor a little to keep stops and drift mapping stable.
Adaptive centering can delay early breakout acceptance. If you miss starts, lower center strength or temporarily disable centering while you evaluate.
Tail counting uses a fixed multiple of AAR. If a market alternates between very calm and very violent weeks, a single aar_mult may not capture both extremes. Sweep this parameter in research.
The engine reacts to realized structure. It does not anticipate scheduled news or liquidity shocks. Use event awareness if you trade around releases.
11. Realism and responsible publication
No promises or projections of performance are made. Past results never guarantee future outcomes.
Commission is set to 0.05 percent per round which is realistic for many crypto venues. Adjust to your own broker or exchange.
Slippage is set at 10 in the publication . Introduce slippage in your own tests or use a percent model.
Position size should respect sustainable risk envelopes. Risking more than five to ten percent per trade is rarely viable. The example uses a fixed two percent position size.
Security calls use lookahead off. Standard candles only. Non standard chart types like Heikin Ashi or Renko are not supported for strategies that submit orders.
12. Suggested research workflow
Begin with the balanced defaults. Confirm that the trade count is sensible for your timeframe and symbol. As a rough guide, aim for at least one hundred trades across a wide sample for statistical comfort. If your timeframe cannot produce that count, complement with multiple symbols or run longer history.
Sweep entry and exit thresholds on a small grid and observe stability. Stability across windows matters more than the single best value.
Try one higher timeframe blend with a modest weight. Large weights can drown the signal.
Vary aar_mult and drag_mult together. This tunes the aggression of breakouts versus defense in chop.
Evaluate whether dynamic size improves risk adjusted results for your style. If not, set floor equal to cap for constancy.
Walk forward through disjoint segments and inspect results by regime. Bootstrapping or segmented evaluation can reveal sensitivity to specific periods.
13. How to read the HUD and heat map
The HUD presents a compact view. Score is the current fused value. Trend is the directional entropy channel. Drift is the compounding quality channel. Tail is the burst flow channel. AAR is the current unit that scales stops and the drift map. CD is the cooldown counter. The background heat is a visual aid only. It can be disabled in inputs. Green zones near the upper band show alignment among the channels. Muted colors near the mid band show uncertainty.
14. Frequently asked questions
Can I use this as a pure indicator . Yes. Disable entries by restricting direction to one side you will not trade and use the alerts as a regime switch.
Will it work on intraday charts . Yes. The AAR unit scales with bar size. You will likely reduce the core window and increase cooldown slightly.
Should I enable the adaptive trail . If you wish to lock gains sooner and accept more exits, enable it. If you prefer to let the exit gate do the heavy lifting, keep it off.
Why do I sometimes see a green background without a position . Heat expresses the score. A position also depends on threshold comparisons, direction mode, and cooldown.
Why is Order size set to one hundred percent if dynamic size is on . The script passes an explicit quantity percent on each entry. That explicit quantity overrides the property. The property is kept at one hundred percent to avoid confusion when users later disable dynamic sizing.
Can I combine this with other tools on my chart . You can, yet for publication the chart is kept clean so users and moderators can see the output clearly. In your private workspace feel free to add other context.
15. Concepts glossary
AAR . Average absolute return across the lookback. Serves as a unit for tails, drift scaling, and stops.
Directional entropy . A measure of uncertainty of up versus down closes. Low entropy paired with a directional sign signals unanimity.
Geometric mean growth . Rate that preserves the effect of compounding over many bars.
Drag . The positive difference between arithmetic pace and geometric growth. Larger drag often signals churn that looks active but fails to compound.
Thermo stops . Stops expressed in the same AAR unit as the signal. They adapt with volatility and keep risk and signal on a common scale.
Adaptive centering . A bias correction that recenters the fused score around neutral so the meter does not drift due to persistent skew.
16. Educational notice and risk statement
Markets involve risk. This publication is for education and research. It does not provide financial advice and it is not a recommendation to buy or sell any instrument. Use realistic costs. Validate ideas with out of sample testing and with conservative position sizing. Past performance never guarantees future results.
17. Final notes for readers and moderators
The goal of this strategy is clarity and portability. Clarity comes from a single score that reflects three independent features of the tape. Portability comes from self scaling units that respect structure across assets and timeframes. The publication keeps the chart clean, explains the math plainly, lists defaults and Properties used, and includes warnings where care is required. The code is protected so the implementation remains consistent for the community while the description remains complete enough for users to understand its purpose and for moderators to evaluate originality and usefulness. If you explore variants, keep them self contained, explain exactly what they contribute, publish in English first, and treat others with respect in the comments.
Load the strategy on BTCUSD daily with the defaults listed above and study how the score transitions across regimes. Then adjust one lever at a time. Observe how the trend channel, the drift channel, and the tail channel interact during starts, pauses, and reversals. Use the alerts as a risk switch inside your own process or let the built in entries and exits run if you prefer an automated study. The intent is not to promise outcomes. The intent is to give you a robust meter for regime strength that travels well across markets and helps you structure decisions with more confidence.
Thank you for your time to read all of this

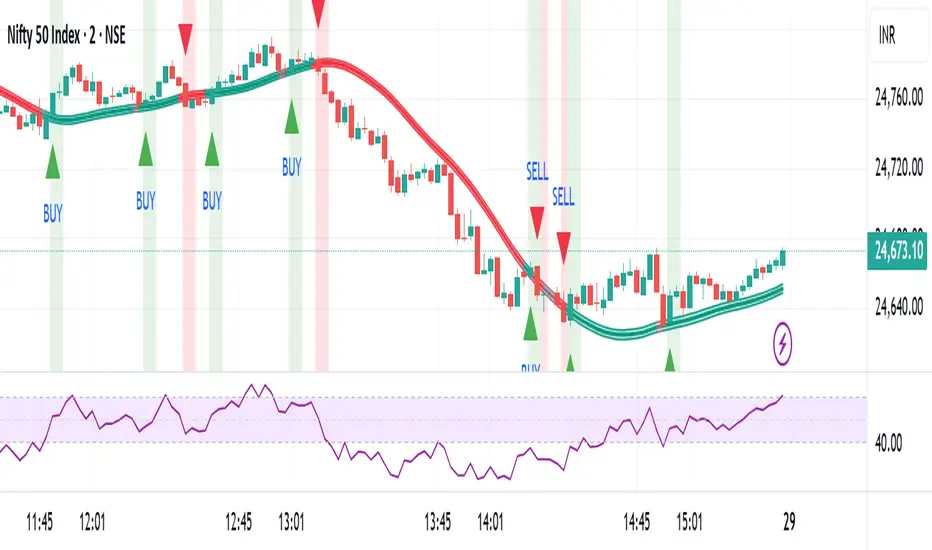
Algo Trading Signals - Buy/Sell System# 📊 Algo Trading Signals - Dynamic Buy/Sell System
## 🎯 Overview
**Algo Trading Signals** is a sophisticated intraday trading indicator designed for algorithmic traders and active day traders. This system generates precise buy and sell signals based on a dynamic box breakout strategy with intelligent position management, add-on entries, and automatic target adjustment.
The indicator creates a reference price box during a specified time window (default: 9:15 AM - 9:45 AM IST) and generates high-probability signals when price breaks out of this range with confirmation.
---
## ✨ Key Features
### 📍 **Smart Signal Generation**
- **Primary Entry Signals**: Clear buy/sell signals on confirmed breakouts above/below the reference box
- **Confirmation Bars**: Reduces false signals by requiring multiple bar confirmation before entry
- **Cooldown System**: Prevents overtrading with configurable cooldown periods between trades
- **Add-On Positions**: Automatically identifies optimal pullback entries for scaling into positions
### 📦 **Dynamic Reference Box**
- Creates a high/low range during your chosen time window
- Automatically updates after each successful trade
- Visual box display with color-coded boundaries (red=resistance, green=support)
- Mid-level reference line for market structure analysis
### 🎯 **Intelligent Position Management**
- **Automatic Target Calculation**: Sets profit targets based on average move distance
- **Add-On System**: Up to 3 additional entries on optimal pullbacks
- **Position Tracking**: Monitors active trades and remaining add-on capacity
- **Auto Box Shift**: Adjusts reference box after target hits for continued trading
### 📊 **Visual Clarity**
- **Color-Coded Labels**:
- 🟢 Green for BUY signals
- 🔴 Red for SELL signals
- 🔵 Blue for ADD-ON buys
- 🟠 Orange for ADD-ON sells
- ✓ Yellow for Target hits
- **TP Level Lines**: Dotted lines showing current profit targets
- **Hover Tooltips**: Detailed information on entry prices, targets, and add-on numbers
### 📈 **Real-Time Statistics**
Live performance dashboard showing:
- Total buy and sell signals generated
- Number of add-on positions taken
- Take profit hits achieved
- Current trade status (LONG/SHORT/None)
- Cooldown timer status
### 🔔 **Comprehensive Alerts**
Built-in alert conditions for:
- Primary buy entry signals
- Primary sell entry signals
- Add-on buy positions
- Add-on sell positions
- Buy take profit hits
- Sell take profit hits
---
## 🛠️ Configuration Options
### **Time Settings**
- **Box Start Hour/Minute**: Define when to begin tracking the reference range
- **Box End Hour/Minute**: Define when to lock the reference box
- **Default**: 9:15 AM - 9:45 AM (IST) - Perfect for Indian market opening range
### **Trade Settings**
- **Target Points (TP)**: Average move distance for profit targets (default: 40 points)
- **Breakout Confirmation Bars**: Number of bars to confirm breakout (default: 2)
- **Cooldown After Trade**: Bars to wait after closing position (default: 3)
- **Add-On Distance Points**: Minimum pullback for add-on entry (default: 40 points)
- **Max Add-On Positions**: Maximum additional positions allowed (default: 3)
### **Display Options**
- Toggle buy/sell signal labels
- Show/hide trading box visualization
- Show/hide TP level lines
- Show/hide statistics table
---
## 💡 How It Works
### **Phase 1: Box Formation (9:15 AM - 9:45 AM)**
The indicator tracks the high and low prices during your specified time window to create a reference box representing the opening range.
### **Phase 2: Breakout Detection**
After the box is locked, the system monitors for:
- **Bullish Breakout**: Price closes above box high for confirmation bars
- **Bearish Breakout**: Price closes below box low for confirmation bars
### **Phase 3: Signal Generation**
When confirmation requirements are met:
- Entry signal is generated with clear visual label
- Target price is calculated (Entry ± Target Points)
- Position tracking activates
- Cooldown timer starts
### **Phase 4: Position Management**
During active trade:
- **Add-On Logic**: If price pulls back by specified distance but stays within favorable range, additional entry signal fires
- **Target Monitoring**: Continuously checks if price reaches TP level
- **Box Adjustment**: After TP hit, box automatically shifts to new range for next opportunity
### **Phase 5: Trade Exit & Reset**
On target hit:
- Position closes with TP marker
- Statistics update
- Box repositions for next setup
- Cooldown activates
- System ready for next signal
---
## 📌 Best Use Cases
### **Ideal For:**
- ✅ Intraday breakout trading strategies
- ✅ Algorithmic trading systems (via alerts/webhooks)
- ✅ Opening range breakout (ORB) strategies
- ✅ Index futures (Nifty, Bank Nifty, Sensex)
- ✅ High-liquidity stocks with clear ranges
- ✅ Automated trading bots
- ✅ Scalping and day trading
### **Markets:**
- Indian Stock Market (NSE/BSE)
- Futures & Options
- Forex pairs
- Cryptocurrency (adjust timing for 24/7 markets)
- Global indices
---
## ⚙️ Integration with Algo Trading
This indicator is **algo-ready** and can be integrated with automated trading systems:
1. **TradingView Alerts**: Set up alert conditions for each signal type
2. **Webhook Integration**: Connect alerts to trading platforms via webhooks
3. **API Automation**: Use with brokers supporting TradingView integration (Zerodha, Upstox, Interactive Brokers, etc.)
4. **Signal Data Access**: All signals are plotted for external data retrieval
---
## 📖 Quick Start Guide
1. **Add Indicator**: Apply to your chart (works best on 1-5 minute timeframes)
2. **Configure Time Window**: Set your desired box formation period
3. **Adjust Parameters**: Tune confirmation bars, targets, and add-on settings to your trading style
4. **Set Alerts**: Create alert conditions for automated notifications
5. **Backtest**: Review historical signals to validate strategy performance
6. **Go Live**: Enable alerts and start receiving real-time trading signals
---
## ⚠️ Risk Disclaimer
This indicator is a **tool for analysis** and does not guarantee profits. Trading involves substantial risk of loss. Always:
- Use proper position sizing
- Implement stop losses (not included in this indicator)
- Test thoroughly before live trading
- Understand market conditions
- Never risk more than you can afford to lose
- Consider your risk tolerance and trading experience
**Past performance does not indicate future results.**
## 🔄 Version History
**v1.0** - Initial Release
- Dynamic box formation system
- Confirmed breakout signals
- Add-on position management
- Visual signal labels and statistics
- Comprehensive alert system
- Auto-adjusting target boxes
---
## 📞 Support & Feedback
If you find this indicator helpful:
- ⭐ Please leave a like/favorite
- 💬 Share your feedback in comments
- 📊 Share your results and improvements
- 🤝 Suggest features for future updates
---
## 🏷️ Tags
`breakout` `daytrading` `signals` `algo` `automated` `intraday` `ORB` `opening-range` `buy-sell` `scalping` `futures` `nifty` `banknifty` `algorithmic` `box-strategy`
*Remember: The best indicator is combined with proper risk management and trading discipline.* Use it at your own rist, not as financial advie

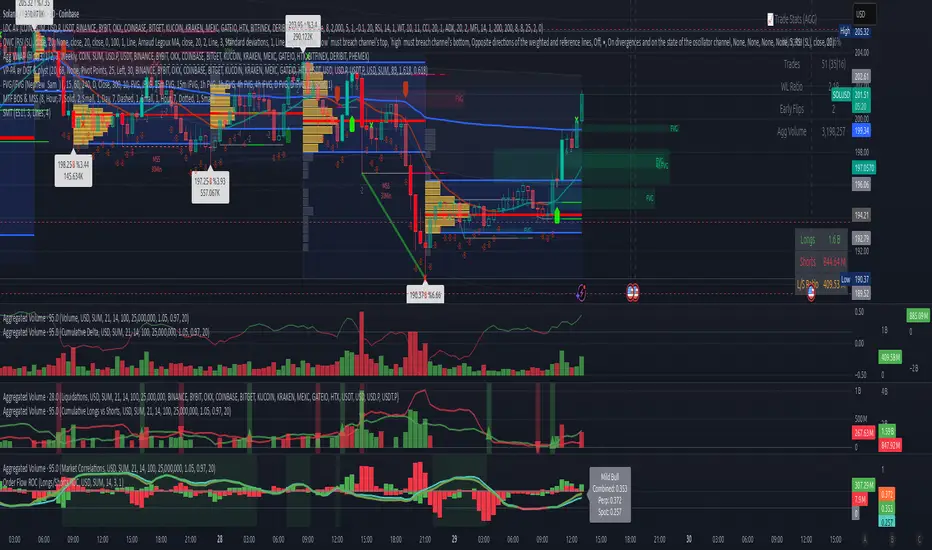
Volume Aggregated Spot & Futures -- Crypto (by plyst & more)📊 Volume Aggregated Spot & Futures - Enhanced Edition
🎯 Overview
Advanced volume aggregation indicator that combines spot and perpetual futures volume across the top 10 cryptocurrency exchanges. This enhanced version builds upon the original work by @HALDRO Project with optimized calculations and expanded functionality.
✨ Key Features
- 📈 Real-time aggregated volume from 10 major exchanges (Binance, Bybit, OKX, Coinbase, Bitget, KuCoin, Kraken, MEXC, Gate.io, HTX)
- 🔄 Multiple visualization modes: Volume, Delta, Cumulative Delta, Spot vs Perp analysis, Liquidations, OBV, and MFI
- 💱 Multi-currency support: Display volume in COIN, USD, or EUR
- 🎨 Clean, single-color bar chart showing total cumulative volume
- 📊 Multiple calculation methods: SUM, AVG, MEDIAN, VARIANCE
- 🎯 Separate spot (USDT, USD, USDC, etc.) and perpetual futures (.P contracts) tracking
🔧 Technical Improvements
✓ Corrected MFI formula for accurate money flow calculations
✓ Optimized volume aggregation logic with proper NA handling
✓ Support for 10 exchanges (up from 9)
✓ Streamlined codebase for better performance
✓ Updated perpetual contract naming conventions (.P format)
📖 Usage
Perfect for analyzing total market volume, identifying liquidation events, tracking buyer/seller pressure through delta analysis, and understanding the spot vs futures market dynamics.
🙏 Credits
Original concept and framework by @HALDRO Project. This version includes mathematical corrections, code optimizations, and expanded exchange support.
⚠️ Note
Aggregated volume is calculated from external exchange data using request.security(). Ensure your plan supports the necessary security calls for optimal performance.
Baseline Buy/Sell Alerts (v6) - FixedGood for indexes,metals and cryptos
Thanks Universe Thanks Angels

Multi-Exchange VWAP Aggregator (Crypto)Description:
This advanced VWAP indicator aggregates volume data from up to 9 cryptocurrency exchanges simultaneously, providing a more accurate volume-weighted average price than single-exchange VWAP calculations.
Key Features:
Multi-Exchange Aggregation - Combines volume from Binance, Coinbase, Bybit, Bitfinex, Bitstamp, Deribit, OKEx, Phemex, and FTX
Flexible Currency Pairs - Supports both spot (USD, USDT, EUR, USDC, BUSD, DAI) and perpetual futures contracts
Standard Deviation Bands - Includes customizable 1σ, 2σ, and 3σ bands for identifying overbought/oversold levels
Multiple Reset Periods - Daily, Weekly, Monthly, or Session-based VWAP calculations
Volume Calculation Options - Choose between SUM, AVG, MEDIAN, or VARIANCE for volume aggregation
Why Use This?
Traditional VWAP indicators only use volume from a single exchange, which can be misleading in fragmented crypto markets. This indicator provides a comprehensive market-wide VWAP by aggregating volume across major exchanges, giving you a more reliable benchmark for entries, exits, and institutional price levels.
Perfect for traders who want to see where the real volume-weighted price sits across the entire crypto market, not just one exchange.

Crypto OI AgregatedCrypto OI Aggregated — Open Interest Aggregator for Crypto Exchanges
General Description
The indicator is designed for comprehensive analysis of Open Interest (OI) across major cryptocurrency exchanges. It consolidates data from multiple platforms, visualizes it as candlestick charts or deltas, and builds tables with breakdowns by exchange and contract type. This allows traders to quickly understand where market interest is concentrated and how the market structure is shifting.
Unlike standard tools that only show data from a single exchange, this indicator provides a full market overview and makes it easy to compare dynamics across different platforms.
⸻
Key Features
• Aggregation of OI data from exchanges: Binance, Bybit, OKX, Bitget, Kraken, HTX, Deribit (feel free to leave a comment if you’d like me to add other exchanges that provide open interest data)
• Support for contract types: USDT.P, USD.P, USDC.P, USD.PM
• Automatic normalization of various OI data formats from different providers
• Display modes:
• OI candlestick chart (total aggregated OI)
• OI Delta (change in OI per bar)
• Full table with detailed data by exchange and contract type
• Short summary table with totals in USD and base assets
• Support for USD or COIN denomination
• Convenient formatting for large numbers
• Customizable colors
⸻
How to Use the Indicator
1. Select Exchanges
In the settings, enable or disable specific exchanges. It is recommended to activate only the ones you need for analysis — this will make the indicator faster.
2. Choose Data Type
• OI — aggregated open interest from selected exchanges.
• OI delta — delta (change in OI compared to the previous bar).
3. Denomination
• USD — values are converted into USD equivalents.
• COIN — values are shown in the base asset (BTC, ETH, etc.).
4. Reading the Chart
• OI candlesticks show the overall OI dynamics.
• Delta histogram highlights how much OI has grown or decreased per bar.
• Colors are fully customizable.
5. Tables
• Enabled via the Show table option.
• Full Table → Rows = exchanges, Columns = contract types. Cells contain OI values in either USD or the base asset, depending on settings. Quickly shows where the main interest is concentrated.
• Short Table → Displays only the total OI values in USD and the base asset.
⸻
Important Notes
• For better readability of large values, two custom formatting functions were implemented. They work similarly to format.volume, but with improved digit grouping and adjustable decimal precision. In the tables, the top row is formatted using format.volume, while the bottom row uses the improved formatting functions for clearer representation.
str(d, n, s) =>
str.substring(d, 0, str.length(d) - n) + '.' + str.substring(d, str.length(d) - n, str.length(d) - (n - 2)) + s
format(_r) =>
d = str.tostring(math.round(_r))
str.length(d) > 9 ? str(d, 9, " B") : str.length(d) > 6 ? str(d, 6, " M") : str.length(d) > 3 ? str(d, 3, " K") : d
⸻
Conclusion: Crypto OI Aggregated is a convenient and powerful tool for cryptocurrency derivatives traders. It enables tracking of OI dynamics across multiple exchanges simultaneously, detecting imbalances between contracts, and identifying signals that are not visible when analyzing a single exchange.

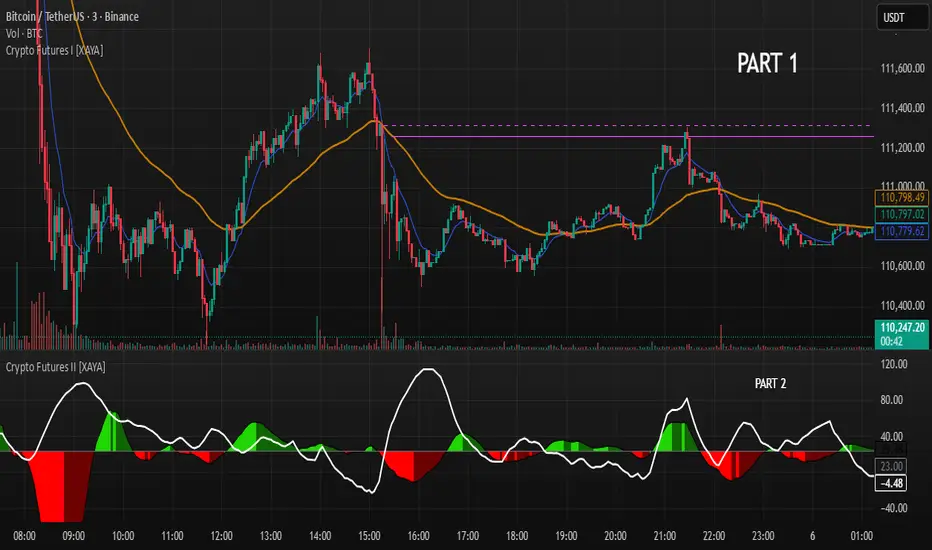
Crypto Futures I [XAYA]Crypto Futures Indicator, by XAYA.
PART 1.
Crypto Futures Indicator it's a full build-in strategy used to trade top 200 Crypto Tokens in any Time Frame from 1H to 1D.
The full strategy uses 5 separated indicators:
- Price Action
- 2 EMAS, 10 and 55
- Volume
- Squeeze Momentum
- ADX
PART 1 of Crypto Futures Indicator plots 2 EMAs (10 and 55) and an horizontal line at the cross of them, to use as areas of future interest. This cross lines that are named "Chris Cross" in honor to my mentor, come in 2 variations:
- Dashed line indicates a cross of EMAS in the present Time Frame.
- Solid line indicates a cross of EMAs in the Higher Time Frame above the present TF.
"Chris Cross" lines are hidden by default since are not needed to execute strategy, but they are good areas or Support and Resistence that can be use in confluence with the rest of the strategy as Buy or Sell points.
XAYA 2025

Crypto Futures II [XAYA]Crypto Futures Indicator, by XAYA.
PART 2.
Crypto Futures Indicator it's a full build-in strategy used to trade top 200 Crypto Tokens from, in any Time Frame from 1H to 1D. The full strategy uses 5 separated indicators:
- Price Action
- 2 EMAS, 10 and 55
- Volume
- Squeeze Momentum
- ADX
PART 2 of Crypto Futures Indicator plots the Squeeze Momentum Indicator in conyunction with ADX+ Levels, to find better entry points based on TIME (squeeze momentum) and STRENGHT (ADX). Used in confluence with Crypto Futures Indicator PART 1, can unleash the reading for a full strategy based on the 5 indicators previously mentioned.
XAYA 2025

Crypto Futures I [XAYA]Crypto Futures Indicator, by XAYA.
PART 1.
Crypto Futures Indicator it's a full build-in strategy used to trade top 200 Crypto Tokens from, in any Time Frame from 1H to 1D. The full strategy uses 5 separated indicators:
- Price Action
- 2 EMAS, 10 and 55
- Volume
- Squeeze Momentum
- ADX
PART 1 of Crypto Futures Indicator plots 2 EMAs (10 and 55) and an horizontal line at the cross of them, to use as areas of future interest. This cross lines that are named "Chris Cross" in honor to my mentor, come in 2 variations:
- Dashed line indicates a cross of EMAS in the present Time Frame.
- Solid line indicates a cross of EMAs in the Higher Time Frame above the present TF.
"Chris Cross" lines are hidden by default since are not needed to execute strategy, but they are good areas or Support and Resistence that can be use in confluence with the rest of the strategy as Buy or Sell points.
XAYA 2025
EWC Zone Matrix📌 EWC Precision Blocks
🔎 Overview
EWC Precision Blocks is a professional market analysis tool designed to highlight high-probability trading zones on the chart. Instead of relying on lagging signals, this indicator maps out Alpha Zones (bullish) and Beta Zones (bearish), allowing traders to identify potential market reaction areas with clarity.
The algorithm is built to adapt across Scalp, Swing, and Position trading modes, making it flexible for short-term intraday traders as well as long-term investors.
⚡ Key Features
Multi-Mode Detection – Switch between Scalp, Swing, or Position modes depending on your trading style.
EWC Alpha Zone (Bullish Detection) – Highlights areas where the market may find strong upward momentum.
EWC Beta Zone (Bearish Detection) – Highlights areas where the market may face downward pressure.
Zone Break Tracking – Visualizes when a zone has been invalidated or broken.
Body-Based Detection – Option to base calculations on candle bodies instead of wicks for precision.
Zone Flips – Displays polarity shifts when zones transition from supportive to resistive behavior (and vice versa).
Custom Styling – Full control of zone and break colors for clear chart visualization.
🎯 How to Use
Select Your Mode
Scalp → Designed for fast intraday moves.
Swing → Medium-term setups, ideal for session trading.
Position → Long-term outlook, suitable for investors.
Watch the Alpha Zones
Highlighted bullish areas can serve as potential support or accumulation zones.
Watch the Beta Zones
Highlighted bearish areas may act as resistance or distribution zones.
Monitor Breaks & Flips
Alpha Breaks → Bullish zones failing.
Beta Breaks → Bearish zones failing.
Zone Flips → Polarity changes, often powerful signals.
🛠 Inputs & Customization
EWC Mode → Choose Scalp, Swing, or Position.
Show Last Alpha Zone → Set how many bullish zones to display.
Show Last Beta Zone → Set how many bearish zones to display.
Body-Based Detection → Toggle candle body vs. wick calculation.
EWC Alpha Zone / Beta Zone Styling → Customize zone colors.
Alpha Break / Beta Break Colors → Adjust break visuals.
Show Zone Flips → Enable/disable historical polarity labels.
Status Bar → Display inputs directly in the chart status line.
📈 Best Practices
Works across all timeframes and markets (forex, crypto, indices, stocks).
Combine with your existing strategy for confirmation.
Use in alignment with higher timeframe structure for maximum accuracy.
⚠ Disclaimer
EWC Precision Blocks is a market visualization tool provided for educational purposes only. It does not provide financial advice, signals, or guaranteed results. Always do your own research and manage risk responsibly.
🔹 About EWC
EWC (EastWave Capital) is dedicated to developing professional-grade trading tools and strategies for traders across forex, crypto, commodities, and indices. With over a decade of combined market experience, our mission is to empower traders with precision, clarity, and confidence in their decision-making.
EWC Precision Blocks is one of our flagship tools, reflecting our commitment to innovation, transparency, and trader-focused solutions.
📌 Published by Usama Manzoor — Founder of EastWave Capital (EWC)
1 minute ago
Release Notes
EWC Precision Blocks
The EWC Alpha-Beta Zone Detector is designed for traders who value clarity, precision, and flexibility in their chart analysis.
By mapping out Alpha (strength) and Beta (weakness) zones, this script provides a structured way to understand how price reacts to key levels in the market.
This indicator is built on price action principles and market structure analysis, avoiding clutter and focusing on the essentials traders need. Whether you are scalping on lower timeframes or analyzing swing opportunities, the Alpha-Beta Zone Detector adapts to your style.
🔹 Core Features
Alpha & Beta Zones → Detects bullish and bearish strength zones in real time.
Highlight Last Zone → Focus on the most recent Alpha/Beta zone for clarity.
Zone Flip Detection → Identifies polarity changes when zones shift from support to resistance or vice versa.
Body-Based Detection → Option to base calculations on candle bodies instead of wicks for more accuracy.
Flexible Timeframe Sensitivity → Switch between short, intermediate, and long-term detection modes.
Custom Zone Styling → Adjust colors, opacity, and line thickness for both Alpha and Beta zones.
Break Visualization → Display breaks of Alpha and Beta zones for additional confirmation.
Market Versatility → Works seamlessly on Forex, Crypto, Indices, Commodities, and Stocks.
🔹 Why Traders Use It
Provides a clear visual guide to market decision zones.
Helps traders refine entries, stop-loss placement, and take-profit levels.
Adapts to multiple trading styles → scalpers, intraday traders, and swing traders.
Keeps charts clean and professional without overloading with unnecessary signals.
⚠️ Disclaimer:
This script is created for educational and informational purposes only. It does not provide financial advice. Trading involves risk; always manage your risk responsibly and conduct your own analysis before entering any position.
Crypto Perp Calc v1Advanced Perpetual Position Calculator for TradingView
Description
A comprehensive position sizing and risk management tool designed specifically for perpetual futures trading. This indicator eliminates the confusion of calculating leveraged positions by providing real-time position metrics directly on your chart.
Key Features:
Interactive Price Selection: Click directly on chart to set entry, stop loss, and take profit levels
Accurate Lot Size Calculation: Instantly calculates the exact position size needed for your margin and leverage
Multiple Entry Support: DCA into positions with up to 3 entry points with customizable allocation
Multiple Take Profit Levels: Scale out of positions with up to 3 TP targets
Comprehensive Risk Metrics: Shows dollar P&L, account risk percentage, and liquidation price
Visual Risk/Reward: Color-coded boxes and lines display your trade setup clearly
Real-time Info Table: All critical position data in one organized panel
Perfect for traders using perpetual futures who need precise position sizing with leverage.
---------
How to Use
Quick Start (3 Clicks)
1. Add the indicator to your chart
2. Click three times when prompted:
First click: Set your entry price
Second click: Set your stop loss
Third click: Set your take profit
3. Read the TOTAL LOTS value from the info table (highlighted in yellow)
4. Use this lot size in your exchange when placing the trade
Detailed Setup
Step 1: Configure Your Account
Enter your account balance (total USDT in account)
Set your margin amount (how much USDT to risk on this trade)
Choose your leverage (1x to 125x)
Select Long or Short position
Step 2: Set Price Levels
Main levels use interactive clicking (Entry, SL, TP)
For multiple entries or TPs, use the settings panel to manually input prices and percentages
Step 3: Read the Results
The info table shows:
TOTAL LOTS - The position size to enter on your exchange
Margin Used - Your actual capital at risk
Notional - Total position value (margin × leverage)
Max Risk - Dollar amount you'll lose at stop loss
Total Profit - Dollar amount you'll gain at take profit
R:R Ratio - Risk to reward ratio
Account Risk - Percentage of account at risk
Liquidation - Price where position gets liquidated
Step 4: Advanced Features (Optional)
Multiple Entries (DCA):
Enable "Use Multiple Entries"
Set up to 3 entry prices
Allocate percentage for each (must total 100%)
See individual lot sizes for each entry
Multiple Take Profits:
Enable "Use Multiple TPs"
Set up to 3 TP levels
Allocate percentage to close at each level (must total 100%)
View profit at each target
Visual Elements
Blue lines/labels: Entry points
Red lines/labels: Stop loss
Green lines/labels: Take profit targets
Colored boxes: Visual risk (red) and reward (green) zones
Info table: Can be positioned anywhere on screen
Alerts
Set price alerts for:
Entry zones reached
Stop loss approached
Take profit levels hit
Works with TradingView's alert system
Tips for Best Results
Always verify the lot size matches your intended risk
Check the liquidation price stays far from your stop loss
Monitor the account risk percentage (recommended: keep under 2-3%)
Use the warning indicators if risk exceeds margin
For quick trades, use single entry/TP; for complex strategies, use multiple levels
Example Workflow
Find your trade setup using your analysis
Add this indicator and click to set levels
Check risk metrics in the table
Copy the TOTAL LOTS value
Enter this exact position size on your exchange
Set alerts for key levels if desired
This tool bridges the gap between TradingView charting and exchange execution, ensuring your position sizing is always accurate when trading with leverage.
Disclaimer, this was coded with help of AI, double check calculations if they are off.
