Volatility Visualizer Percentiles (VIXFix, ATR, VIX)Summary
A volatility regime dashboard for liquid instruments that converts three volatility lenses into 0 to 100 percentile ranks versus the last 252 closed daily bars. It is built to answer one question: is volatility unusually low or unusually high relative to the last year . Use it to adjust position sizing, stop width, and trade selectivity. It is not a directional signal.
Scope and intent
Markets : US indices and index ETFs, index futures, large cap equities, liquid crypto proxies, and other symbols where daily volatility regimes matter
Timeframes : best on Daily. It can be applied on other chart timeframes, but the reference window remains 252 closed daily bars
Default demo : SPX on Daily
Purpose : provide a simple, testable volatility context layer that you can plug into any daily system as a risk filter or risk scaler
What makes it original and useful
Most “volatility tools” show raw ATR or a single volatility index. This script standardizes three distinct sources into the same unit (percentile), so you can compare them and combine them without guessing thresholds.
Unique fusion : internal realized volatility (ATR%), internal stress proxy (VIXFix), and external implied volatility (input VIX symbol) expressed in the same 0 to 100 scale
Practical outcome : the table gives a regime read and an action posture, so the output is directly usable for risk decisions
Testable : all components are visible and thresholdable; you can backtest rules like “only trade when composite is between 30 and 75”
Portable : percentiles remove the need to hardcode market specific “ATR is high” numbers across different symbols
Method overview in plain language
Base measures
VIXFix : a price based fear proxy derived from the instrument’s own daily behavior (using the relationship between recent high closes and current lows)
ATR% : daily ATR normalized by daily close, expressed as a percentage for cross symbol comparability
External VIX : a user selected volatility index or proxy pulled via input symbol (default CBOE:VIX)
Normalization to percentiles
For each metric, the script stores the last 252 closed daily values
It then computes where the most recent closed daily value sits inside that history as a percentile from 0 to 100
Tie handling is configurable (Midrank, StrictLess, LessOrEqual) to define how repeated values are ranked
Fusion rule
Composite percentile is the simple average of the available percentiles (VIXFix, ATR%, VIX)
If one component is missing (for example the external symbol is unavailable), the composite averages the remaining components
How to use it on Daily
This tool is most effective as a risk regime layer on top of an existing strategy. Use the Composite row as the primary dial, and the individual components as confirmation.
Recommended operating zones
0–20 Very Low : quiet regime. Tight stops often survive, but breakouts can underperform. Favor mean reversion or require stronger breakout confirmation.
20–40 Low : constructive for many systems. Use baseline sizing and baseline stops.
40–60 Mid : neutral. Run your base playbook.
60–80 High : volatility expansion. Reduce size and widen stops, or trade only higher quality setups.
80–100 Very High : stress regime. Smallest size, widest stops, and skip marginal setups. Gap risk and slippage risk are higher.
How to interpret disagreements
If ATR% is high but VIX is mid , realized vol is elevated but the market is not pricing extreme fear. Treat as a caution zone, not panic.
If VIX is high but ATR% is mid , implied vol is elevated ahead of potential events. Expect expansion risk even if realized vol has not moved yet.
If all three are high , treat it as a full stress regime and enforce strict risk limits.
What you will see on the chart
A compact table with one row per metric and optional composite
For each row: last closed daily value, 252D percentile, a progress bar, and an action posture
Optional stats: min, median, max for the 252D window (useful for sanity checks, adds CPU)
Table fields quick guide
Last closed daily : the value used for ranking, taken from the last fully closed daily bar
252D percentile : where the current reading ranks versus the last 252 closed daily readings
Bar : quick visual map of percentile from 0 to 100
Action : risk posture suggestion tied to the percentile bucket
Inputs with guidance
Core
Window (closed daily bars) : default 252. Higher values make the regime slower and more structural. Lower values make it more reactive.
VIX
VIX symbol : default CBOE:VIX. You can replace it with another implied volatility proxy appropriate for your market.
VIXFix
VIXFix lookback : typical range 21/22. Smaller reacts faster, larger smooths regimes.
ATR
ATR length : typical range 10–21 on Daily
ATR as % of close : recommended on for comparability across symbols and long history
UI
Show composite volatility score : recommended on. Best single dial.
Show action guide : recommended on if you want direct posture cues.
Show min, median, max : optional. Useful for diagnostics, higher CPU.
Table position : place it where it does not cover price.
Usage recipes
Daily trend following overlay
Trade your trend system normally when Composite is between 25 and 75
If Composite is above 75, reduce size and widen stops, and require stronger trend confirmation
Daily mean reversion overlay
Focus on Composite below 40
Avoid Composite above 80 where gaps and cascading moves reduce mean reversion reliability
Daily risk parity style scaling
Use Composite percentile as a coarse risk throttle: higher percentile equals lower exposure
Example posture: 0–40 normal exposure, 40–80 reduced exposure, above 80 minimal exposure
Alerts
This script is intentionally a dashboard and does not emit buy or sell signals. If you want alerts, create them from percentile thresholds in your own fork. For conservative workflows, trigger alerts on bar close.
// Example alert conditions (add to your fork if desired)
high_vol = comp_pct > 80
low_vol = comp_pct < 20
Honest limitations and failure modes
This is not a directional predictor. Volatility can rise in both bull and bear markets.
Percentiles are relative to the last 252 closed daily bars. A “high percentile” is high versus recent history, not an absolute guarantee of future movement.
Implied volatility (VIX) can move ahead of realized volatility (ATR%). Treat divergence as information, not a signal.
Very high volatility regimes can include gap risk and slippage risk that are not visible in indicator values alone.
Legal
Education and research only. Not investment advice. You are responsible for your decisions. Test on historical data and in simulation before any live use.
每日圖表

PowerLevels - Key Daily LevelsThe Institutional Levels standalone indicator plots the following key price and volume levels directly on your chart:
PDH & PDL (Previous Day High/Low): Displays the high and low of the prior session using time-anchored logic to ensure accuracy across the weekend gap.
POC (Point of Control): The price level where the most volume was traded during the previous New York RTH session.
VAH & VAL (Value Area High/Low): Marks the boundaries of the price range where 70% of the previous day's volume took place.
Settlement: The official previous-day closing price as determined by the CME exchange.
Midnight Open: A horizontal line marking the opening price at 12:00 AM New York time for the current session.
NDOG (New Day Opening Gap): Automated boxes highlighting the gap between the previous day's close and the current day's open, including a dashed midline.
NWOG (New Week Opening Gap): Automated boxes highlighting the gap between Friday’s close and Sunday’s open, including a dashed midline.
Midnight V-Line: A vertical separator marking each new daily session to maintain a clear visual narrative.

PowerDays - Day of the Week HUDDescription: Midnight HUD & Daily Session Dividers
This indicator is designed to provide a clean, "Heads-Up Display" (HUD) for daily session tracking. It solves the common problem of cluttered charts by pinning the days of the week to the top of the chart window in a perfectly horizontal line, ensuring they remain visible and aligned regardless of price volatility or vertical scrolling.
Key Features:
Strict Midnight Dividers: Unlike standard "New Day" indicators that trigger at the exchange open (which can be 6:00 PM for some futures or forex pairs), this indicator plots a vertical dashed line at exactly 00:00 based on your chart's time zone.
Centered HUD Labels: Days of the week (MONDAY, TUESDAY, etc.) are plotted in a level horizontal row at the top of the pane. Labels are mathematically centered between midnight dividers to provide a clear visual of the current trading day’s range.
"Error-Proof" Architecture: Built using primitive plotting methods to avoid common Pine Script "Undeclared Identifier" errors, ensuring high compatibility across different TradingView versions and devices.
Fully Customizable: Includes a built-in color picker to adjust the Royal Blue labels and session dividers to match your specific chart theme.

ADR Daily & Session (Asia, London, NY) Range TrackerOVERVIEW:
The Daily & Session Range Tracker provides comprehensive range analysis for daily and intraday trading sessions (Asia, London, NY) . This indicator is essential for traders who need to understand market volatility and typical price movement ranges across different trading sessions.
KEY FEATURES:
• Daily Range Tracking: Tracks the daily candle range starting from 18:00 (6 PM), aligning with the institutional trading day open
• Session-Based Analysis: Monitors Asia (18:00-02:00), London (02:00-08:00), and NY (08:00-16:00) sessions
• Statistical Analysis: Displays Current, Average, and Median ranges for each period
• Customizable Lookback: Adjustable lookback period (1-20 days) for historical range calculation
• Clean Table Display: Organized data table positioned in the bottom-right corner
HOW TO USE:
1. Add the indicator to your chart
2. Adjust the lookback period to match your trading style (default: 10 days)
3. Customize session times if trading in a different timezone
4. Use the range data to set realistic profit targets and stop losses
5. Compare current range to average/median to gauge if price has room to move
SETTINGS:
• Lookback Period: Number of days to include in average/median calculations (1-20)
• Text Color: Customize the table text color for visibility
• Session Times: Adjust session start/end times for your timezone
PERFECT FOR:
✓ Day traders monitoring session volatility
✓ Scalpers setting realistic targets based on average ranges
✓ Swing traders understanding daily movement potential
✓ Risk management and position sizing decisions
NOTE: The daily range resets at 18:00 to align with institutional daily candle open times.

StO Price Action - Luminous Daily RoadmapShort Summary
- Luminous Daily Roadmap (LDR) are special trading days
- Marks entire trading days using background coloring
- Creates a clear daily roadmap directly on the chart
- Designed to stay minimal and non-intrusive
Full Description
Overview
- LDR is a proprietary forex trading schedule
- Dates of major trend reversals or significant market continuations
- Highlights full trading days using background colors
- Improves visual structure and day-to-day orientation
- Focuses purely on time segmentation, not price signals
- Suitable for all markets and timeframes
Daily Marking Logic
- Each trading day is visually marked across all its bars
- Background coloring spans the full session of the day
- Works consistently across intraday and higher timeframes
Year Look Back (YLB)
- YLB defines the starting year for day marking
- Markings are only applied from the selected year onward
- Allows focused analysis on recent or specific years
Visualization
- Background color is fully customizable
- Uses high transparency to avoid hiding price action
Usage
- Useful for session-based and daily analysis
- Supports routine-based trading and journaling
- Enhances visual rhythm of the chart
Notes
- This indicator is purely visual and non-predictive
- No alerts or signals are generated
- Best used as a structural overlay for orientation
- Can be combined with any price action or indicator-based workflow

StO Price Action - Daily Outside BarShort Summary
- Outside Bar indicator with multiple range calculation algorithms
- Highlights where the current range fully engulfs the previous
- Works with Daily candles in Daily, H4, and H1 timeframes only
- Highlights the current bar when it engulfs the previous bar according to the selected method
Full Description
Overview
- Identifies bars where the current period's range fully engulfs the prior period's range
- Offers three algorithms for defining the engulfing range:
- High/Low: uses absolute high and low values
- Open/Close: considers candle direction (bull/bear) and compares opens and closes
- Open/Close II: stricter version with exclusive inequalities for engulfing
- Engulfing behavior is detected automatically and highlighted for easy recognition
- Works on multiple markets but restricted to D, H4, and H1 charts for accuracy
Controls
- Year lookback (YLB) configurable to filter older bars
- Custom background color for highlighting Outside Bars
- Simple toggle interface with minimal chart clutter
Visual Representation
- Highlights engulfing bars with configurable background color
- Color transparency adjustable for clarity
Usage
- Use to identify strong market momentum or potential reversals
- Helps spot high-probability setups based on engulfing price action
Notes
- Only compatible with Daily, H4, and H1 timeframes
- Non-repainting: once an Outside Bar is drawn, it will not adjust retroactively
- Best used as a market structure reference not a direct trade signal


DLR - Daily Liquidity Range Framework (v1.3)Daily Level Ranges
This strategy targets discounted premiums for buying Call/Put Options in discounted areas based on liquidity levels that form ranges.
Opening Range creates the strongest liquidity for the day.
Premarket Highs/Lows are strong liquidity points.
Previous Day Highs/Lows are reliable liquidity points.
PMH/PML and PDH/PDL may alternate positions relative to OR.
* Discounted Calls are taken under the OR in Bullish conditions
* Discounted Puts are taken above the OR in bearish conditions.
- Momentum Calls are taken at the OR in Bullish Conditions
- Momentum Puts are taken at the OR in Bearish Conditions

The Strat - Multi-Timeframe Combo Analyzer## 📊 The Strat - Multi-Timeframe Combo Analyzer
This open-source indicator implements **The Strat** methodology, a universal price action framework developed by Rob Smith (@RobInTheBlack).
---
### 🎯 What is The Strat?
The Strat categorizes every candle into one of three scenarios based on its relationship to the previous bar:
| Type | Name | Definition |
|------|------|------------|
| **1** | Inside Bar | High < Previous High AND Low > Previous Low |
| **2** | Directional | Breaks only one side (2↑ = broke high, 2↓ = broke low) |
| **3** | Outside Bar | Breaks BOTH previous high AND low |
By tracking these bar types across timeframes, traders can identify actionable setups with defined entry triggers and target levels.
---
### ✨ Features
**Daily Timeframe Analysis:**
- Real-time 3-bar combo detection (2-1-2, 3-1-2, 1-2-2, etc.)
- Pattern classification: Bullish/Bearish Continuation or Reversal
- Entry and Target levels based on Strat rules
- Pattern status: ACTIONABLE, IN-FORCE, TRIGGERED, or WATCHING
**ATR Context:**
- Range % used (how much of daily ATR has been consumed)
- Entry quality assessment (Excellent → Exhausted)
- Day type classification (Quiet → Trend Day)
- Remaining range estimation
**15-Minute Analysis:**
- Separate combo tracking for intraday precision
- Pattern detection on lower timeframe
**Visuals:**
- Customizable info tables
- Entry/Target horizontal lines
- Signal labels on chart
- Alert conditions
---
### 🔧 How to Use
1. Look for **ACTIONABLE** patterns - these are setups waiting for a trigger
2. Entry triggers when price breaks the designated level
3. Target is the next logical Strat level (typically prior bar's high/low)
4. Use **Range%** to assess if there's room left in the daily range
5. Combine Daily and 15-Min combos for trade confluence
---
### ⚠️ Disclaimer
This indicator is for **educational purposes only**. It does not constitute financial advice or guarantee profitable trades. Trading involves substantial risk of loss. Past performance is not indicative of future results. Always conduct your own research and trade responsibly.
---
### 🙏 Credits
**The Strat** methodology was created by Rob Smith (@RobInTheBlack).
This implementation is open-source. Feel free to study, modify, and improve the code!

TradeCraftly - Previous OHLC Levels📌 TradeCraftly – Previous OHLC Levels
TradeCraftly OHLC plots the most important higher-timeframe price levels directly on your chart, helping you identify key support, resistance, and reference zones with clarity.
🔹 What this indicator shows
Previous Day OHLC (High, Low, Open, Close)
Previous Week OHLC
Previous Month OHLC
Today’s Open (no historical clutter)
All levels are drawn as clean horizontal rays and extend only into the current session, keeping the chart focused and readable.
🔹 Key Features
Individual enable / disable controls for Day, Week, and Month levels
No historical clutter – only the most relevant levels are shown
Labels aligned to today’s first candle for quick level identification
Custom line width, color, and style (solid / dashed / dotted)
Works seamlessly on all intraday and higher timeframes
🔹 Why use Previous OHLC levels?
Previous period OHLC levels are widely used by:
Intraday traders
Swing traders
Index & futures traders
They often act as:
Strong support & resistance
Liquidity zones
Breakout / rejection levels
🔹 Best Use Cases
Market open bias using Today’s Open
Intraday trades around PDH / PDL
Weekly range reactions near PWH / PWL
Higher-timeframe context using Monthly levels
⚠️ Disclaimer
This indicator is for educational purposes only and does not provide trading signals or financial advice. Always manage risk and confirm with your own analysis.

Stress & Recovery Daily Stock/BTC This indicator is a stress → recovery regime tool designed for Daily charts (Bitcoin and equities). It combines Williams Vix Fix (WVF) to detect panic/capitulation conditions (potential bottoms) with RSI vs EMA(RSI) to confirm the start of a recovery phase — but only when that recovery occurs within a configurable number of bars after a WVF panic event.
It is not a generic trend indicator. It focuses on one specific sequence:
Panic spike (WVF) → Recovery confirmation (RSI crossing above EMA(RSI)).
What it Shows
1) Red Bottom Shadow (Panic Zone)
A red shaded area below the baseline appears when WVF triggers a panic condition. This highlights periods where downside pressure and “panic-like” behavior are elevated.
To avoid clutter, the red triangle marker (▼) is plotted only once per red cluster, specifically on the last bar of the panic cluster (end of the WVF signal streak).
2) Green State Ribbon (Recovery Regime)
A green ribbon above the baseline indicates a recovery regime. You can choose how the green signal behaves:
Crossover only: green is active only on the single bar where RSI crosses above EMA(RSI).
State (RSI > EMA): green stays active as long as RSI remains above EMA(RSI).
3) Amber Ribbon (Conflict State)
If panic (WVF) and recovery (green state) overlap, the ribbon turns amber.
This indicates a mixed condition: panic is still present, but momentum is attempting to reverse.
4) Green Triangle Marker (▲) — Validated Recovery Start
A green triangle (▲) appears only when RSI crosses above EMA(RSI) AND that crossover happens within N bars from the most recent WVF panic zone. This time-window filter helps avoid unrelated RSI crossovers that occur far from capitulation events.
How to Use
- Treat red shadow as a “panic/stress zone”.
- Look for the green triangle (▲) as the first validated recovery trigger after panic.
- Use green ribbon as a recovery regime filter (especially in “State” mode).
- Use amber ribbon as a caution zone (overlap = mixed signals).
This indicator is best used as a context and timing filter, not as a complete trading system by itself.
Notes:
- Designed and tuned for Daily timeframe usage.
- Signals may behave differently on intraday timeframes or illiquid assets.

Daily High Low XAUUSD by RizalIndikator ini untuk mengetahui high low daily chart XAUUSD di timeframe 4h

Daily contextThis indicator automatically marks the Previous Day’s High and Low, as well as the market’s midnight opening price.
These levels are updated at the start of each new trading day and remain visible throughout the entire session.
By providing key daily reference points, the indicator helps establish a clear market context and allows traders to immediately understand where price is positioned relative to the previous day’s range and the daily open.

Session, Weekly, Daily LevelsScroll down for hungarian description!
Magyar leíráshoz görgess lejjebb!
Overview
This script provides a unified market structure mapping tool that automatically identifies and visualizes key intraday, daily, and weekly reference levels. It helps traders contextualize price action throughout the trading week by marking true session opens, previous day highs/lows, weekly highs/lows, and weekday opens, all with accurate historical anchoring and correct timezone handling.
What This Script Does
1. Intraday Session Opens (Tokyo, London, New York)
- Detects the exact candle where each session opens.
- Draws horizontal rays with labels.
- Automatically clears lines at the start of each new day.
- Uses a custom local-to-exchange timezone conversion system.
2. Weekly Levels
- Last week high and low (precise bar anchoring, not HTF aggregation)
- Current week open (also Monday open)
- Auto-reset on new week
- Levels are always drawn from the true candle where they formed.
3. Previous Day High & Low
- Continuously tracks intraday highs and lows.
- On a new day, stores yesterday’s values and anchors rays to the exact bars.
- Levels remain visible for the full current day and reset the next day.
4. Weekday Opens (Tue–Fri)
- Captures the exact opening price of Tuesday–Friday.
- Monday open = Week open, so it is not shown separately.
- Auto-reset on new week.
Timezone Logic (Original Feature)
The script converts:
local session times → exchange timezone → chart timestamps
It works correctly regardless of chart timezone or instrument exchange location.
Line Drawing Logic
- Finds the exact bar_index where each level forms.
- Draws rays extending to the right.
- Labels are placed ahead of price.
- Safe updating prevents “bar index too far” errors.
How to Use
- Identify daily/weekly structure.
- Track bias relative to session opens.
- Observe reactions around weekday opens.
- Compare price action to last week's range.
Originality
- Custom timezone conversion engine.
- True historical bar anchoring.
- Fully automated weekly/daily structural resets.
- Independent styling for each level type.
- Not a mashup; all components follow one unified logic.
Limitations
- Does not predict trend or direction.
- Structural tool only.
Summary
A precise and reliable market structure tool that unifies weekly, daily, and intraday reference levels with full timezone automation and true-candle anchoring.
MAGYAR LEÍRÁS
--------------
Áttekintés
Ez az indikátor egy összetett piaci szerkezet-feltérképező eszköz, amely automatikusan megjeleníti a legfontosabb intraday, napi és heti referenciaértékeket. A célja, hogy a kereskedő tisztán lássa a piac aktuális környezetét: hol nyíltak a főbb devizapiaci szekciók, hogyan alakult a tegnapi tartomány, hol volt a múlt heti csúcs/mélypont, és hogyan nyitottak az egyes hétköznapok.
Mit tud a script?
1. Szekciónyitások (Tokyo, London, New York)
- Megkeresi a pontos gyertyát, amely a szekciónyitáskori árat tartalmazza.
- Vízszintes vonalat és címkét rajzol.
- Minden nap elején automatikusan törli a korábbi nap szintjeit.
- Egyedi időzóna-konverziós rendszerrel működik (helyi idő → tőzsdei idő → chart idő).
2. Heti szintek
- Múlt heti maximum és minimum (pontos gyertyapontra horgonyozva)
- Aktuális heti nyitóár (egyben a hétfői nyitó is)
- Új hét kezdetekor automatikusan frissül.
- A múlt heti high/low nem fix időpontra, hanem a valódi gyertyára kerül.
3. Előző napi High és Low
- Folyamatosan követi a napi maximumot és minimumot.
- Napváltáskor elmenti és pontos gyertyáról indítja a ray-t.
- A szintek a teljes nap folyamán megmaradnak, majd a következő nap törlődnek.
4. Hétköznapok nyitóárai (Kedd–Péntek)
- A kedd, szerda, csütörtök és péntek nyitóárát rögzíti és megjeleníti.
- A hétfői nyitó a Week Open, ezért külön nem jelenik meg.
- Heti váltáskor automatikusan törlődnek.
Időzóna-kezelés (egyedi megoldás)
A script a felhasználó helyi idejét átszámítja az instrumentum tőzsdei időzónájára, majd a chartra vetíti.
Ez biztosítja, hogy minden szekciónyitás helyesen jelenik meg, bármely chart vagy instrumentum esetén.
Vonalrajzolási logika
- A szintek a valódi bar_index alapján kerülnek rögzítésre.
- Jobbra nyúló ray-eket rajzol.
- A címkék mindig a jobb oldalon, előre helyezve jelennek meg.
- Biztonságos frissítési rendszer akadályozza meg a hibákat (pl. “bar index too far”).
Használat
- Napi/heti szerkezet meghatározása.
- Bias követése a session openekhez viszonyítva.
- Reakciók figyelése a hétköznapok nyitóárai körül.
- Összevetés a múlt heti tartománnyal.
Eredetiség
- Egyedi időzóna-kezelő motor.
- Igazi gyertyapont-alapú horgonyzás.
- Automatikus napi/heti reset.
- Minden szint külön stílusban konfigurálható.
- Nem mashup; egységes rendszer.
Összegzés
Professzionális, pontos eszköz a piaci szerkezet feltérképezésére, amely egyesíti a heti, napi és intraday szinteket, teljes időzóna-automatizálással és gyertyapontra horgonyzott kijelölésekkel.

Prev/Current Day Open & Close (RamtinFX)Draws three transparent vertical lines marking the previous day’s close, the current day’s open, and the current day’s close.

Daily Candle by NatantiaIntroduction to the Daily Candle Indicator
The Daily Candle Indicator is a powerful and customizable tool designed for traders to visualize daily price action on any chart timeframe.
This Pine Script (version 5) indicator, built for platforms like TradingView, overlays a single candle representing the day's open, high, low, and close prices, with options to adjust its appearance and session focus.
Key Features:
Customizable Appearance: Users can set the colors for bullish (default green) and bearish (default white) candles, as well as the wick color (default white). The horizontal offset and candle thickness can also be adjusted to fit the chart layout.
Dynamic Updates: The candle updates on the last bar, with wicks drawn to reflect the daily high and low, providing a clear snapshot of the day's price movement.
This is the same version as before, but we had to republish it because the chart contained other indicators, which violated the publication rules. We apologize for the inconvenience.
Have a nice trades!
-Natantia

1D Overlay (triss)Overlay of the Daily candle, simple one color with a line inside the candle to show direction.

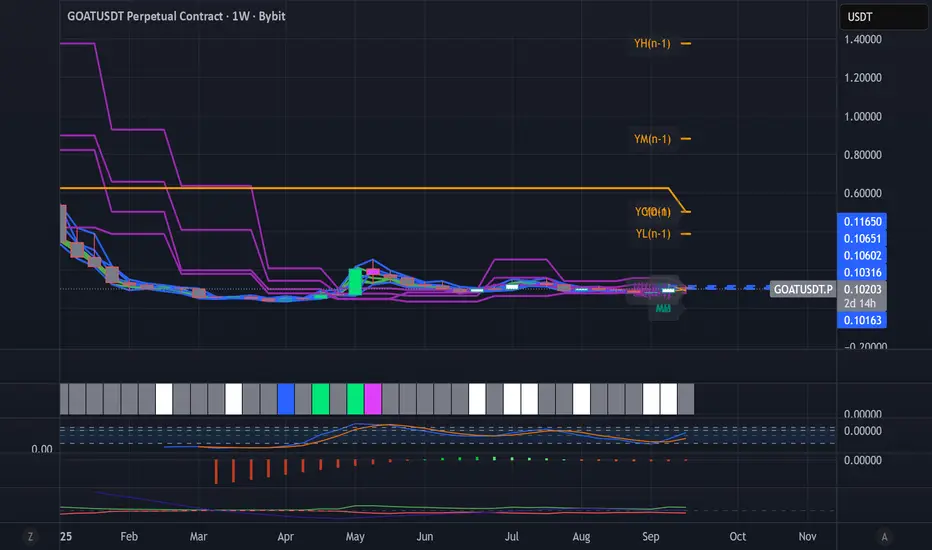
Dynamic Levels This indicator plots key price levels (Open, High, Low, Mid, Close) from multiple higher timeframes (Monday, Daily, Weekly, Monthly, Yearly).
It allows you to track how price interacts with important reference levels without switching timeframes.
🔑 Features
✅ Monday levels (MO, MH, MM)
By default: shows the last completed Monday (fixed values).
Option: “live mode” to update Monday High/Low/Mid while Monday’s candle is forming.
✅ Daily levels (DO, DH, DL, DM, DC)
Live: Daily High/Low/Mid update dynamically while today’s candle is forming.
Previous Daily Close (DC) is always fixed.
✅ Weekly levels (WO, WH, WL, WM)
Live: Weekly High/Low/Mid update dynamically while this week’s candle is forming.
Weekly Open is fixed.
✅ Monthly levels (MO(n), MH(n-1), ML(n-1), MM(n-1), MC(n-1))
Shows last completed month’s values (constant, never changing).
Current Monthly Open is also shown (naturally fixed).
✅ Yearly levels (YO(n), YH(n-1), YL(n-1), YM(n-1), YC(n-1))
Shows last completed year’s values (constant, never changing).
Current Yearly Open is also shown (naturally fixed).
🎨 Customization
Toggle each level (on/off) in indicator settings.
Individual color settings for Monday, Daily, Weekly, Monthly, and Yearly.
Adjustable line width and transparency.
Optional short labels (MO, DO, WM, etc.) displayed on the right side of the chart.
🔄 Dynamic Logic
Daily and Weekly → update dynamically while their candle is forming.
Monday, Monthly, and Yearly → use fixed values from the last completed bar (do not “breathe”).
📌 Use cases
Quickly see where price stands relative to previous close, current open, or mid-levels.
Use Monday Open/High/Mid as strong intraday references.
Use Monthly/Yearly levels as long-term support/resistance zones.
Killzone za Indexe - @mladja123This indicator highlights the Kill Zones on index charts, showing key market sessions where high-probability price movements are likely to occur. It helps traders identify optimal entry and exit points based on session dynamics and market rhythm, enhancing strategy precision for swing and intraday trading on indices.
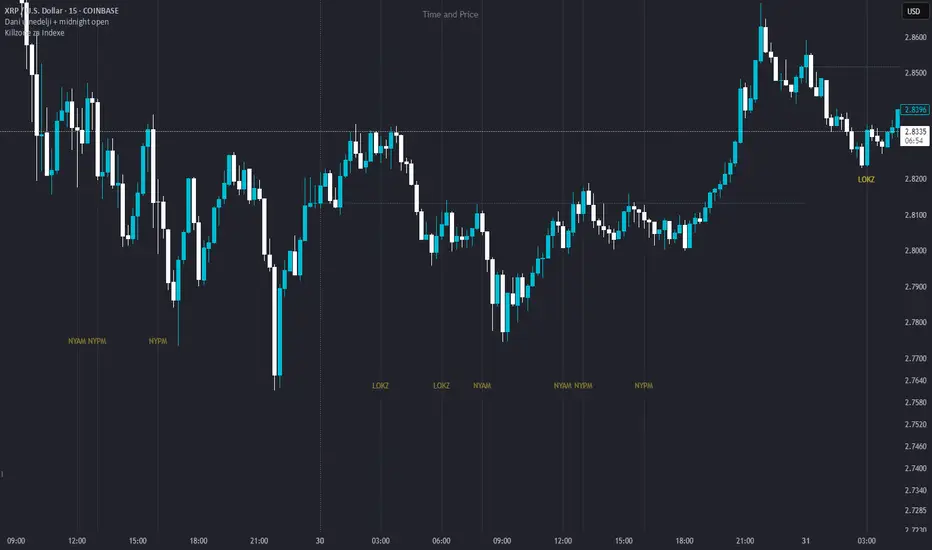
Dani u nedelji + midnight open @mladja123This indicator breaks the weekly timeframe into cycles and marks the midnight open for each day. It helps traders visualize weekly structure, identify key daily openings, and track market rhythm within the week. Perfect for analyzing trend patterns, swing setups, and session-based strategies.

LevelsThis Indicator is meant to plot some of the most common levels that traders use.
The display of these levels is highly customizable, as you can choose the line type , color , thickness and whether it shows you no label, price only, reduced label or full label next to the line. All labels (except for "no Label") will show the price at this level.
Also You have the option to mark the start on each timeframe with either a individually colored background or a vertical line where you can choose the line style and color.
Full List of available Levels and Optional inputs to these levels:
Previous HTF Candle Levels:
• Previous HTF Candle Open
• Previous HTF Candle High
• Previous HTF Candle Low
• Previous HTF Candle Close
Optional:
• Choose any higher timeframe
• Mark start of new HTF candle
Session Levels:
• Session Open
• Session High
• Session Low
• Session Close
Optional:
• Choose any time as start and end of your session
• Mark start of session
• Mark full session
Daily Levels:
• Current Day Open
• Current Day High
• Current Day Low
• Previous Day Open
• Previous Day High
• Previous Day Low
• Previous Day Close
Optional:
• Choose start of day (standard, NY Midnight, custom start time)
• Mark start of day
Weekly Levels:
• Current Week Open
• Current Week High
• Current Week Low
• Previous Week Open
• Previous Week High
• Previous Week Low
• Previous Week Close
Optional:
• Mark start of Week
Monthly Levels:
• Current Month Open
• Current Month High
• Current MonthLow
• Previous Month Open
• Previous Month High
• Previous Month Low
• Previous Month Close
Optional:
• Mark start of Month

Simple Daily OpenDisplays the daily open line, simple as that.
The line is drawn from the opening price of the first bar of the day. There is an option to choose the color, line style, and thickness.

Daily 50‑ & 200‑SMA Ceiling Radar — EnhancedDescription:
This custom TradingView indicator, developed by Trader Malik and licensed under Trades Per Minute, is a powerful visual tool for identifying how price behaves relative to major daily moving averages — the 50-SMA and 200-SMA. It helps traders quickly understand key technical dynamics such as trend alignment, MA proximity, and short-term momentum sentiment — all displayed on a clean, minimal overlay with visual alerts and an adjustable data table.
FEATURES
1. Daily 50 & 200 Simple Moving Averages (SMA):**
- Displayed directly on the chart using distinct blue and orange lines.
- These serve as primary trend filters and support/resistance zones.
2. Price Highlighting:
- A red background flashes momentarily when the price crosses either the 50-SMA or 200-SMA.
- A green background fills the chart when price is above both MAs (bullish zone).
- A red background persists if price is below both MAs (bearish zone).
3. MA Gap Analysis Table:
- 50-SMA Row**: Shows % gap between 50-SMA and 200-SMA.
- 200-SMA Row**: Shows % gap between 200-SMA and 50-SMA.
- Sentiment Row**: Displays short-term trend bias based on the slope of the past 7 daily closes — Bullish, Neutral, or Bearish.
USER SETTINGS
Table Location: Choose between **Top Right** or **Bottom Right** of the chart.
Table Size: Select **Small**, **Medium**, or **Large** to suit screen preferences and layout aesthetics.
This script is **intellectual property of Trades Per Minute** and distributed by **Trader Malik** for use under licensing terms. Redistribution or repurposing without authorization is strictly prohibited.
