[UPRIGHT Trading] Top & Bottom Finder [Premium]Hello Traders,
Today I'm releasing an updated version of my previous Top & Bottom Finder (M.Right_Top & Bottom Finder 1.0).
The timing of this release couldn't be more perfect with everyone trying to 'find the bottom'. And the increased volatility that we've been seeing as of late.
Essentially, my indicator uses volatility and standard deviations among other things to assist you in finding the top or bottom of trends. You may also notice that it uses a lot of different strength indicators to provide an additional layer of complexity and confirmation.
Not just an RSI, but an RSI ema, smoothed OBV RSI's, and other volume RSI's. This is a truly unique and powerful tool for any Trader - whether you've just started or you've been trading for 20 years, I'm confident you will find value in the UPRIGHT Trading Top & Bottom Finder.
How to use it:
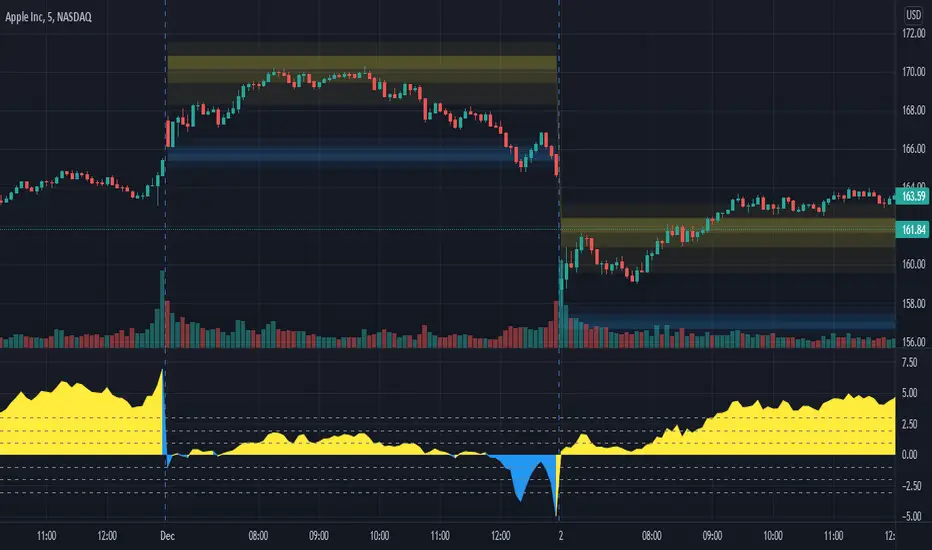
When it detects the trend Bottoming or Topping the histogram will change color. Bottom - Green/blue, Top - Red, (different shades of colors for different types of detection).
I've spent several hours tweaking the calculations and filters to enhance the accuracy, so this will be a noticeable upgrade from my original Top & Bottom Finder.
The length of the histogram bar can be an indication in itself, especially when it lines up close to one of the plotted lines and has noticeable direction change following this.
I've added a lot of text and pictures to help display it's capabilities, features, and customizability.
As always, it's fully customizable with alerts. Can toggle any thing on or off, and change the colors to suit your style.
3 Unique RSI's, different colors on the histogram will show different levels of detection. Some are more accurate in some timeframes than others. Bright Green and Bright Red are the most different from the rest.
I've jam-packed this indicator with Buy/Sell and Confirmation Signals and even background highlights (with colors that can mesh together). Feel free to find what works best for you.
RSI color indications and background highlights aid in confirmation. Also, as mentioned previously, sometimes a gray bar will land on a Fib and it will be a bottom signal.
The above chart should look like this
Good luck Traders,
Cheers,
Mike
(UPRIGHT Trading)
Deviation

Time-of-Day DeviationCreates a 'Time-of-Day' Deviation cone starting from the first bar of the session based upon data from previous days.

DailyDeviationLibrary "DailyDeviation"
Helps in determining the relative deviation from the open of the day compared to the high or low values.
hlcDeltaArrays(daysPrior, maxDeviation, spec, res) Retuns a set of arrays representing the daily deviation of price for a given number of days.
Parameters:
daysPrior : Number of days back to get the close from.
maxDeviation : Maximum deviation before a value is considered an outlier. A value of 0 will not filter results.
spec : session.regular (default), session.extended or other time spec.
res : The resolution (default = '1440').
Returns: Where OH = Open vs High, OL = Open vs Low, and OC = Open vs Close
fromOpen(daysPrior, maxDeviation, comparison, spec, res) Retuns a value representing the deviation from the open (to the high or low) of the current day given number of days to measure from.
Parameters:
daysPrior : Number of days back to get the close from.
maxDeviation : Maximum deviation before a value is considered an outlier. A value of 0 will not filter results.
comparison : The value use in comparison to the current open for the day.
spec : session.regular (default), session.extended or other time spec.
res : The resolution (default = '1440').
[cache_that_pass] 1m 15m Function - Weighted Standard DeviationTradingview Community,
As I progress through my journey, I have come to the realization that it is time to give back. This script isn't a life changer, but it has the building blocks for a motivated individual to optimize the parameters and have a production script ready to go.
Credit for the indicator is due to @rumpypumpydumpy
I adapted this indicator to a strategy for crypto markets. 15 minute time frame has worked best for me.
It is a standard deviation script that has 3 important user configured parameters. These 3 things are what the end user should tweak for optimum returns. They are....
1) Lookback Length - I have had luck with it set to 20, but any value from 1-1000 it will accept.
2) stopPer - Stop Loss percentage of each trade
3) takePer - Take Profit percentage of each trade
2 and 3 above are where you will see significant changes in returns by altering them and trying different percentages. An experienced pinescript programmer can take this and build on it even more. If you do, I ask that you please share the script with the community in an open-source fashion.
It also already accounts for the commission percentage of 0.075% that Binance.US uses for people who pay fees with BNB.
How it works...
It calculates a weighted standard deviation of the price for the lookback period set (so 20 candles is default). It recalculates each time a new candle is printed. It trades when price lows crossunder the bottom of that deviation channel, and sells when price highs crossover the top of that deviation channel. It works best in mid to long term sideways channels / Wyckoff accumulation periods.

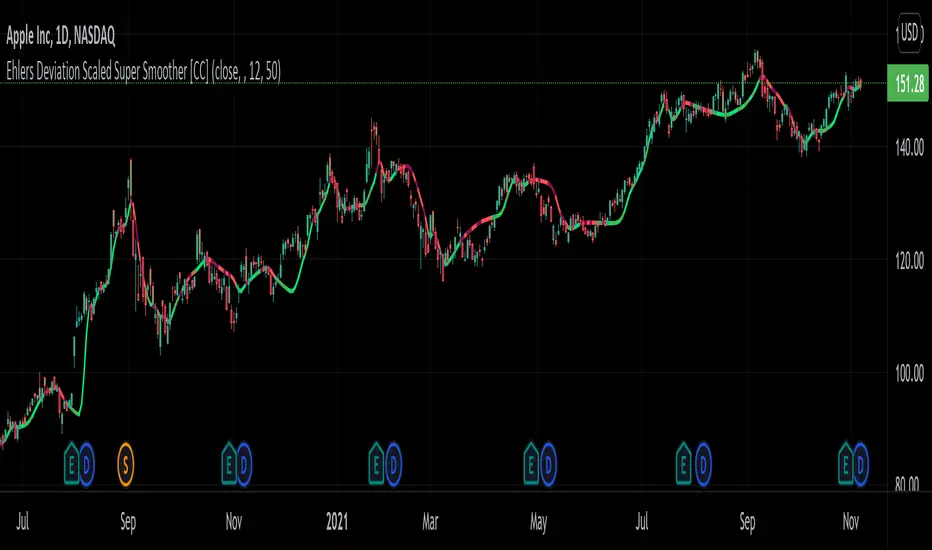
Ehlers Deviation Scaled Super Smoother [CC]The Deviation Scaled Super Smoother was created by John Ehlers and this is an excellent moving average that changes direction very quickly and can keep up with the current underlying trend. This indicator works by applying a Hann Windowed Moving Average to the stock's momentum and scaling that by the Root Mean Square and then using that value in the input for a Super Smoother . I have included strong buy and sell signals in addition to normal ones so lighter colors are normal signals and darker colors are strong ones. Buy when the line turns green and sell when it turns red.
Let me know if there are any other scripts you would like to see me publish!
WhaleCrew Crypto ArbitrageVisualizes the price difference (deviation) off BTC/ETH across multiple exchanges (Spot and/or Perpetuals)
Spot prices are represented by circles, while perpetual prices are shown as crosses.
Spot:
Binance
FTX
Bitfinex
Coinbase
Perpetuals:
Binance
FTX
Bybit
BitMEX

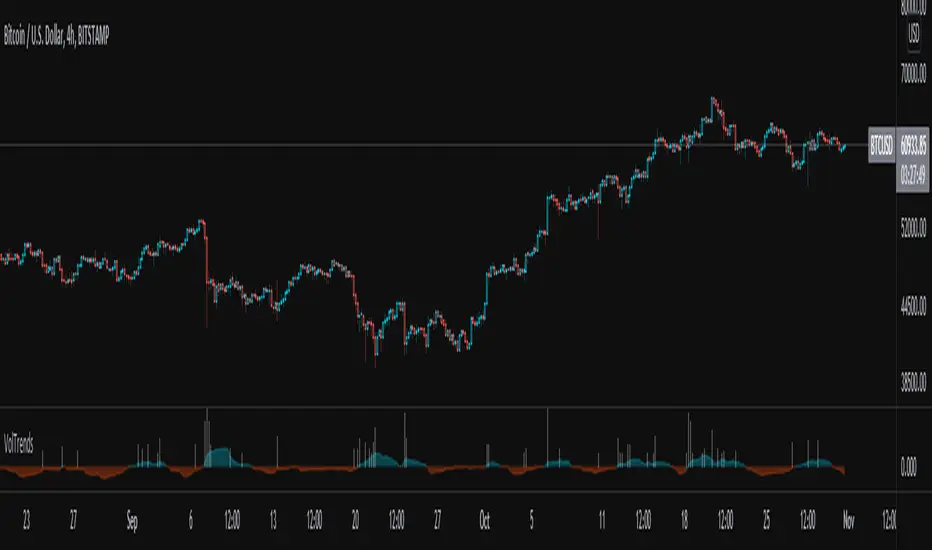
Volume TrendsThis script provides clear volume trends on any time frame. You set a long term volume trend moving average (ex 100 periods). A shorter term MA of your choice (10 in this example) will oscillate above and below based on the standard deviations of its current value relative to the long term #.
Similarly, large volume bars are plotted in terms of st dev above the long term MA.
Very useful in spotting capitulation bottoms and/or blow-off tops.
M.Right_Top & Bottom Finder 1.0Thank you @Lazybear for the calculations for squeeze and BB, and all of the other great pine-coders who inspired me to create my own indicator to share!
This is the result of hours of work learning to code pine and tweaking until everything fits exactly what I was looking for.
After using it for a while and seeing the benefits personally, I figured now might be a good time to share with everyone while we are in such great market volatility, maybe I can save you some losses.
Basically, my indicator is meant to use volatility and standard deviations to show you the top and bottom of trends.
It does indeed work on lower timeframes, I typically use it on 5m, 30m, 4hr, and 1d.
What to look for:
When it detects the trend bottoming it will send a green histogram bar down, I also created a different shade green for even more likely bottoms.
When it detects the top of the trend it will send a red bar up, I have a brighter red for more certain tops.
The length of the histogram bar is also an indication as well. Sometimes there will be a reversal while still just showing the gray bar.
I just added alerts, so hopefully those work. If not, I will update.
Let me know if you have any questions, and enjoy.
Cheers!

Standard deviation of the exponential moving average
This indicator emphasizes price movements when it moves away from or closer to the chosen moving average, within the envelope of its standard deviation. It serves as a complement to other indicators or can be used within a strategy by itself.

Bias(Deviation Rate)Deviation rate (BIAS), by calculating the distance between the closing price and a moving average to reflect the reversal created by the degree of deviation between the price and the moving average during a certain period of time.
Above the zero axis is called positive deviation and belongs to the bullish zone, while below the zero axis is called negative deviation and belongs to the bearish zone.
Regardless of whether it is a positive deviation or a negative deviation, whenever the gap between the stock price and the moving average becomes larger, it means that the stock price has an overbought/oversold condition, and a high probability will result in a reversal.

Tradingview ToolkitA new trader's biggest barrier to entry is lack of understanding where they are in terms of time and price and with tradingview free they are often limited to just 1 or 2 extra indicators as many new traders slap on RSI and MACD as 2/3 free ones. While these indicators are fine for trend analysis, its important to know where the price is in relation to time. Thus, this all-in-one script is meant to have a lot of customizable utility to save on indicator spots and act as a hotspot for many common needs.
-2 Sets of VWAP line w/ standard deviation bands with customizable timeframes.
-1 more customizable timeframe VWAP line (no std dev bands) to use as a long time frame reference
-Ability to plot previous VWAP close prices over current timeframe on all VWAP lines w/ basic color changing if price closes above/below
-2 Sets of Bollinger Bands with customizable source length and MA type
-3 customizable moving averages with custom timeframe/resolutions
-Inside candle barcolor repainter to easily notice if a candle was inside the range of the previous candle (price contraction)
Not meant to have everything on at once, but simply a place to enable and disable different things and save spots for more important things

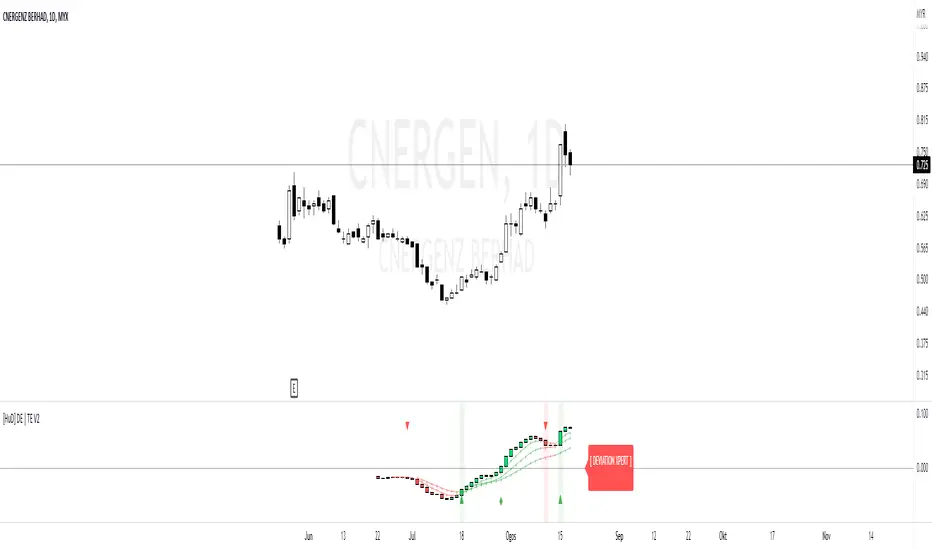
HuD DE | TEHuD DE | TE Expert is a combination of two indicators.
1. DE or Deviation Expert
DE is based on ema5 and ema20. This MA algorithm is to filter signals such as trend and convergence/divergence. It is represented by HA Candles.
There are 4 signals to assist traders in making decisions
i. Golden Cross = possible entry point ( Green Triangle )
ii. Death Cross = possible exit point ( Red Triangle )
iii. Cross Up Level 0 = look for Buy opportunity ( Green Diamond )
iv. Cross Down Level 0 = look for Sell opportunity ( Red Diamond )
There are also ema lines to monitor the movement of current candle movement.
2. TE or Trend Expert
TE is based on ema5 movement to assist traders to see the overall trend of chart movement.
The movement is represented by HA Candles.
There are 4 ema's lines to monitor HA Candles movements.
This lines act as support / resistance which can assist traders to see the current trend of the chart.
For example, if line is green ( Uptend) and the next candle drop below the first green ema lines, next line (ema10) acts as support.
If next candle breaks ema10, we can consider making an exit plan. Or for swing traders, they can consider waiting until candle drop below ema50 ( purple line ) before deciding to exit.
Note: This indicator setting only suitable for Bursa Malaysia market.
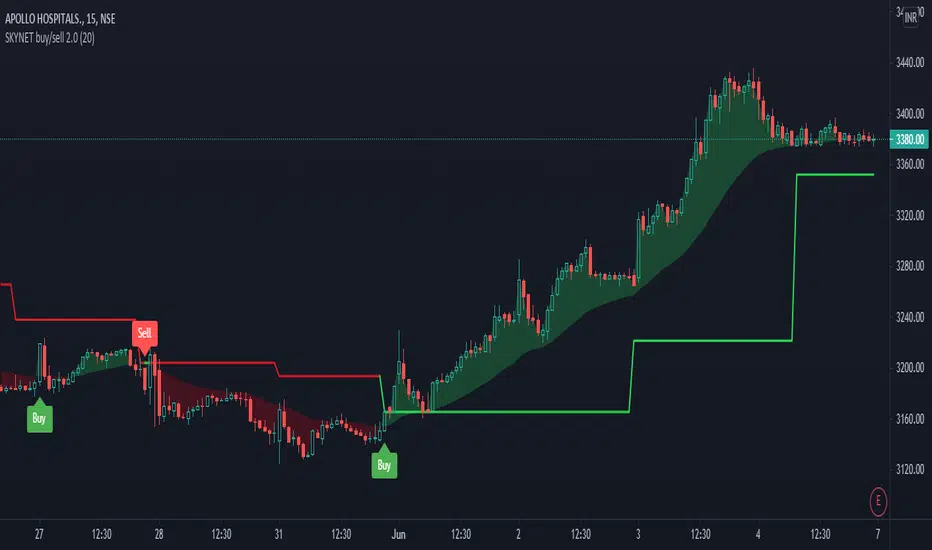
SKYNET buy/sell 2.0The SKYNET buy/sell 2.0 indicator generates buy and sell signals based on the following conditions:
**Anchor line : This anchor line is calculated based on certain parameters.
The anchor line is calculated in such a way that the stock/instrument moves around this anchor line.
The calculation of the anchor line uses a look back period which is set to 9 by default. The user can go to the indicator settings and change it to suit their trading style.
Note:
1) As the look back period increases, the number of signals generated on the chart decreases.
2) This indicator will only work on charts/stocks/instruments which are actually traded in the market i.e actual contracts of the stock/instrument is traded in the market. Hence, it will not work on indexes.
BUY signal: When the stock/instrument deviates to the upside of the anchor line by a specific margin, the Buy signal is generated.
SELL signal: When the stock/instrument deviates to the downside of the anchor line by a specific margin, the Sell signal is generated.
Disclaimer: This indicator is not 100% accurate and false signals are generated from time to time. Trading in the markets involves huge risks and one should always do his/her own research before making any trading decisions. This indicator is only designed to help you make a trading decision.
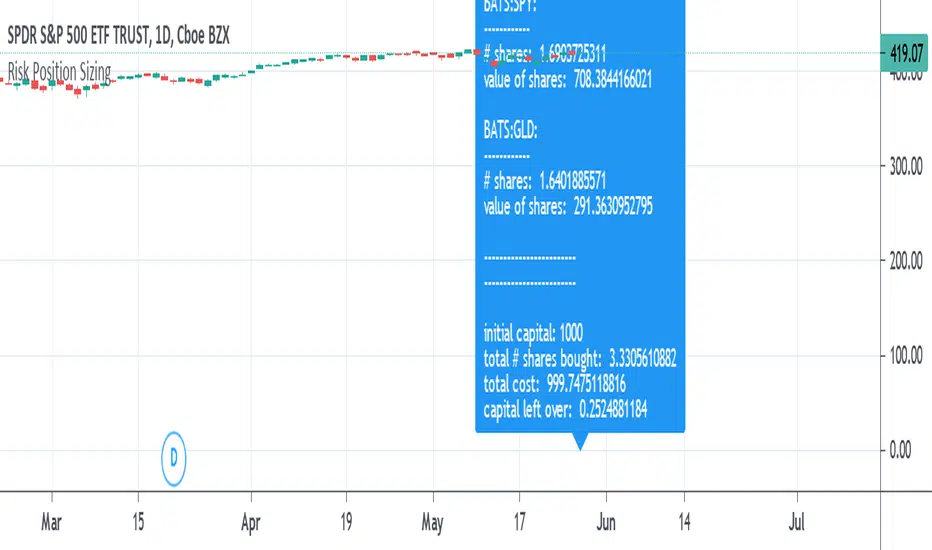
Risk Position Sizing tool using Coefficient of VariationA way to manage portfolio risk using relative standard deviation, also known as coefficient of variation. This tool tells you how much of each stock in shares and in value to buy adjusted for their volatility risk for a given starting account capital. A problem many people have is how to diversify an account and adjusting it for the risk involved in each equity. Many would put in an equal amount of capital value into each share but is it really equal if some equities have more risk than others? A solution is to adjust the portfolio by giving less weight to those that are more volatile or risky. It's done by using a starting percent of the account, preferably a small percent of it, and buying up shares with that same amount for each equity. Each equity will also be divided by the COV to risk adjust the portfolio by giving less weight to the more volatile stocks. This is done until as much of the initial capital in the account as possible is spent.
COV is how far away the price is from the mean or average. The further the price is from the mean the more risk or volatility there is. It uses standard deviation in its calculation. The problem with SD and ATR is that they are not relative to the past or to other equities to compare to. An application where COV can be used is risk portfolio management formulas. This does not take into account correlation or other equation parts in some portfolio management formulas but only the risk or volatility, the default volatility length is mostly arbitrary, and the lower risk stocks may end up being the slowest in performance.
The text label will show how many shares will be bought and how much value each equity will have. At the end it will show the initial capital that was started off with, the total shares bought, the total value of all the shares, and the amount of capital left over. If the sources are not blank then they will be used, to blank them you will need to reset the settings to default otherwise they might still be read. If you want to add more than the given 10 equity spaces to the portfolio then you will need to add in the code manually and add it to the chart. The denominator is perhaps the important part in these types of risk position sizing tools, you can change to other things such as risk-reward ratio instead of volatility or change the volatility type, etc.
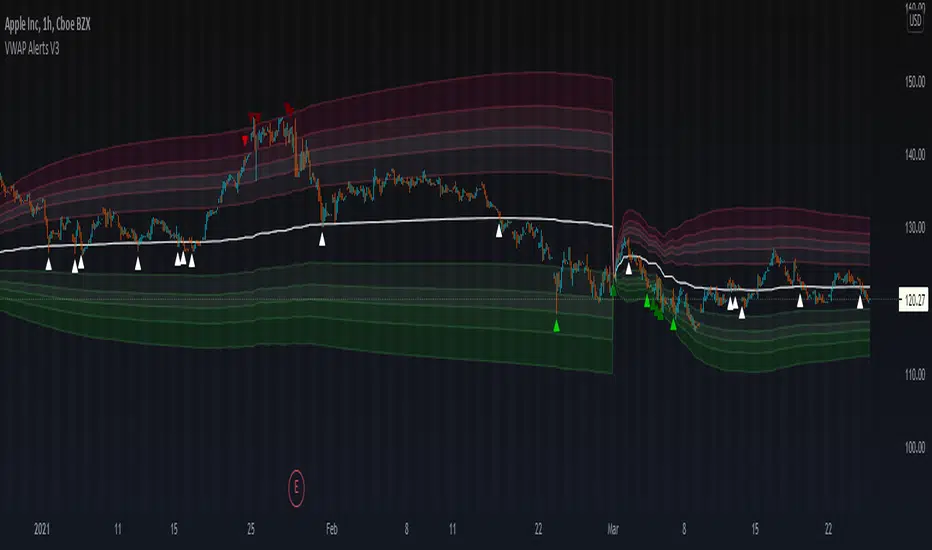
VWAP Alerts V3VWAP Alerts signal over bought/over sold conditions, relative to volume weighted average price, while deviation bands plot an extremely accurate point of mean reversion.
VWAP Alerts V3 includes multiple timeframe selection, along with multiplier input for deviation band setting
Alerts can be set for each individual band, for extreme oversold/overbought conditions, use "Vwap Low Deviation 4" and "Vwap High Deviation 4".
Alerts can also be set for VWAP bounces, by simply setting "VWAP Alert"
VWAP Oscillator CandlesThe VWAP oscillator plots VWAP as the zero line with price, relative to VWAP. This can be use the same way you would traditionally use VWAP, with a much clearer picture of deviation from VWAP. Also, after creating the script, I noticed divergence was extremely noticeable here!

Enhanced Sigma by Cryptorhythms [CR] - AdvancedEnhanced Sigma - Advanced Volatility-Normalized Returns Analysis
The Enhanced Sigma indicator measures volatility-adjusted price returns to identify statistical extremes, regime changes, and mean reversion opportunities. By normalizing returns against their standard deviation, the indicator reveals when markets are experiencing unusual moves relative to recent volatility—highlighting potential exhaustion points, capitulation events, and statistical anomalies.
█ OVERVIEW
Sigma (σ) represents how many standard deviations current returns deviate from normal behavior. Readings beyond ±2.0 indicate statistically unusual moves, while extreme readings beyond ±3.0 occur less than 1% of the time under normal distribution. This version adds multi-layered analysis including regime detection, multi-timeframe confirmation, and adaptive thresholds.
█ KEY FEATURES
Return Calculation Methods
The indicator supports multiple return calculation approaches:
- Simple Returns — Standard percentage change calculation
- Log Returns — Logarithmic returns for better statistical properties
- Geometric Returns — Square root based calculation
- Percentage Returns — Scaled percentage format
Volume Weighting
Optional volume weighting emphasizes high-volume moves while dampening low-volume noise. When enabled, returns are weighted by normalized volume to give more significance to moves occurring on institutional participation.
Threshold Methods
Two threshold calculation approaches:
- Fixed Thresholds — Manual static levels
- Percentile-Based — Adaptive thresholds calculated from historical distribution
Percentile-based thresholds automatically adjust to changing volatility regimes over configurable lookback periods.
Statistical Significance Testing
Built-in t-test functionality determines whether current sigma readings are statistically significant or merely random noise. Configurable confidence levels (80-99.9%) filter out insignificant moves. Non-significant readings are visually dimmed.
Multi-Timeframe Analysis
Analyzes sigma across multiple timeframes simultaneously. Confluence signals trigger when all timeframes (current, 3x, 5x) align at extremes—indicating stronger conviction and reduced false signals. MTF sigma values are plotted as reference lines.
Regime Detection
Automatically classifies current volatility environment into four regimes:
- Low Volatility — Market in compression
- Normal — Standard volatility conditions
- High Volatility — Elevated movement
- Extreme — Unusual volatility expansion
Regime classification uses percentile ranking and statistical deviation analysis.
Adaptive Threshold System
Three methods for automatic threshold adjustment:
- ATR-Based — Adjusts based on Average True Range ratio
- Volatility Regime — Tightens in low volatility, widens in high volatility
- Range Expansion — Responds to recent sigma range changes
When enabled, thresholds dynamically scale with market conditions to maintain consistent sensitivity.
Cluster Analysis
Detects and scores clusters of threshold breaches within rolling windows. High cluster scores can indicate capitulation or exhaustion phases. Visual labels "C" show active clusters.
Mean Reversion Signals
Generates entry and exit signals based on extreme sigma readings returning to mean:
- Long Entry — Triggered on oversold extremes
- Short Entry — Triggered on overbought extremes
- Exit Signals — When sigma normalizes or time-based exit reached (marked as gray "X")
Optional statistical significance filter ensures only high-probability setups generate signals. Position tracking displays unrealized P&L.
Distribution Histogram
Displays sigma value distribution as a horizontal histogram showing Point of Control (POC)—the most frequently occurring sigma level. Configurable bin size and lookback period.
Statistics Dashboard
Real-time table displaying:
- Current sigma value and percentile rank
- Statistical measures (mean, std dev, skewness, kurtosis)
- Volatility regime classification
- Extreme event frequency
- Bars since last extreme
- Position status and P&L (when mean reversion enabled)
█ VISUAL ELEMENTS
Threshold Lines
- Aqua/Cyan lines — Positive (high) thresholds
- Fuchsia/Magenta lines — Negative (low) thresholds
- Solid lines — Short-term dynamic thresholds
- Circles — Long-term dynamic thresholds
- Crosses — Percentile-based static thresholds (when enabled)
Sigma Histogram
Primary histogram uses momentum-based coloring:
- Purple shades — Negative sigma (declining)
- Cyan shades — Positive sigma (advancing)
- Darker shades indicate weakening momentum
- Brighter shades indicate strengthening momentum
Statistically significant threshold breaches are highlighted with intensified colors.
Shape Markers
- Small triangles — Statistically significant threshold breaches
- Diamonds — Multi-timeframe confluence signals
- Large triangles with text — Mean reversion entry signals (LONG/SHORT)
- X markers — Mean reversion exit signals
- Labels — Cluster detection alerts
█ ALERTS
The indicator includes comprehensive alert conditions. Use confirm on bar close if repainting is enabled.
█ HOW TO USE
Identifying Extremes
Sigma readings beyond ±2.0 indicate unusual moves. Look for:
- Threshold breaches with statistical significance markers (triangles)
- Multi-timeframe confluence (diamonds) for stronger signals
- Cluster formation indicating potential exhaustion
Regime-Aware Trading
Use regime detection to adjust expectations:
- In Low Volatility regimes, smaller sigma moves may be significant
- In Extreme regimes, higher thresholds prevent overtrading
Mean Reversion Strategy
Enable mean reversion signals for systematic entries:
- LONG signals appear after statistically significant oversold extremes
- SHORT signals appear after statistically significant overbought extremes
- Exit signals trigger on return to mean or time-based stops
Distribution Analysis
Use the histogram to identify:
- POC level — Where sigma spends most time (equilibrium)
- Current position relative to distribution

B3 HL2MA Painter ~ Extremely Smooth Average & Bar PaintMy HL2MA is a 'proprietary' formula based on the idea that I never again want to see a jagged average line. I released a version of this a long time ago, but I wanted to update it to how I have it on my charts in other platforms. Here are some notes about this moving average script:
The default input value is 5, and I suggest the range of use 4-6 with the rare occasion of using 3 or 7.
For me 5 is what I use UNLESS I AM IN A TRADE, then I might switch to 4 if I have some profits to lock, or 6 if I want to stay in for a lengthier trade.
This average when kept within the above parameters is the smoothest MA in my arsenal, HL2 refers to the middle of the candles which further de-noises the line.
The colors are green/red for good movement with the confirmed trend.
The colors are gray for movement against the current trend (signaling a possible mean reversion)
The colors blue & yellow appear when signaling possible chop or trend exhaustion.
Carried forward from the last time I posted this, the bias for longs and shorts is depicted as the color of the average line green or maroon, and ALERTS are based on that overall bias created the line by itself.
Also carried from the last post, the green and maroon clouds depict the price deviance from the line; when the cloud stretches wide it may be time to take profits and enter back in closer to the line.
Thanks again for liking and following!!!!
This share is in response to my 10,000th like on TradingView!
Favorite this one, and enjoy :-)

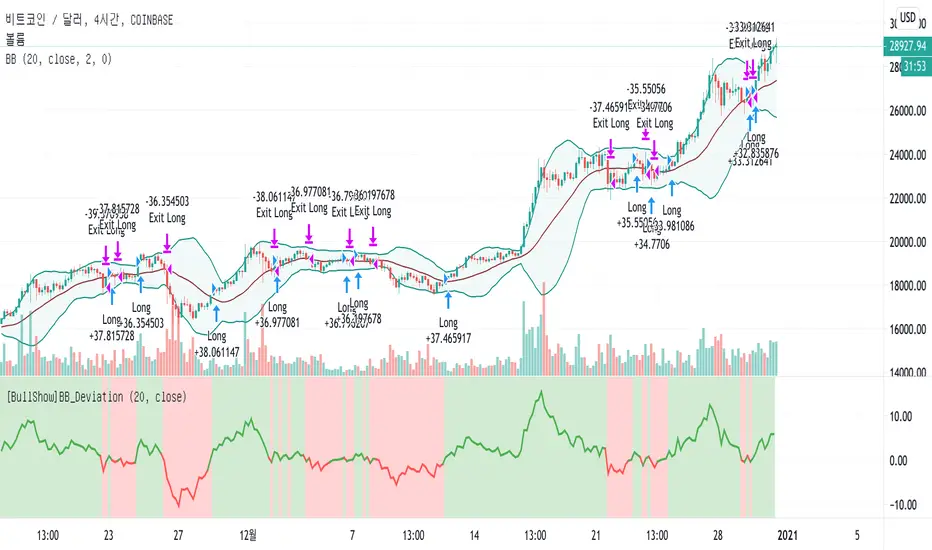
[BullShow]BollingerBands_Deviation StrategyHello Everyone.
Are you enjoying this crazy bull market?
I want to Introduce very classic and simple but powerful strategy.
My strategy is using Bollinger Bands. Yes! It's the indicator that everyone knows and uses.
First of all, let's look at how Wikipedia defines the Bollinger Bands.
Bollinger Bands - Wikipedia
------------
Introduce
Bollinger Bands (/ˈbɒlɪnjdʒər bændz/) are a type of statistical chart characterizing the prices and volatility over time of a financial instrument or commodity, using a formulaic method propounded by John Bollinger in the 1980s.
Purpose
The purpose of Bollinger Bands is to provide a relative definition of high and low prices of a market. By definition, prices are high at the upper band and low at the lower band. This definition can aid in rigorous pattern recognition and is useful in comparing price action to the action of indicators to arrive at systematic trading decisions.
Interpretation
The use of Bollinger Bands varies widely among traders. Some traders buy when price touches the lower Bollinger Band and exit when price touches the moving average in the center of the bands. Other traders buy when price breaks above the upper Bollinger Band or sell when price falls below the lower Bollinger Band. Moreover, the use of Bollinger Bands is not confined to stock traders; options traders, most notably implied volatility traders, often sell options when Bollinger Bands are historically far apart or buy options when the Bollinger Bands are historically close together, in both instances, expecting volatility to revert towards the average historical volatility level for the stock.
------------
However, the use of the Bollinger Bands described on the website is only very abstract without precise guidelines.
So, by calculating the deviation of the 20-days moving average line, the center line of the Bollinger Bands, I chose a strategy to buy when the deviation starts to widen and sell when the separation starts to narrow again.
As a result, I found a strategy that would give you a decent return.
Due to the nature of the strategy, trades in the box zone are frequent, so the win rate is small, but when the price trend is confirmed, you can get a big profit.
Therefore, you can expect good returns from pair with a clear trend rather than pair that trade frequently in the box zone.
If you are interested in my strategy, Use the link below to obtain access to this indicator or PM me to obtain access
Thank you for your supporting.
안녕하세요 여러분.
이 미친 강세장을 즐기고 있습니까?
매우 고전적이고 단순하지만 강력한 전략을 소개하고 싶습니다.
제 전략은 볼린저 밴드를 사용하는 것입니다. 예! 모두가 알고 사용하는 그 지표입니다.
그러나 웹에서 설명하는 사용 방법은 정확한 지침없이 매우 추상적 일 뿐입니다.
따라서 저는 볼린저 밴드의 중심선 인 20 일 이동 평균선의 편차를 계산하여 편차가 확대되기 시작하면 매수하고 편차가 다시 좁아지기 시작하면 매도하는 전략을 선택했습니다.
결과적으로, 나는 당신에게 적절한 수익을 줄 전략을 찾았습니다.
전략의 특성상 박스 존에서의 거래가 빈번해 승률은 적지 만 가격 추세가 확인되면 큰 수익을 얻을 수 있습니다.
따라서 박스 존에서 자주 거래되는 패어보다는 명확한 추세의 패어에서 좋은 수익을 기대할 수 있습니다.
전략에 관심이 있으시거나 사용을 원하신다면 아래를 참고 해 주시거나 PM을 보내주세요.
감사합니다.
Back Testing
*initial_capital: $10000
*default_qty_value: 100%
*commission_value: 0.1%
*Period: 2017.01.01~
Profit
BTCUSD: 3109%
ETHUSD: 11160%
YFIUSDT: 823.88%
ZILUSDT: 570.84%
BNBUSDT: 937.18%
LINKUSDT: 471.41%
*Due to the nature of the strategy, a pair with a strong trend yields better results.
*전략 특성상 추세가 강한 패어에서 더 좋은 결과를 도출합니다.
*Optimized for a 4 hour time frame and a 12 hour time frame.
*4 시간 시간 프레임과 12 시간 시간 프레임에 최적화되었습니다.
Exponential Deviation Bands Width [ChuckBanger]This indicator is a compliment to Exponential Deviation Bands . It is the difference between the upper and the lower bands divided by the middle band. It is an easy way to visualize consolidation before price movements or periods of higher volatility.
How it works
During a period of high volatility, the distance between the two bands will widen and Exponential Deviation Bands width will increase. And the opposite occurs during a period of low volatility, the distance between the two bands will contract and Exponential Deviation Bands width will decrease. Meaning there is a tendency for bands to alternate between expansion and contraction.
When the bands are relatively far apart, that is often is a sign that the current trend is ending. When the distance between the two bands is relatively narrow that often is a sign that the market is about to initiate a bigger move in either direction.

VWAP + Fibo Dev Extensions StrategyBased on my VWAP + Fibo deviations indicator, I tested some strategies to see if the indicator can be profitable; and I got it !
This strategy uses:
H1 timeframe
Weekly VWAP
+1.618 / +2.618 / -1.618 / -2.618 Deviations Extensions to create 2 bands
The value of the deviation
First, the 2 bands are plotted : +1.618/+2.618 painted in red and -1.618/-2.618 painted in lime.
Then, we wait for the deviation value to reach at least 150 (see thumbnail) to avoid littles moves when the gaps between bands are too short.
Entry long position :
first candle must crossunder the -1.618 level and low have to stay over the -2.618
low of the second one must stay in the lime band
enter the third one if the deviation value is over limit (150)
Exit long position :
TP : when a high crossover VWAP
SL : when a low crossunder -2.618
Entry short position :
first candle must crossover the +1.618 level and high have to stay under the +2.618
high of the second one must stay in the red band
enter the third one if the deviation value is over limit (150)
Exit short position :
TP : when a low crossunder VWAP
SL : when a high crossover +2.618
Notes :
this strategy uses pyramiding (5), be careful and calculate your risk management
the comission value is set to 0.08% to include slippages when entering a trade because of market orders
This strategy is not an advice to invest, make your own decisions.

MAD v1 [Intromoto]Hey traders,
This script shows a plotshape on candles, respective of deviation % from the chosen moving average. The further price is from the MA, theoretically, the faster and more reliably price should return to that moving average or close to it.
Users have the following inputs:
- Type of MA to measure the deviations from, i.e EMA, SMA, WMA, VWMA.
- Accompanying moving averages for reference. Fast, med, slowest
- Offset
- AVP resolution
- AVP length
- Use without AVP or other filter
- Use with AVP filter
- Hide/Show High Deviations
- Hide/Show Medium-High Deviations
- Hide/how Smallest High Deviations
- Hide/Show Smallest Low Deviations
- Hide/Show Medium-Low Deviations
- Hide/Show Low Deviations
- Optional size adjustment for low % deviations, used for lower time frames
There are individual plotshapes from deviation percentages in brackets between percentages in both directions of the moving average. i.e 1%-2%, 2%-3%, etc, up to 20% whereby there is a plotshape for all deviations about 20% above the MA and one plotshape for all deviations below -20% below the MA
The plotshapes are color coded from pink and blue . The style menu is setup to show the deviations as they would appear at their respective height above or below the MA. The current filter is a calculation of the average difference between all bars over the length input.
Depending on what time frame you trade within, it may be suggested that these signals are more likely to assist with long exits than short entries, but I have used it for both successfully under certain time frames. Checking off the "Trading Below 3m" box changes the size of the smaller deviations from auto to tiny, which are more visible.
I'll be adding and testing different filters applied to reduce deviation signals that are heavily against the trend or discounting larger time frame momentum. This script, especially the filters I have and will continue to add are experimental. Please use at your own risk.
Thanks for your time!
Please PM me for access.

SSHSH_DevVolatility is a market pulse, like breathing. And it's deviations is being considered as a signal attenuation.
When You want to know how far is the current price of it's mean value, You can use this indicator to determine 3-sigma rule.
The mean line (like moving average) shows if the market is in it's UpTrend state or the DownTrend state.
When it hits it's upper level - so we can say that the Uptrend has ended. The vice versa for the DownTrend.
Use it with the faster tuning when You trade the higher timeframes, and with the slower tuning on a lower timeframes.
{PM me in TradingView to arrange subscription access}
