Zig Zag Trend Metrics“ Zig Zag Trend Metrics ” is a highly versatile indicator, built on the classic Zig Zag concept and thoughtfully designed for technical traders seeking a deeper, more structured view of market dynamics. This tool identifies significant swing highs and lows, classifies them, and annotates each with key metrics, offering a precise snapshot of each movement. It enhances visual analysis by drawing connecting lines that outline the flow of market structure, making trend progression and reversals instantly recognizable. Beyond visual mapping, it features a compact, real-time statistics table that calculates the average price and time deltas for both bullish and bearish swings, giving traders deep insights into trend momentum and rhythm. With extensive customization options, this indicator adapts seamlessly to vast trading styles or chart setups, empowering traders to spot patterns, evaluate trend strength, and make more confident, data-backed decisions.
❖ FEATURES
✦ Automatic Swing Detection
At its core, this indicator automatically identifies swing highs and lows based on a customizable lookback period (default: 10 bars).
✦ Labeling Swing Points
Each swing is visualized with a label that includes:
Swing Classification : “HH” (Higher High), “LH” (Lower High), “LL” (Lower Low), or “HL” (Higher Low).
Price Difference : Displayed in percentage or absolute value from the previous opposite swing.
Time Difference : The number of bars since the previous swing of the opposite type.
These labels offer traders clear, immediate insight into price movements and structural changes.
✦ Visual Lines
The indicator draws three types of lines:
Bullish Lines: Connect recent swing lows to new swing highs, indicating uptrends.
Bearish Lines: Connect recent swing highs to new swing lows, indicating downtrends.
Range Lines: Connect consecutive highs or lows to outline price channels.
Each line type can be color-coded and customized for visibility.
✦ Statistics Table
An on-screen metrics table provides a live summary of trends. Script uses Relative Averaging to smooth price and time changes. This prevents outliers from distorting the data and provides a more reliable sense of typical swing behavior.
Uptrend Metrics: Shows average price and time differences from recent bullish swings.
Downtrend Metrics: Shows the same for bearish swings.
🛠️ Customization Options
Ability to tailor the indicator to suit their strategy and aesthetic preferences:
Swing Period: Adjust sensitivity to short- or long-term swings.
Color Settings: Customize line and label colors.
Label Display: Choose between absolute or percentage price differences.
Table Settings: Modify size, location, or visibility.
This makes the indicator highly flexible and useful across various timeframes and assets.
Difference

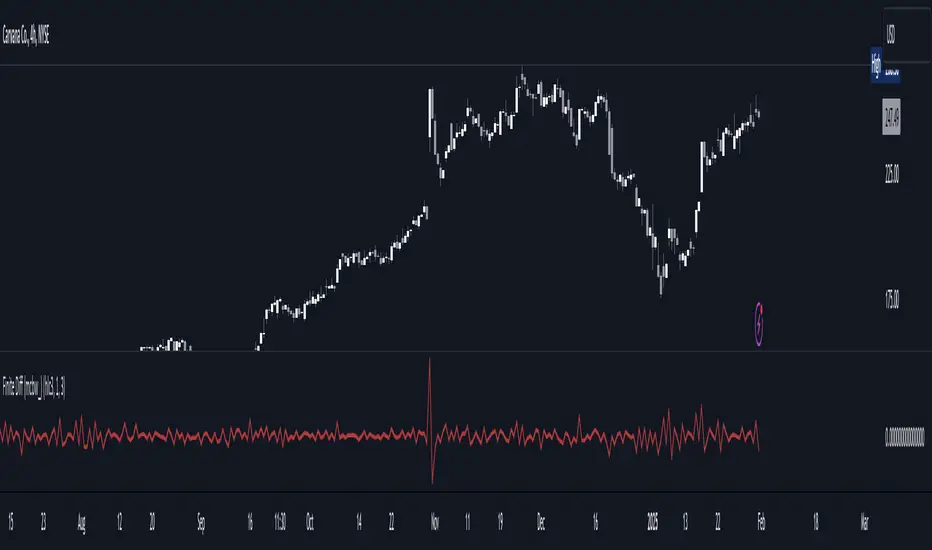
Finite Difference - Backward (mcbw_)In calculus there exists a 'derivative', which simply just measures the difference between two points on a curve. For well behaved mathematical functions there are infinitely many points and so there exists a derivative at every point. Where there are infinitely many points in a curve that curve is called 'continuous'. Continuous curves are very nice to deal with since each point on it exists almost exactly where its neighbors are. However, if the curve does not have infinitely many points on it, but instead has a finite number of points on it, that curve is called 'discrete' instead of continuous. Taking the derivative of discrete curves is much trickier business since there are none of the mathematical conveniences that a continuous offers. In the real world everything we measure is a discrete curve, including Price (since we measure it a finite number of times, aka each candlestick)!
The branch of Discrete Mathematics has found an approach to measure the derivative along a discrete curve, that approach is aptly called " Finite Difference ". To get a more accurate approximation of a discrete derivative, the finite difference approach uses weighted combinations of neighboring points. The most common type of finite difference is a 'central' difference, this uses a combination of points before and after the point of interest to approximate the discrete derivative. This is great for historical analysis but is not of much use for trading algorithms since it technically means using future prices to calculate the derivative of the current point. Instead we can use a less common variant called a ' Backwards Difference ' that only uses a combination of points before the current one to help approximate the current derivative.
In this script you can choose the " Order " of your derivative and the " Accuracy " of its approximation. This script is for educational purposes for folks building trading algorithms. Many trading algorithms often have an element of seeing how much Price has changed from the previous candle to the current candle. This approach is the lowest accuracy derivative possible, and using the backwards finite differences, made available for the first time on TradingView (!!), algorithms that use derivatives can now have higher orders of accuracy!
Happy Trading/Developing!
Cryptocurrency SentimentOverview
This script focuses on calculating and visualizing the sentiment difference between LONG positions and SHORT positions for a selected cryptocurrency pair on the Bitfinex exchange. It provides a clean and clear visual representation of the sentiment, helping traders analyze market behavior.
Key Features
Dynamic Symbol Selection:
The script automatically detects the cryptocurrency symbol from the chart (syminfo.basecurrency) and dynamically constructs the LONGS and SHORTS ticker symbols.
Works seamlessly for pairs like BTCUSD, ETHUSD, and others available on Bitfinex.
Sentiment Calculation:
The sentiment difference is calculated as:
Sentiment Difference=−1×(100− SHORTS/LONGS ×100)
LONGS : The total number of long positions.
SHORTS : The total number of short positions.
If SHORTS is 0, the value is safely skipped to avoid division errors.
Color Coding:
The script visually highlights the sentiment difference:
Green Line: Indicates that LONG positions are dominant (bullish sentiment).
Red Line: Indicates that SHORT positions are dominant (bearish sentiment).
Zero Reference Line:
A gray horizontal line at 0 helps users quickly identify the transition between bullish (above zero) and bearish (below zero) sentiment.
How It Works
Fetching Data:
The script uses request.security to fetch LONGS and SHORTS data at the current chart timeframe (timeframe.period) for the dynamically generated Bitfinex tickers.
Handling Data:
Missing or invalid data (NaN) is filtered out to prevent errors.
Extreme spikes or irregular values are safely avoided.
Visualization:
The sentiment difference is plotted with dynamic color coding:
Green when LONGS > SHORTS (bullish sentiment).
Red when SHORTS > LONGS (bearish sentiment).
Benefits
Market Sentiment Insight: Helps traders quickly identify if the market is leaning towards bullish or bearish sentiment based on actual LONG and SHORT position data.
Dynamic and Adaptive: Automatically adjusts to the selected cryptocurrency symbol on the chart.
Clean Visualization: Focuses solely on sentiment difference with color-coded signals, making it easy to interpret.
Best Use Cases
Trend Confirmation: Use the sentiment difference to confirm trends during bullish or bearish moves.
Market Reversals: Identify potential reversals when sentiment shifts from positive (green) to negative (red) or vice versa.
Sentiment Monitoring: Monitor the overall market bias for cryptocurrencies like BTC, ETH, XRP, etc., in real-time.
Sample Chart Output
Above Zero → Green Line: Bullish sentiment dominates.
Below Zero → Red Line: Bearish sentiment dominates.
Zero Line → Transition point for shifts in sentiment.

Zero-lag Volatility-Breakout EMA Trend StrategyThis is a simple volatility-breakout strategy which uses the difference in two different zero-lag* EMAs (explained below on what exactly I mean by this) to track the upwards or downwards strength of an instrument. When the difference breaks above a Bollinger Band of a configurable standard deviation multiple, the strategy enters based off the direction of the base EMA used (i.e. if the difference breaks above and the current EMA is rising, a long entry is produced. If the difference breaks above and the current EMA is falling, a short entry is produced).
The two EMA-type metrics used to calculate the volatility difference are calculated by the following formula:
top_ema = math.max(src, ta.ema(src, length))
bottom_ema = math.min(src, ta.ema(src, length))
ema_difference = (top_ema - bottom_ema) - 1
This produces a difference which responds immediately to large price movements, instead of lagging if it used strictly the EMA itself.
SETTINGS
Source : The source of the strategy - close, hlc3, another indicator plot, etc.
EMA Difference Length : The length of both the EMA difference statistics and the base EMA used to calculate the entry side.
Standard Deviation Multiple : The Bollinger Bands multiple used when the difference is breaking out.
Use Binary Strategy : The strategy has two configurations: Binary and Rapid-Exit. 'Binary' means that it will not close a long position until a short position is generated, and vice-versa. 'Rapid-Exit' will close a long or short position once the difference reaches the middle Bollinger Band MA. This means that turning on 'Binary' will expose you to more market risk, but potentially greater market return. Turning off 'Binary' will exit quickly and reduce drawdown.
The strategy results below use 10% equity and 0.1% fees per trade.

High - Low Difference (Forex)This script is created to read and label the difference between High and Low of a candle in points term & in percentage term.
This is basically made for Forex Trading.
Do explore the settings of the scrip.

Spread of ScriptsHello all
This indicator helps you to find spread between scripts.
Very much helpful for finding spread of script with relative future script. (Index or Stocks).
The are two methods to find spread –
1. Divide
2. Difference
You can select your choice from indicator settings.

High - Low DifferenceThis script is created to read and label the difference between High and Low of a candle in percentage term.

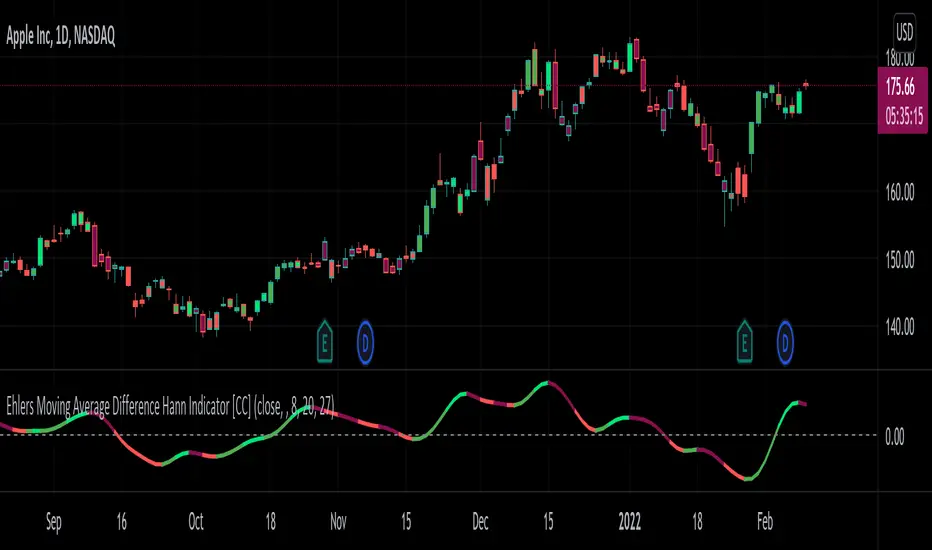
Ehlers Moving Average Difference Hann Indicator [CC]The Moving Average Difference Hann Indicator was created by John Ehlers (Stocks and Commodities Nov 2021) and this is an improved variation of his Moving Average Difference Indicator that uses smoothing from his Hann Windowing Indicator to provide smoother buy and sell signals. As for how this indicator works it is an improved version of the classic MACD indicator which of course takes a difference between two exponential moving averages. I have included strong buy and signals in addition to normal ones so lighter colors are normal signals and darker colors are strong signals. Buy when the line turns green and sell when it turns red.
Let me know if there are any other indicators you would like to see me publish!
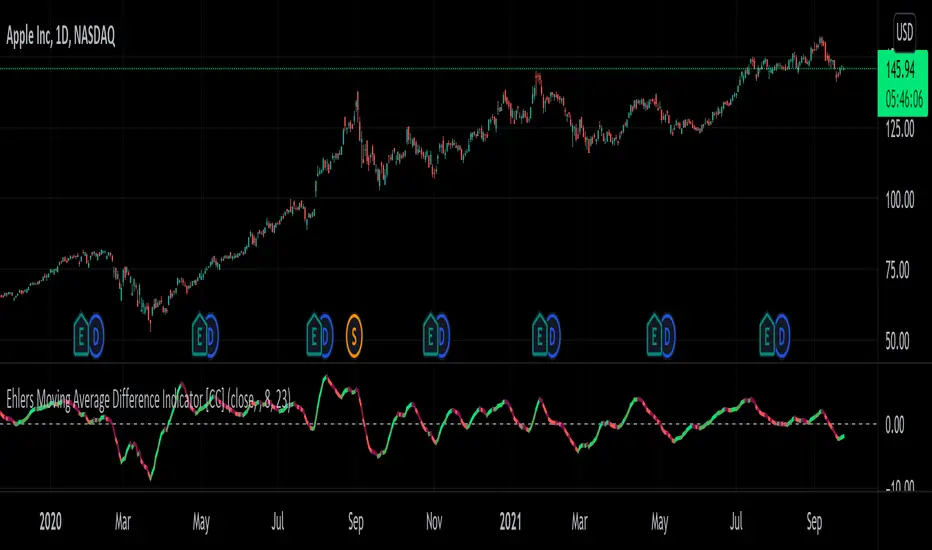
Ehlers Moving Average Difference Indicator [CC]The Moving Average Difference Indicator was created by John Ehlers (Stocks and Commodities Oct 2021 pg 23) and this is essentially his version of the famous MACD indicator. He calls this indicator the "thinking mans" MACD because his thought process for creating the lengths is based on half of the period of the dominant cycle. These are the default lengths that he created but feel free to test it out with your own variations and please let me know if you come up with a better one. I'm sorry for my long delay from TV. Sometimes I just need to step away and collect my thoughts before I burn myself out with the many scripts I keep publishing daily. I will try to get back into publishing daily again because I have a personal backlog of over 50 scripts ready to go that I haven't published yet. As always I have included strong buy and sell signals in addition to normal ones so darker colors are strong and lighter colors are normal. Buy when the line turns green and sell when it turns red.
Let me know if there are any other scripts you would like to see me publish!
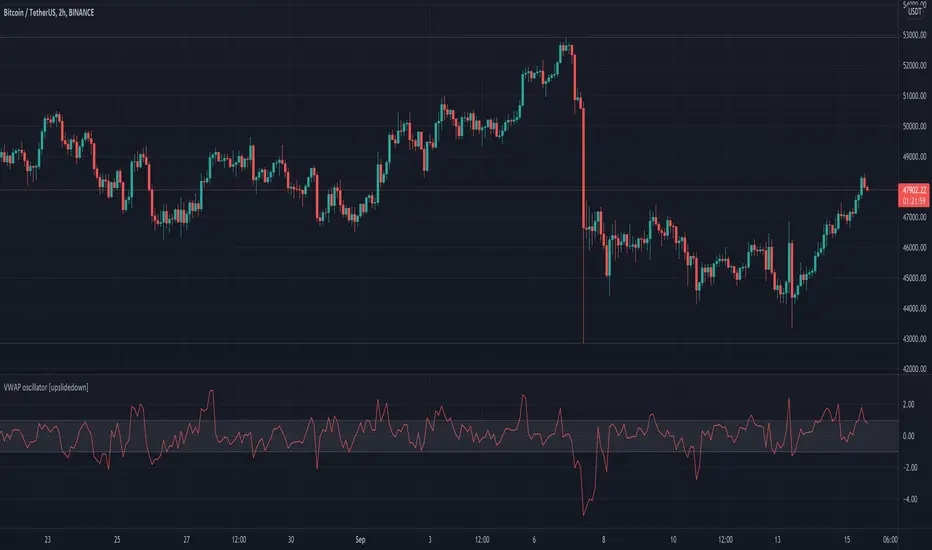
VWAP oscillator [upslidedown]This VWAP oscillator showcases the percent difference between VWAP and current price within an oscillator centered on 0. My thesis for this indicator is that trend following within the threshold zone (defaulted to 1%) would be "choppy" but outside is a significant trend. Another way to think about VWAP is potential for taking profits, as price will always be magnetized back to the center.
I find this sort of visualization very helpful when creating strategies that revolve around a filter such as VWAP and wasn't able to find anything that was close and/or provided this sort of visualization publicly. Enjoy and let me know if you find this useful or can dream up an improvement.
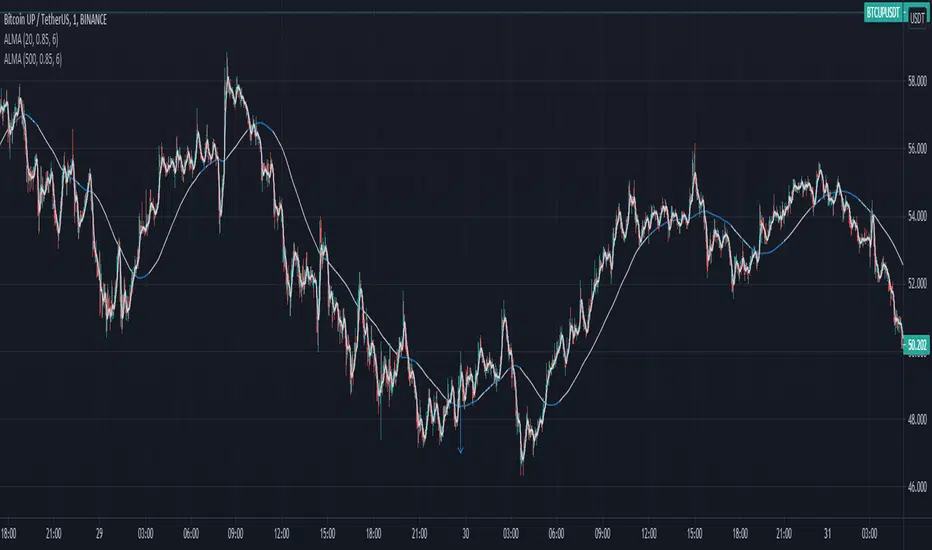
Moving Average Slope AnalysisThis is a simple script which allows to do slope analysis on any kind of Moving Average. Simply change the moving average function that you wish to work with , in the script.
Slope analysis may be required for fine-tuning trade automation software , which uses Moving Average for determining optimum enter/exit point.
Read code comments for instructions!
Relative Difference Of Squares Oscillator [CC]The Relative Difference Of Squares Oscillator was created by Marco Alves (Stocks and Commodities Aug 2020 pg 10) and this is a heavily customized version of his indicator that works for single stocks instead of the entire market. I have included extra buy and sell signals to account for strong signals vs normal signals based on some user feedback I got. Buy when the line turns green and sell when it turns red. Keep in mind that this is a lagging indicator so good for trend confirmation.
Let me know if there are any other scripts you would like to see me publish!

Average Directional Index + ΔDI± (Delta)Average Directional Index (ADX) and Difference between DI+ and DI- (ΔDI±), I call it Delta for short.
The idea explained:
ADX is a common indicator for analysing trend strength. Values over 25 usually indicate the symbol is in "trend mode", meaning there is a lot of momentum, upwards or downwards, - while values under 25 suggest it is in "range mode", the price moves sideways, lacking energy. Note that this indicator is not volume-based.
I moved the graph (red) down 25 points; this version shows positive values in "trend mode" (>25), and negative values in "range mode" (<25). The line sits at 0. The underlying code for the ADX is basically identical to the official TradingView built-in version.
Now the exciting part: DI+ and DI- are used to calculate the ADX. They are sometimes included in the ADX indicator chart, I included a version that shows them in the graphic, at the bottom. Traditionally, DI+ (green) crossing DI- (dark red) from below shows the beginning of an upward trend, and therefore a good LONG entry position. However, I noticed that this is usually not the case: this method responds very slowly to the actual price movement. At the point the indicator tells you to enter, the trend is usually already exhausted.
I found a better way to use this data; instead of waiting for both graphs to cross, meaning the difference in their respective values is 0, we look for the greatest possible difference. That is what the purple graph of my indicator shows (ΔDI±). It utilizes the zero-line we already created for the ADX. High positive values declare that the DI+ is much greater than the DI-, and vice versa. Delta is the greek letter used in mathematics for difference, so that is what I call this indicator.
How to use it:
When you look at the graph, low Delta values seem to be good entry points for LONG positions, high Delta values good exits. This is similar to how RSI and CCI work, which is why included them in the chart above (). However, this is only reliable, when the ADX is above 25, or 0 in this version, indicating the symbol is in "trend mode". This is important .
When you look at the examples in the chart, you can confirm that. The marked candles show good entry and exit points, with Delta being notably low/high (±25 seems to be a good threshold, the dashed lines sit at +30/-30), and the ADX above 0 (25). Now, you might have noticed that around mid-december the Delta actually registers the highest value for this symbol in the given time frame, indicating a strong SHORT after a steep climb. But, importantly , the ADX is not in "trend mode" as required for a clear signal, it is in "range mode": the price discovers this new level and takes a few days to get used to it. It does not fall. This shows why only the combination of both Delta and ADX gives desirable results.
I noticed that this seems to work best for 1D and 1H candles; if you find any other time frames or scenarios, let me know!
PLEASE NOTE THAT THIS IS BASED ON PERSONAL, EMPIRICAL OBSERVATIONS. PAST RESULTS DO NOT GUARANTEE SUCCESS IN THE FUTURE. DO NOT TAKE THIS AS INVESTMENT ADVICE!
Thanks to TradingView and robertkowalski for providing the basis on which the code is built. Credit goes to the appropriate developers/owners.
()
Let me know if you make any other observations, or find other ways to use the data!

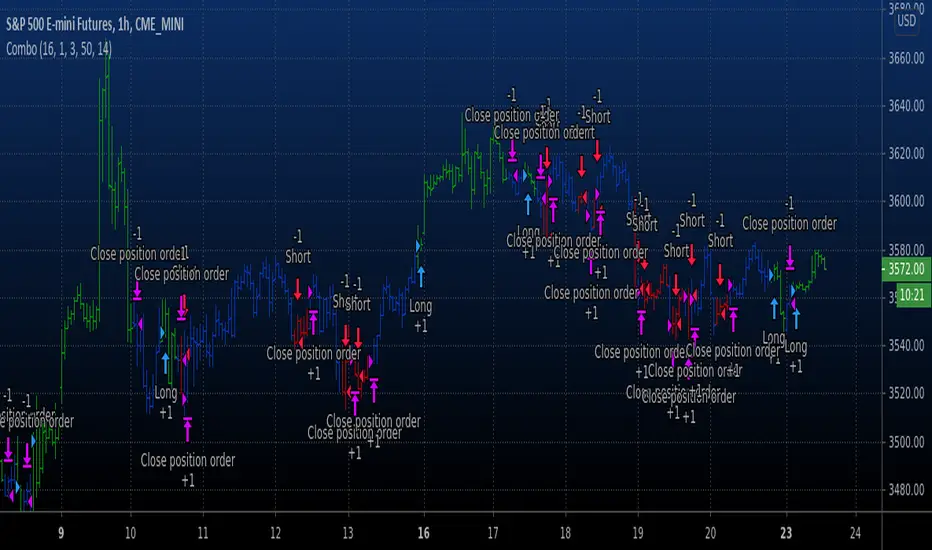
Combo Backtest 123 Reversal & High - EMA Strategy This is combo strategies for get a cumulative signal.
First strategy
This System was created from the Book "How I Tripled My Money In The
Futures Market" by Ulf Jensen, Page 183. This is reverse type of strategies.
The strategy buys at market, if close price is higher than the previous close
during 2 days and the meaning of 9-days Stochastic Slow Oscillator is lower than 50.
The strategy sells at market, if close price is lower than the previous close price
during 2 days and the meaning of 9-days Stochastic Fast Oscillator is higher than 50.
Second strategy
This indicator plots the difference between the High (of the previous period)
and an exponential moving average (13 period) of the Close (of the previous period).
You can use in the xPrice any series: Open, High, Low, Close, HL2, HLC3, OHLC4 and ect...
It buy if indicator above 0 and sell if below.
WARNING:
- For purpose educate only
- This script to change bars colors.
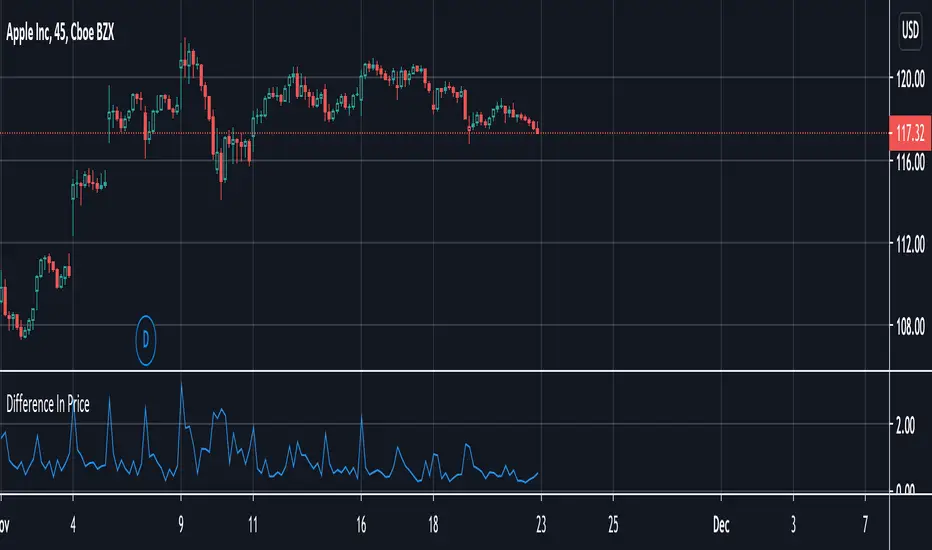
Difference In PriceWith the difference in price indicator, you can view price change volatility. Specifically, you can view the difference in price for a single candle segment, at any desired candlestick timeframe. This simply takes the sessions high minus the low and gives the difference. Difference in price trend lines help determine if a stock has a history of high volatility or not. This is useful for those looking to invest in stable stocks.
Volatility Bands by DGTVolatility represents how large an asset's prices swing around the mean price, the degree of variation of a trading price over time, and is commonly measured with beta (β) coefficients, standard deviations (σ) of returns where tools such as Average True Range, Bollinger Bands, Keltner Channel, Squeeze Indicator, etc presents volatility concept
Volatility often refers to the amount of uncertainty or risk related to the size of changes in a security's value. The higher the volatility, the riskier the security - the price of the security can change dramatically over a short time period in either direction. A lower volatility - security's value does not fluctuate dramatically, and tends to be more steady
This study, Volatility Bands , attempts to present a way to measure and visualize volatility , using standard deviations (σ) and average true range indicator, and aims to point out areas that might indicate potential trading opportunities
I will try to explain the usage with examples,
same setup with different option selected
as you may observe from the examples different setting may have advantages and disadvantages over one another, it is recommended to verify a trading setup with different available options.
Additionally, It is recommended to use this indicator in conjunction with other technical indicators, or verify using chart/candle patterns. Below is an usage example using in conjunction with other indicator, in the given example “Neglected Volume by DGT” is selected
Similarities and Differences
Bollinger Bands depicts two standard deviations above and below a simple moving average, and Keltner Channel depicts two times average true range (ATR) above and below an exponential moving average
Volatility Bands study combines the approach of both Bollinger Bands and Keltner Channel, with different settings and different visualization
Default settings are one standard deviations and one time average true range (ATR) above and below 13 period exponential moving average. Setting can be adjusted by users but let me remind all testes are performed with the default settings.
Mathematically expressed as
Upper band area between “ema + stdev” and “ema + atr”
Lower band area between “ema – stdev” and “ema – atr”
A different display is added with the inspiration I get from one of the @quantgym ‘s study, many thanks @quantgym 😉
When difference band display is selected the study will reflect the area between “ema + stdev – atr” and “ema – stdev + atr”. As shown in the examples above
Note: standard deviation calculation can be adjusted based on price action or its moving average.
Other differentiation between BB and KC is with V-BANDS mostly we look for trade opportunities when price action move out of the bands and in most cases we assume market is consolidating when the price action is within the bands
The other indicator that presents similarities to Volatility Bands is Squeeze Indicator, which measures the relationship between Bollinger Bands and Keltner's Channels to help identify consolidations and signal when prices are likely to break out. Mainly Volatility Bands is different version of Squeeze indicator, in fact the purpose is almost same but visualization is completely different. Additionally Volatility Bands Offers trading opportunities whereas Squeeze indicator only presents market states unless a momentum indicator is adapted to Squeeze indicator.
Disclaimer:
Trading success is all about following your trading strategy and the indicators should fit within your trading strategy, and not to be traded upon solely
The script is for informational and educational purposes only. Use of the script does not constitute professional and/or financial advice. You alone have the sole responsibility of evaluating the script output and risks associated with the use of the script. In exchange for using the script, you agree not to hold dgtrd TradingView user liable for any possible claim for damages arising from any decision you make based on use of the script

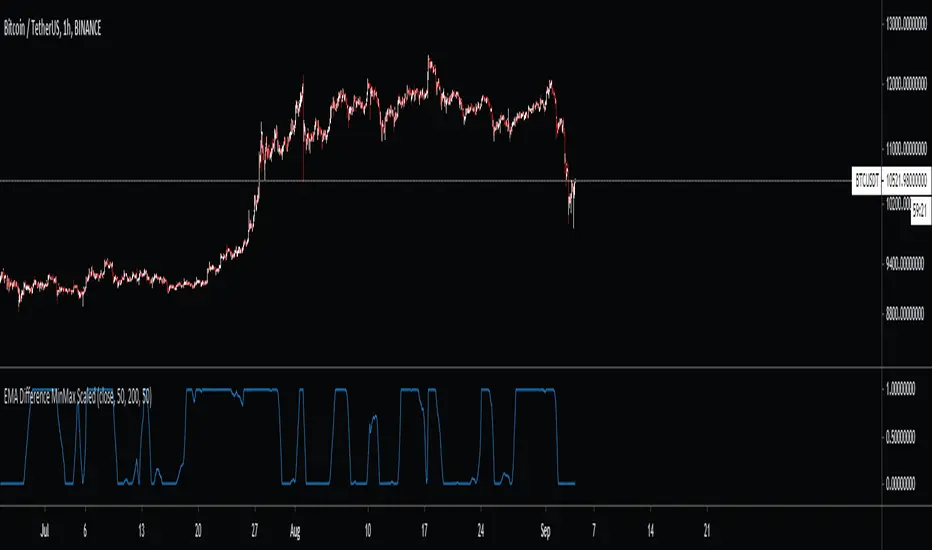
EMA Difference MinMax ScaledDifference between two EMAs and then transformed through a MinMax scaler
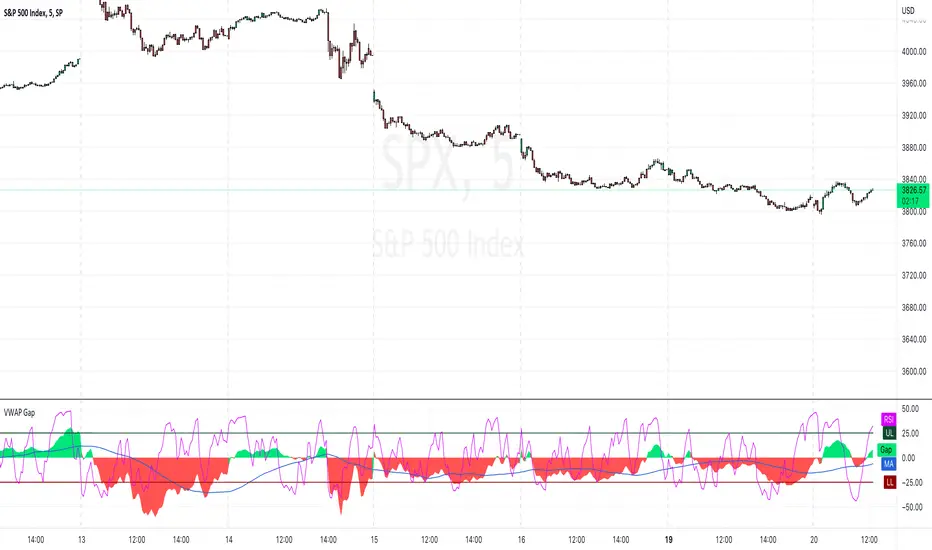
VWAP Gap [AR]This simple indicator measure the difference between price and VWAP line
The VWAP Gap indicator works best on intraday charts
SET-UP INFO
1. Add VWAP to your chart and set it up
2. Open "VWAP Gap Indicator" settings
3. Change source to "VWAP"
Enjoy!
Alex R.
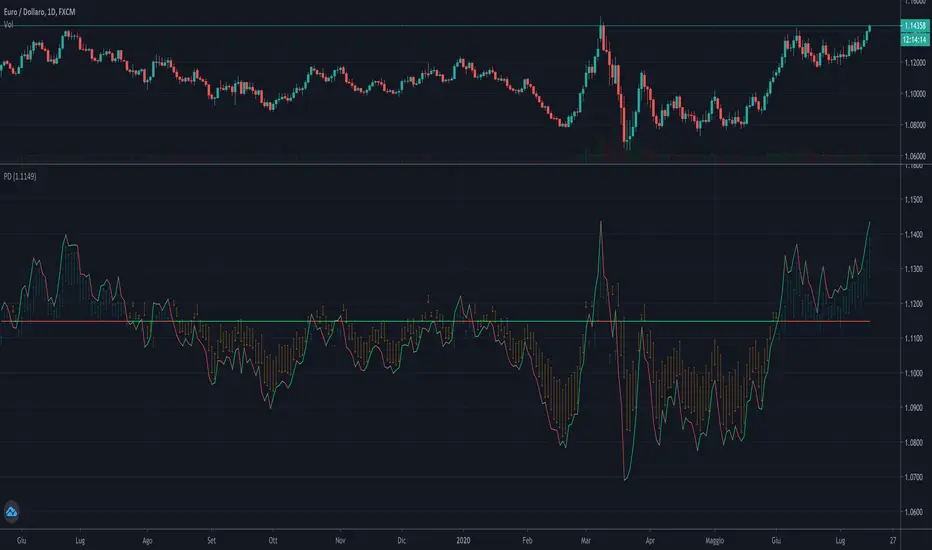
Difference of Exponentially Weighted AveragesImplementation of Difference of Exponentially Weighted Averages in Pine Script. It can generate a line that adjust to the overall trend of a graphic. The lines that are generated in a new plot are the the Difference of Exponentially Weighted Averages (blue) and it binarization over the previous values.
Exponentially Weighted Averages
This technique is used for generating smoother lines that adjust to a graphic. In finances, it is used to predict the overall trend of a graphic. The function that defines the EWA is the one bellow:
Vt = β V(t-1) + (1 - β) θt
Where:
β: Hyper-parameter that we have to adjust.
V(t-1): Value calculated for the previous element of the graphic.
θt: Current element of the graphic.
The calculus of differences consist in subtract to each value the previous values.

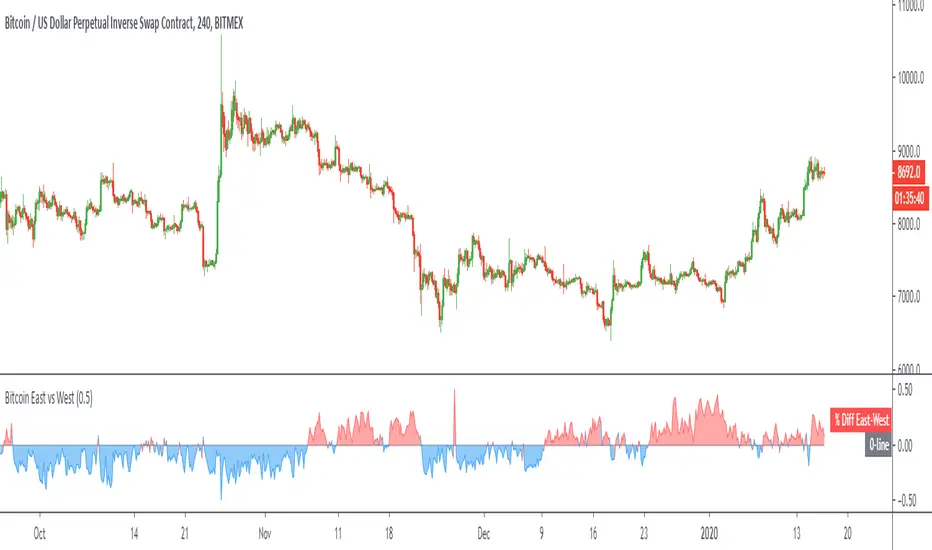
Bitcoin East vs WestPlots the volume weighted price difference between the top spot exchanges in the "East" (Asian markets) versus the "West" (US/UK/EU markets).
Optional: view the volume difference between the two.
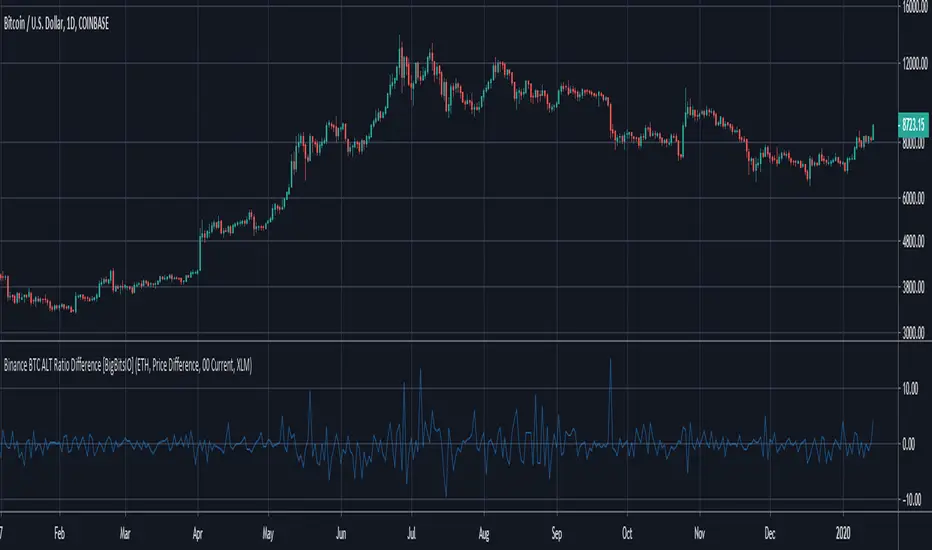
Binance BTC ALT Ratio Difference [BigBitsIO]This was a follower suggested script. This script compares the USDT and BTC relative prices of a particular altcoin traded on Binance by calculating it's USDT price comparative to BTC. This is a very simple calculation (ALT/USDT price divided by ALT/BTC price). From there, we simply subtract the BTC/USDT price from the ALT ration price and we can see if a coin is trading comparatively high or low compared to it's BTC relative price.
This indicator may or may not be useful for you. However, for the purposes of my development series for indicators, I have published it to highlight the ability to concatenate strings to manipulate securities.
Features:
- Dropdown to choose from several built-in altcoin selections.
- Dropdown to choose to show a USDT base difference in the ratio, or a percentage based difference (might be useful for considering fees).
- Dropdown to choose the resolution of the indicator.
- Checkbox to toggle the option to use a custom altcoin.
- Text input to allow entry of a custom altcoin from Binance. Please only use the prefix on its trading pair vs. BTC. I cannot guarantee this will work with all altcoins. They must be traded vs. USDT and BTC on Binance.
- Concatenated strings to manipulate selected securities.
*** DISCLAIMER: For educational and entertainment purposes only. Nothing in this content should be interpreted as financial advice or a recommendation to buy or sell any sort of security or investment including all types of crypto. DYOR, TYOB. ***
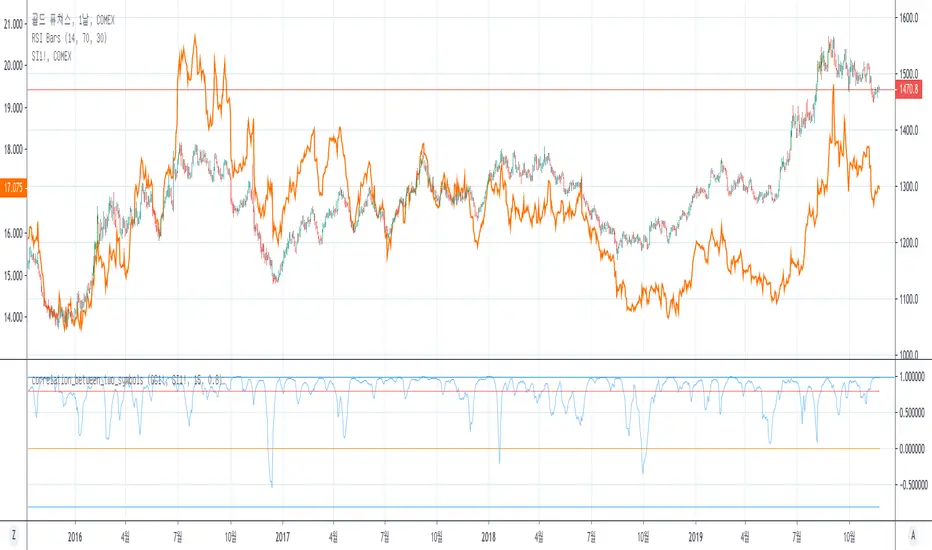
correlation_between_two_symbolsCorrelation between two symbols.
Notice: you can find more useful indicators by searching 'between_two_symbols'