Divergence of Stocks Above MA50 v.s. US-Stock MarketEnglish:
This indicator has been developed as an early warning tool to estimate the probability of correction in the US stock market. It works best in the daily chart.
Function:
1.) "Index-line"
The underlying stock index is converted to a scale between 0% and 100% based on its 52-week highs and lows. Where 100% is closing price at 52-week high and 0% is closing price at 52-week low.
2nd) "Stocks Above MA50".
For each major stock index, there is an index that determines the percentage of stocks above its 50 moving average. For example, for the S&P 500, this is the S5FI.
3) "Divergence
In an efficient market, both lines (index and number of stocks above the 50 MA) would run more or less in sync. A new high in the index would also mean a new high in the stocks trading above the 50 moving average. Often, however, a correction in the index is announced when the number of stocks trading above their 50 MA do not make a new, or even a lower, high while the underlying index marks a new high. The divergence signal measures this divergence of the indices. The higher the bar, the more pronounced the divergence.
How to read the indicator?
If a divergence occurs, then the stops should be tightened. As with any indicator, false signals can occur because a divergence does not automatically lead to a correction. The higher the divergence is indicated, the higher the probability. The strength of a correction cannot be predicted with the indicator.
For which symbols does the indicator work?
The indicator works exclusively for the following symbols:
S&P500: SPX, SPY, ES1!, US500 Index above MA50: S5FI
Russel2000: IWM, US2000, RTY1!, RUT, IWO Index above MA50: R2FI
NASDAQ100: NDX, NAS100, NQ1!, US100, QQQ Index above MA50: NDFI
NASDAQ: IXIC, ONEQ, QCN1!, NDAQ Index above MA50: NCFI
NYSE: XAX, NYA Index above MA50: MMFI
DowJones100: DJX, DJI, DIA, MYM1!, YM1! Index above MA50: DIFI
DowJonesComp: DOW, IYY Index above MA50: DCFI
Deutsch:
Dieser Indikator ist als Frühwarninstrument zur Einschätzung der Korrekturwahrscheinlichkeit im US-Aktienmarkt entwickelt worden. Er funktioniert am besten im Tages-Chart.
Funktion:
1.) „Index-line“
Der zugrunde liegende Aktienindex wird bezogen auf seine 52Wochen Hochs und Tiefs in eine Skala zwischen 0% und 100% umgerechnet. Dabei sind 100% Schlusskurs auf 52-Wochen Hoch und 0% Schlusskurs auf 52-Wochen Tief.
2.) „Stocks Above MA50“
Zu jedem Hauptaktienindex gibt es einen Index, der den Prozentwert der Aktien über Ihrem 50 gleitenden Durchschnitt ermittelt. Beim S&P 500 ist das z.B. der S5FI.
3.) „Divergence“
In einem effizienten Markt würden beide Linien (Index und Anzahl Aktien über dem 50 MA) mehr oder weniger synchron laufen. Ein neues Hoch im Index würde auch ein neues Hoch bei den Aktien, die über dem 50 gleitenden Durchschnitt notieren, bedeuten. Oft jedoch kündigt sich eine Korrektur im Index an, wenn die Anzahl der Aktien, die über ihrem 50 MA notieren kein neues, oder sogar ein niedrigeres Hoch machen, während der zu Grunde liegende Index ein neues Hoch markiert. Das Divergenz-Signal misst diese auseinanderlaufen der Indices. Je höher der Balken, umso stärker ist die Divergenz ausgeprägt.
Wie ist der Indikator zu lesen?
Wenn eine Divergenz auftritt, dann sollten die Stopps enger herangezogen werden. Es kann wie bei jedem Indikator zu Fehlsignalen kommen, da eine Divergenz nicht automatisch zu einer Korrektur führen muss. Die Wahrscheinlichkeit ist um so höher, je höher die Divergenz angezeigt wird. Die Stärke einer Korrektur kann mit dem Indikator nicht prognostiziert werden.
Für welche Symbole funktioniert der Indikator?
Der Indikator funktioniert ausschließlich für folgende Symbole:
S&P500: SPX, SPY, ES1!, US500 Index über MA50: S5FI
Russel2000: IWM, US2000, RTY1!, RUT, IWO Index über MA50: R2FI
NASDAQ100: NDX, NAS100, NQ1!, US100, QQQ Index über MA50: NDFI
NASDAQ: IXIC, ONEQ, QCN1!, NDAQ Index über MA50: NCFI
NYSE: XAX, NYA Index über MA50: MMFI
DowJones100: DJX, DJI, DIA, MYM1!, YM1! Index über MA50: DIFI
DowJonesComp: DOW, IYY Index über MA50: DCFI
Divergences

QF OBVMQF OBVM calculates momentum using Ehler's dominant cycle and derived from the on balance volume. It provides oversold and overbought levels and suggests mean reversion as well as divergences and momentum shift detection.

Divergence Indicator with alertsFirst time I've published a script so go easy!
All credit goes to @yatrader2 for the script, I have just made it easier to set alerts on it.
Enjoy!

BOSCILLATOR. A BOSS OSCILLATORI would like to first say I do not the indicator pieces. Would like to personally give thanks and credit to @MarkBench for coding this indicator and helping to get my vision for this system finally able to be published and used by anyone. I would also like the thank @lazy bear and @ChrisMoody for their bringing the Firefly oscillator and the SCHAFF TREND and the PPO price percentage oscillator to trading view. and @scilentor for his version of Godmode with LSMA . Thanks to @Shizaru for bringing Frama moving average (which we have adopted into the PPO as one of the base selections for the first time, as well as the ALMA ). Divergences have also been added. and components of the firefly have been removed such as the histogram. I have added two oscillators in the picture. The bottom is the standard settings. The above is how I prefer mine to look after tweaking the settings.
Before I get into explaining how its used. I want to say all the indicators are open and none privately owned or at least owned by indivduals who brought them to trading view. Any due permission is granted at my disclocsure. I also want to say this is not your typical mashup of indicators as the is a very clear way to view and use this specifically. Also I want to say original tools from their original scripts are also improved. For example the PPO being used we have added the FRAMA and ALMA moving average basis option which it did not have before. And now everything has clear divergences and some other minor changers. but here are the rules and examples.
THE BOSCILLATOR - A MULTI-LEVEL CONFLUENCE/CONFIRMATION FILTER VISUALIZATION
Some shorthand
(Main oscillator - firefly)
(background wave thing - PPO )
(the red vertical up and down line with red and green dots - STC )
(the blue, yellow and red dots - warning dots)
WHO IS THIS INDICATOR FOR? - This indicator itself is not meant to be a signal giver to buy or sell right now even though it could be and some of the original scripts are used as such. This indicator is actually meant to be a VISUAL CONFIRMATION & FILTER for trades taken in other methods outside of this indicator. What are some of those methods that may benefit from having this? Pivot point traders, FIB traders, Bollinger band traders, Moving average traders.. just to name a few. This indicator itself is meant to in a quick glance allow the trade to see the condition of many different elements outside of the main price and chart, and determine if that trade looks like it has too much risk, or if that trade looks suitable. It also provides a series of confirmations that could be used for adding to a position at different levels at the trade's discretion.
OPTIMAL CONDITIONS FOR CONSIDERING A SHORT = The PPO is orange/red + the STC is at the TOP + the Firefly is above the midline. The warning dots are being printed at the top. There is regular or hidden bearish divergence present.
OPTIMAL CONDITIONS FOR CONSIDERING A LONG = The PPO is light/dark green + the STC is at the BOTTOM + the Firefly is below the midline. The warning dots are being printed at the bottom. There is regular or hidden bullish divergence present.
Triggers for scaling/adding into your position = Keeping in mind that this oscillator on its own is not meant to be the sole reason for taking a trade, here are some triggers you will see for getting into position (preferably with the optimal conditions being met) The firefly flips from a green line into a red slide and vise versa. The firefly crosses the midline up or down. The STC begins going up/down and triggers a green or red dot while crossing one of the levels at 20 or 80. The warning dots being made begin to be printed lower/higher than the dot before last. The PPO shift from one color to the next in the favored direction of the trade you wish to make.
Signs for taking profit and protecting your trade = The Dots begin to print, the PPO changes colors at the top or bottom. the STC arrived are the top.
FILTER SITUATIONS TO AVOID TRADES = Wise to not take a trade if the PPO and the firefly do not agree. For example - if the PPO is showing green yet the firefly is still red may be an indication that it is getting a bit late for you to enter the trade. Same with opposing divergences and warning dots contradicting the trade you are looking at. The STC being already on the bottom or top may be a small indication that trade may already have been a little too ripe, but on its own is not always the case.
When selecting the PPO settings and moving average you are going to want it to be in favor of what you are trying to accomplish.IF you are one low time frames and trying to swing or scalp trade... chances are you want a reactive MA setting that iss responsive. Iwould recommend the HULL, ALMA, TEMA DEMA. For the Higher time frame the EMA or the T3 WDma can be wuite patient and helpful for a constant reminder of caution
Some notes - for the swing and scalp trading... in my experience the PPO moving average basis sees more responsive changes with the FRAMA , ALMA , HULL settings. for entering a trade, at least a couple of your triggers being present increases the success rate by a lot.
This chart illustrates the usefullness of having a Zero lag function for the firefly. The firefly should not be taken for signals or trades itself. However it is the most precise finder of divergences within the system. It is aways good to flip on and off zero lag just to take a quick look for divergences you might have mixed.
In this chart illustrates the general visual look and order of events to guide you along your way. Starts with the PPO turning green or red or orange which is potentially time to get out of your current trade. Then it switched colors when reversal begins and that is when you want to at the same time see the STC, the firefly, and lower caution dots coming in around the same area (highlighted in blue squares). Now near the end you see a red box. This is a filter aspect. The PPO is green, yet the others are saying down/short. This does not mean it must be a long, however it is great warning to maybe avoid getting to bearish for the downside in that time. You want the PPO and line up with the others and it should be visually apparent that they all want to go the same way.
Here is a list of some key elements (before changes this script made) of parts this oscillator includes. My original publication of my oscillation setup was blocked by the mods here.. this one however includes a large variety of items that have been altered from their original formats and a well-explained trading system to use it with.
// Firefly
Firefly Oscillator
// PPO
PPO PercentileRank Mkt Tops & Bottoms (@PuppyTherapy)
// Divergence
Divergence Indicator (any oscillator)
// Godmode
Godmode3.2+LSMA
// Schaff
Schaff Trend Cycle
// Frama
(FRAMA) Fractal Adaptive Moving Average

Market Flow IndicatorHOW IS THIS INDICATOR DIFFERENT ?
This is a forked and even simpler version of the premium indicator Trend Volume RSI Analysis . Please, read its description on my profile page so that you can understand what changes have been made here and why.
Although in Trend Volume RSI Analysis you have only one parameter to configure (length), you need to choose between 3 options for the analysis - Trend, Volume, or RSI. You also have an option to highlight the buy and sell zones. For me, this is a lot of switching. Alternatively, if I want to see the whole picture, I have to apply the indicator twice or even three times, which limits the space on my screen for the candlestick chart. However, a lot of work has gone into creating that indicator and it works great. If it isn't broken, why fix it, right?
So, I forked Trend Volume RSI Analysis and modified some of the formulas, as well as effectively combined the Trend and the RSI parts into one simpler indicator. No more switching. Also, the Buy and Sell colors change based on crossovers. No more zones either.
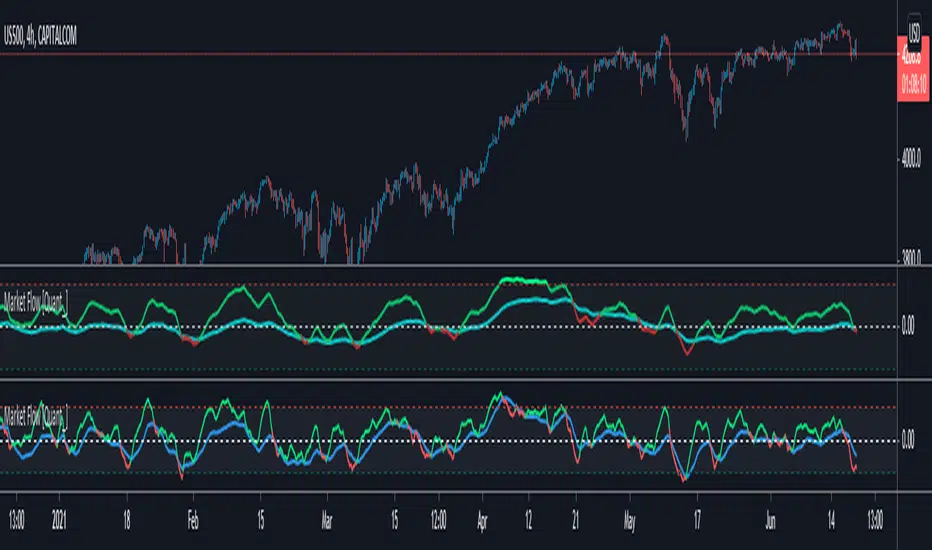
WHAT DOES THIS INDICATOR DO ?
Market Flow Indicator shows two things - price direction (blue line) and momentum (green line). In the first screenshot below the indicator is applied to the 1h chart of SPX500 to show direction and on the second screenshot I use a 1h chart of BTC/USD in which you notice divergence, formed as a result of exhausted momentum. The indicator works equally well with cryptocurrencies, indices, commodities, and currency pairs.
The line colored in green and red is a modified RSI and the blue line is called Momentum (those are their names for now, but please check the updates below if anything has changed). Their colors are configurable in the settings panel.
In order to standardize the numbers without any modifications to the formulas, the RSI numbers are brought down by 50. In other words, the equivalent of an RSI overbought extreme (100) is 50 in the Market Flow Indicator, and the equivalent of an oversold extreme (0) is -50 in this indicator. Default lines here are set at 25 and -25, which are the equivalent of 75 and 25 respectively.
That's pretty much it. The idea behind Market Flow Indicator was to be super simple and to be used with minimum configuration if any at all. Once you get a grasp of it, it shouldn't take you more than a few seconds to know if you should stay flat or look for a long/short position.
HOW MUCH DOES IT COST ?
Although this may look like a simple indicator, I have spent a great deal of time testing and optimizing it to achieve this level of simplicity and practicality. Also, I will continue to update Market Flow Indicator as well as introduce user-requested features if they will improve its overall performance. For these reasons, this is a paid indicator, but I do give a free trial so that you can test it out for yourself. If you want to gain access, please use the provided information below or just message me. Thank you for your time.
Disclaimer: The purpose of all indicators is to indicate potential setups, which may lead to profitable results. No indicator is perfect and certainly, no indicator has a 100% success rate. They are subject to flaws, wrongful interpretation, bugs, etc. This indicator makes no exception. It must be used with a sound money management plan that puts the main emphasis on protecting your capital. Please, do not rely solely on any single indicator to make trading decisions instead of you. Indicators are storytellers, not fortune tellers. They help you see the bigger picture, not the future.
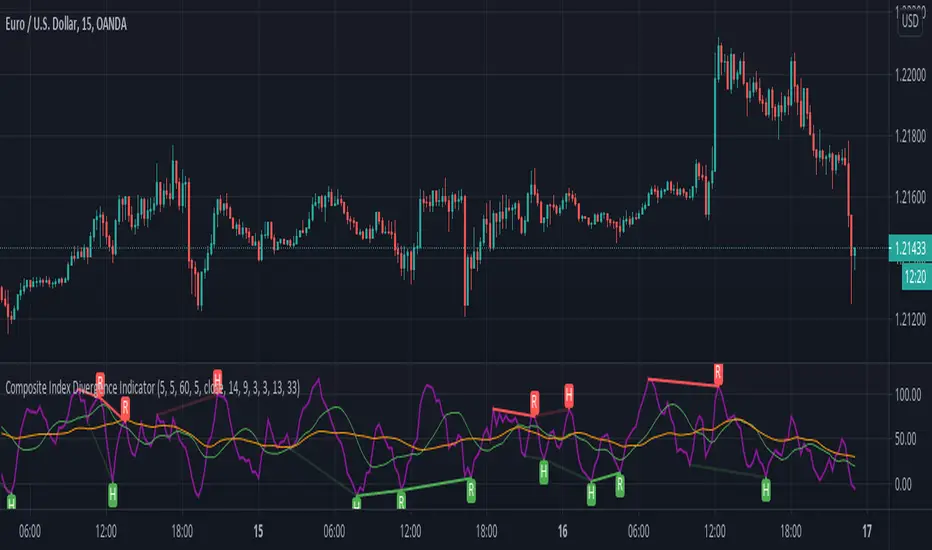
Composite Index Divergence IndicatorComposite Index by Constance Brown mixed with built-ins Divergence Indicator
useful indicator to find divergence
this script find divergence automatically for you
(VIP) MACD & Stochastic Alignment Oscillator v2Oscillator is combining MACD with Stochastic oscillator. When both, MACD and Stochastic are aligned with direction of trend, it improves probability and strength of such signal. There's possibility to also activate second Stochastic as additional confirmation of the signal. One of winning setup is to keep MACD settings standard - 12,26,9 and both Stochastics with slightly longer settings - 14,7,7 & 21,14,14. Figures at top are displaying trend coming from MACD . Background is coloured when all signals are aligned. Stochastic is generated signal only if it travelled back recently from overbought/oversold zone - this improves reliability of generated signals.
Alerts are included to inform when trend is aligned.
If you're interested in access for oscillator, please DM me on Tradingview.com ;)

Simple PVT Strength Spotter™TradeChartist Simple PVT Strength Spotter is a modified version of Price Volume Trend visualised using Relative Strength and helps spot price trends using visually engaging and appealing PVT Strength Oscillator plot and background. The Bull and the Bear background fills are highly useful for traders who like to visually understand areas of entry/exit based on PVT Strength and Oscillator Highs and Lows help spot Bull and Bear Divergences.
===================================================================================================================
What does Simple PVT Strength Spotter do?
Plots PVT Strength with visually engaging colours for Bull and Bear zones (Green and Red).
Plots PVT Strength coloured bars on main chart based on user preferred Upper and Lower PVT Strength bands (Default - 5/-5).
Plots PVT Strength based on EMA smoothing (1 for Regular PVT Strength without smoothing).
Plots Heikin Ashi PVT Strength if enabled from indicator settings.
Plots PVT Strength highs of Bull Zone and PVT Strength lows of Bear Zone. Helps visually spot divergences.
===================================================================================================================
Note:
Default Settings:
7 period PVT Strength using 5 EMA Smoothing.
For Heikin Ashi PVT Strength on normal bars, enable ᴜsᴇ ʜᴇɪᴋɪɴ ᴀsʜɪ PVT Sᴛʀᴇɴɢᴛʜ .
Works only on symbols that have Volume data.
===================================================================================================================

[TrustedSignals] Oscillator DivergencesDivergences are powerful tools that assess the price momentum and the likelihood of a price reversal. A positive divergence occurs when the price of an asset makes a new low while an oscillator, starts to climb. Conversely, a negative divergence is when the price makes a new high but the oscillator analyzed makes a lower high.
Once again, with the idea of providing an All-in-One indicator, this script can display the Divergences in up to 9 most used oscillators (RSI, Stochastic RSI, Stochastic, Williams%, MFI, ChangeMO, CCI, BB %B) including our own branded no-lag ‘ TS Oscillator ’
We have also included an optional custom no-lag smoothing function, that allows the user to smooth out the noise on all the oscillators and increase their accuracy, without delaying the actual data. This feature can be turned off if necessary and the smoothing length can be manually adjusted.
After the user selects from the first input the desired oscillator, the indicator can display Regular and Hidden Divergences on the chart.
The lookback period of the divergences is also fully configurable, as the settings for each of our individual oscillators.

TradeChartist Plotter™TradeChartist Plotter is an extremely useful and adaptive indicator that connects to any oscillator to plot highs and lows, Divergences and also Bull and Bear Zones based on the Oscillator and user input to filter zones. When plotted as normal or Heikin Ashi price bars/candles, the divergences can be plotted on price bars and in addition ™TradeChartist MA Visualizer can be plotted and used to filter trade zones derived from the Oscillator connected.
===================================================================================================================
™𝗧𝗿𝗮𝗱𝗲𝗖𝗵𝗮𝗿𝘁𝗶𝘀𝘁 𝗣𝗹𝗼𝘁𝘁𝗲𝗿 𝗨𝘀𝗲𝗿 𝗠𝗮𝗻𝘂𝗮𝗹
===================================
To connect an oscillator to ™TradeChartist Plotter, follow the steps below.
From the ╔═══ 𝗣𝗹𝘂𝗴 𝗢𝘀𝗰𝗶𝗹𝗹𝗮𝘁𝗼𝗿 ═══ 🔌 dropdown, choose the Oscillator plot which is active on the chart.
Choose the Oscillator Smoothing factor if smoothing is not available on the original oscillator plot by using the Osᴄɪʟʟᴀᴛᴏʀ Sᴍᴏᴏᴛʜɪɴɢ input box.
Enter Upper and Lower Bands for the Oscillator plot that helps detect Highs/Lows, Divergences, Trade Zones etc. by using the Uᴘᴘᴇʀ Bᴀɴᴅ and Lᴏᴡᴇʀ Bᴀɴᴅ input boxes. For example, for oscillators like RSI, bands can be 60/40 or 70/30 or even 50/50 to help filter highs/lows on Oscillator and the main price chart based on Oscillator values above Upper Band and Oscillator values below Lower Band.
Osᴄɪʟʟᴀᴛᴏʀ Bᴀsᴇ Lɪɴᴇ is required especially for Oscillators that don't have 0 as its base line. For example, RSI, Stochastic etc. oscillate between 0 and 100. For Oscillators like these, a base line value is really useful on ™TradeChartist Plotter especially to detect Divergences, Highs/Lows, Trade Zones and even to plot the Oscillator as a Histogram or Area plot.
Pʟᴏᴛ Bᴀsᴇ Lɪɴᴇ ᴀɴᴅ Bᴀɴᴅs plots base line and the bands if Oscillator plot is chosen.
There are three plot types under Pʟᴏᴛ Tʏᴘᴇ and they are
══ Plot Oscillator - This option plots the connected Oscillator
══ Plot Price Candles - This option plots price candles and if overlaid on main chart, Highs/Lows, Divergences etc can be visualized along with ™TradeChartist MA Visualizer if enabled.
══ Plot Price Bars - This option plots price bars and if overlaid on main chart, Highs/Lows, Divergences etc can be visualized along with ™TradeChartist MA Visualizer if enabled.
Pʟᴏᴛ HA Cᴀɴᴅʟᴇs/Bᴀʀs plots Heikin Ashi candles/bars. It doesn't affect the Oscillator plot or in anyway alter the Oscillator plot.
Pʟᴏᴛ Sᴛʏʟᴇ dropdown has three types of styles - Line, Histogram and Area plot styles for the Oscillator plot.
Pʟᴏᴛ Pʀɪᴄᴇ Hɪɢʜs ᴀɴᴅ Lᴏᴡs plots the price highs and price lows corresponding to the Bull and Bear zones of the Oscillator connected.
===================================================================================================================
╔═════════ 𝗠𝗔 𝗩𝗶𝘀𝘂𝗮𝗹𝗶𝘇𝗲𝗿 ═════════╗
MA Visualizer is a powerful and very useful original ™TradeChartist visual method to plot Moving Averages of the close price of the security for user specified look back period in a visually appealing style in the form of colour coded bands. MA Visualizer not only helps the trader spot the price action of the security relative to the moving average, but also paints a visual picture of the trend strength, which must be seen and used on chart to appreciate its elegance. One of 15 different types of Moving Averages can be used to visualize the price action.
Activate 𝗠𝗔 𝗩𝗶𝘀𝘂𝗮𝗹𝗶𝘇𝗲𝗿 and choose the MA type from MA Vɪsᴜᴀʟɪᴢᴇʀ Tʏᴘᴇ dropdown and entering the lookback period in MA Vɪsᴜᴀʟɪᴢᴇʀ ᴘᴇʀɪᴏᴅ input box.
MA Visualizer colour theme can be be changed from MA Vɪsᴜᴀʟɪᴢᴇʀ Cᴏʟᴏʀ Sᴄʜᴇᴍᴇ dropdown.
The faster of the two set of bands that form the MA Visualizer reacts to price action faster and can be clearly seen from its change of colour from Bull Colour to Bear Colour or vice-versa earlier than the slower set of bands. The fill colour between the bands also helps the user stay in a trade or exit a trade based on other confirmators.
Enabling Dᴀᴢᴢʟɪɴɢ Vɪsᴜᴀʟɪᴢᴇʀ makes the Visualizer dazzle. Uncheck this option for normal view of MA Visualizer.
𝐔𝐬𝐞 𝐌𝐀 𝐕𝐢𝐬𝐮𝐚𝐥𝐢𝐳𝐞𝐫 𝐚𝐬 𝐓𝐫𝐚𝐝𝐞 𝐅𝐢𝐥𝐭𝐞𝐫 filters the trade zones based on MA Visualizer's trend agreeing with the Oscillator trend. Fɪʟᴛᴇʀ Eᴀʀʟʏ Vɪsᴜᴀʟɪᴢᴇʀ Bʀᴇᴀᴋᴏᴜᴛs filters the trades based on faster MA Visualizer plot's trend.
Also, enabling Pʟᴏᴛᴛᴇʀ Bᴀᴄᴋɢʀᴏᴜɴᴅ Fɪʟʟ under 𝗨𝘀𝗲𝗳𝘂𝗹 𝗘𝘅𝘁𝗿𝗮𝘀 helps detect the trade zones with or without the MA Visualizer filter enabled.
===================================================================================================================
╔═══════ 𝗗𝗶𝘃𝗲𝗿𝗴𝗲𝗻𝗰𝗲𝘀 ═══════╗
Plotter detects both Regular and Hidden Bullish (in a Bear Zone) and Bearish Divergences (in a Bull Zone) at every occurence based on the Oscillator connected. This can be filtered by the use of filtering by Upper and Lower Band values in the Oscillator section. Divergences can also be plotted on price bars based on Pʟᴏᴛ Tʏᴘᴇ .
To plot divergences, enable 𝗗𝗶𝘃𝗲𝗿𝗴𝗲𝗻𝗰𝗲𝘀, Sʜᴏᴡ Rᴇɢᴜʟᴀʀ Dɪᴠᴇʀɢᴇɴᴄᴇs and Sʜᴏᴡ Hɪᴅᴅᴇɴ Dɪᴠᴇʀɢᴇɴᴄᴇs .
Users can further filter Divergences by entering the number of bars to the right in Rɪɢʜᴛ ʙᴀʀs ғᴏʀ Pɪᴠᴏᴛ Cᴏɴғɪʀᴍᴀᴛɪᴏɴ input box to confirm the Price Pivot (for Regular divergences) and Oscillator Pivot (for Hidden Divergences).
Note: Divergences can not be traded at every instance or as a standalone indicator. It just indicates a possibility of strength exhaustion and should not be trusted during a trending market. Higher smoothing (done sensibly) also filters divergences. Divergence can be a strong confirmator once a reversal is detected. For example, using MA Visualizer can help confirm a divergence and vice-versa to identify the trend changes. This means that the confirmations may happen after a few bars since the divergence in agreement with the MA Visualizers trend change.
The example chart of 4hr BTC-USDT chart shows the Divergences filtered by use of RSI 60/40 bands, MA Visualizer and Regression channel trends. It is important to note that the trend intensity colour on the plot and bars (if bar colour option is enabled) will help detect if the Divergence would hold.
===================================================================================================================
╔═══════ 𝗨𝘀𝗲𝗳𝘂𝗹 𝗘𝘅𝘁𝗿𝗮𝘀 ═══════╗
Pʟᴏᴛᴛᴇʀ Bᴀᴄᴋɢʀᴏᴜɴᴅ Fɪʟʟ - Plots background fill based on Bull and Bear Zones based on the Oscillator connected and the filters used.
Plotter offers two vibrant Colour Themes, namely Chilli and Flame , which can be opted from Pʟᴏᴛᴛᴇʀ Tʜᴇᴍᴇ dropdown. These themes also offer the option to plot the trend intensity on the price bars as bar colours by enabling Cᴏʟᴏᴜʀ Bᴀʀs . Bar colors can also be inverted using Iɴᴠᴇʀᴛ Bᴀʀ Cᴏʟᴏᴜʀ option.
Users can also choose to use the Simple theme and choose preferred colours from Sɪᴍᴘʟᴇ Tʜᴇᴍᴇ ʙᴜʟʟ Cᴏʟᴏᴜʀ and Sɪᴍᴘʟᴇ Tʜᴇᴍᴇ ʙᴇᴀʀ Cᴏʟᴏᴜʀ colour input.
Note : The indicator does not repaint and can be confidently used for alerts and trade entries without worrying about plots disappearing after bar close.
===================================================================================================================
Example Charts
1. EUR-USD 15m chart with 3 Plotters on chart, 1 with ™TradeChartist MDO , 1 on main chart and 1 HA Bar chart showing various ways of plotting highs/lows, divergences and Trade zones using 55 period LSMA MA Visualizer.
2. XAU-USD 15m chart with Chande Momentum Oscillator connector to Plotter with 200 period SMA Visualizer used as Trade Filter.
3. LINK-USDT 1hr chart with ™TradeChartist Risk Meter connected to Plotter with 144 period Hull MA Visualizer as Trade filter on Main chart with Divergences plotted based on Risk Meter Volatility Risk Oscillator.
4. Example 3 above with Plotter's Trend Identifier connected to ™TradeChartist Plug and Trade as Oscillatory Signal with Past performance and trades plotted.
===================================================================================================================
Best Practice: Test with different settings first using Paper Trades before trading with real money
===================================================================================================================
This is not a free to use indicator. Get in touch with me (PM me directly if you would like trial access to test the indicator)
Premium Scripts - Trial access and Information
Trial access offered on all Premium scripts.
PM me directly to request trial access to the scripts or for more information.
===================================================================================================================

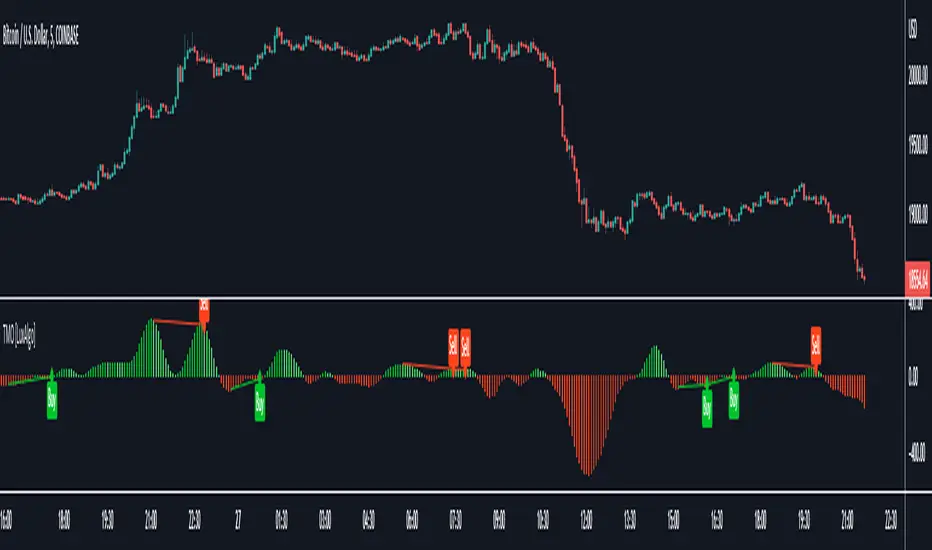
Triangular Momentum Oscillator & Real Time Divergences [LuxAlgo]Oscillators are widely used in technical analysis and can return a large amount of information to the trader depending on their design. It is common to use oscillators to detect divergences with the price, divergences occur when the tops/bottoms made by the oscillator and price are negatively correlated.
The following oscillator is based on the momentum of a triangular moving average, hence the name "triangular momentum" because of the very smooth property of the triangular moving average, we aimed at a real-time detection of divergences instead of using more common methods such as relying on pivot high/low detection which are suitable for more noisy oscillators.
The oscillator can also be colored based on a gradient derived from the correlation between its output and the price which can be useful to detect when the oscillator is out of phase (significantly lagging or leading the price).
Settings
length : Period of the oscillator, higher values return a smoother output.
src : Input source of the indicator.
Show Lines : Show lines connecting the current top/bottom with the previous one made by the oscillator when a divergence is detected. True by default.
Color Based On Price/Oscillator Correlation : Allows the color of the oscillator to change based on its correlation with the price, with red colors suggesting a negative correlation.
Usages
The advantage of having a smoother oscillator for divergences detection is that it can be done in real-time since a top or bottom is present when the oscillator first difference cross 0. Smoother oscillators are also easier to interpret, however, they will still suffer from lag.
The divergences detected by the oscillator are regular divergences, where the oscillator leads price variations.
Using higher values of length allows the oscillator to filter out longer-term variations thus being smoother as a result.
By using the color mode based on the price/oscillator correlation we can see where the oscillator leads or lag the price, and since divergences are based on the price and oscillator going in the opposite direction we can have information where price might reverse.
It is also possible to interpret the oscillator without relying on the divergence detection, with a decreasing value of the oscillator indicating a downtrend and an increasing value indicating an uptrend.
Divergence Indicator (any oscillator)A modification of the TV builtin "Divergence indicator" (Version 10) that can be applied to any indicator, and can be plotted on price as well.
Usage:
Add your favorite oscillator, RSI, Klinger, TSI, CMF, or anything else to a chart.
Click the little ... (More) on the oscillator.
Then add this indicator "Divergence Indicator (any oscillator)" on your oscillator of choice.
Click the settings on this indicator and make sure the source is set to the right plot from your oscillator.
Watch for it to plot divergences...
Add this indicator a second time on the price chart (and select the same oscillator plot), but check the box "plot on price (rather than on indicator)""
See you divergence plotted on price (as well as on the oscillator)

Bolinger strategy v1Find lows based on divergence on bollinger bands.
Works great on stocks and index, no success on forex.
Different stock/index requires different values.
Exit is not perfect, often on the safer side.
Example settings: NASDAQ:OMXS30, 30m: 25 0.452 0.42 0.453 2 62 20
Lower bbrower = buys harder dips, too low will cause buy during fall.
Higher bbrhigher = buys on lower dips

Trend Lines Pro for IndicatorsHello Traders!
We need to make things better & better to solve the puzzle and I try to do my best on this way. now I am here with my new Trend Lines Pro for Indicators script.
As you know, Trend Lines is very subjective and many people (even professionals) draw different Trend Lines on the same chart. This is confusing and there must be an automation to make the life easer. with this tool I tried to automate it.
The idea in this script is different from my previous trend lines scripts. In this, I use channel idea so it can check number of pivot points it contains. it also checks the angle while choosing trend lines. then we get stronger and useful Trend Lines automatically.
There are some option in the script, let see one by one:
Indicator: the indicator on which you want to see Trend lines, Predefined Indicators are: RSI, CCI(Commodity Channel Index), OBV(On-Balance Volume), Momentum, MACD, CMF(Chaikin Money Flow), External Indicator
External Indicator: with this option you can use other indicators as input and get trend lines for them.
- First add an indicator (such as MFI)
- in "Indicator" option select "External Indicator"
- click "External Indicator" option
- and choose the indicator from the list
Pivot Period: The Length to calculate Pivot Highs/Lows
Threshold Rate: This rate is used for channel width. it you give bigger numbers then you get bigger channels. it's 4 by default
Minimum Angle Rate for new Trendline: if there are different trend lines , there must be an angle between them to choose best trend lines . you can set the angle with this option.
Minimum Strength: there can be many trend lines but we need to choose/use stronger ones. with this option you can set the number of pivot points a trend channel have to contains. default value is 2
Maximum Loopback Length : by default the script can check 40 pivot highs and 40 pivot lows but to make the script faster and useful I needed to add a limitation for the number of bars that the script can go back.
Show Trendlines as: you can see trend lines as "Trendline", "Channel", "Trend Channel". you can see examples below.
Enable Weak Trend Lines : if there is no trend lines strong enough (as defined in "Minimum Strength" option) you have option to see a weak trend line . that is useful sometimes. if you enable this option weak lines are shown as dotted lines.
Show Price Labels on Trendlines: the script can show the price levels to break trend lines . the example
Line Style: trend lines can be Solid or Dashed as you wish
Color theme: colors of the Up/Down Trend lines can be set. Red, Lime, Blue, White, Black, Olive, Gray
Indicator color: colors of the Up/Down Trend lines can be set. Red, Lime, Blue, White, Black, Olive, Gray and Yellow
and last options are for length options for RSI, CCI, Momentum, MACD, CMF
There are many alerts such: Support/Resistance Broken, Price in Support/Resistance channel, Support/Resistance line broken but still in a channel that means it broke S/R but there is another trend lines to break.
Below an example how the script uses external indicator as input and draws trend lines on it. in this example chaikin ossilator was added to the chart and get trend lines for it. (I am going to make a short video about it)
An example of Trend Channel is below. when you use trend channel option you can get "big picture" of whats going on
An example for trend lines in channels, that is the idea behind this trend lines script
An axample for trend lines for CCI:
Trend lines on OBV:
Trend lines on Momentum:
Trend lines on MACD:
Trend lines on CMF:
Different colors and line styles:
Please send me message for access and do not hesitate to ask your questions about this tool.
Enjoy!
DISCLAIMER: No sharing, copying, reselling, modifying, or any other forms of use are authorized for our documents, script / strategy, and the information published with them. This informational planning script / strategy is strictly for individual use and educational purposes only. This is not financial or investment advice. Investments are always made at your own risk and are based on your personal judgement. I am not responsible for any losses you may incur. Please invest wisely.
付費腳本

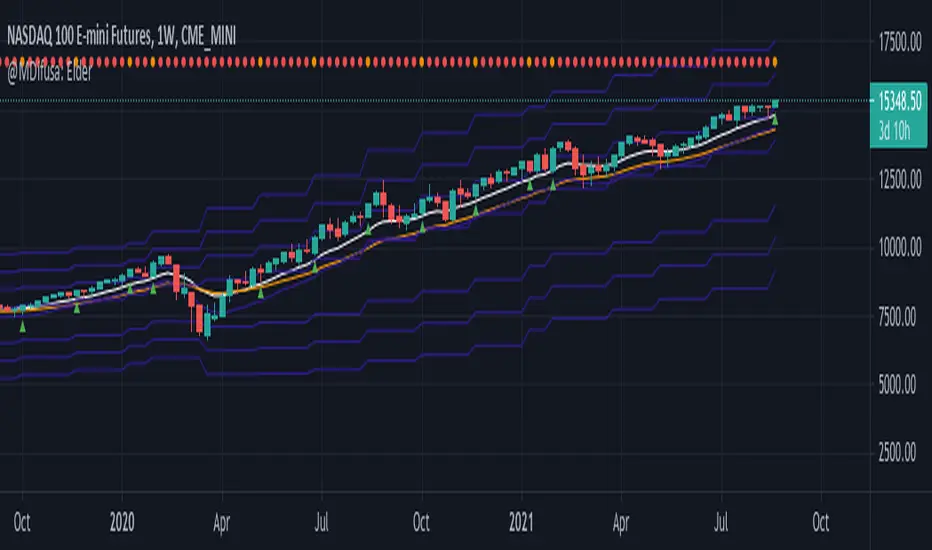
Elder EMA, ATR & MACD Indicator, 5X Time Frame & Divergences.This indicator is elaborated following the 3 window strategy described by Elder.
The fast, slow averages and MACD histogram are taken from a time frame 5 times higher than the active time frame and indicate bullish / bearish trends as well as divergences (bottom) of the hostogram with the price.
Market Trading Tools - DivergencesOur Divergence indicator is another indicator we are happy to present to interested traders. The indicator detects the possible trend change and it is a well known tool among traders based on bullish and bearish divergences.
To use the indicator well, it will spot divergences but some minimal work might be needed to be done as connecting the waves together to make sure that you get the best entries. You can also wait for the dots to appear in order to take a trade either long or short depending on whatever financial market you are trading and your trading strategy.
The red dots will signify a bearish divergence (trend reversal to the downside), while the green dots will signify a bullish divergence (trend reversal to the upside). The orange and purple dots also will signify a stronger divergence either bullish or bearish .
The divergence indicator we are publishing today works on crypto, stocks, forex, futures and almost all financial assets, however we do recommend using higher time frames for better results and to filter the noise around the divergences (dots), however using lower time frames can just allow you a better entry sometimes since reversals happen on lower time frames than larger ones.
Once you are granted access to use it, add it from going into the scripts >> invite only scripts >> enable the indicator (click on it once). Once the indicator is added to your chart you will see the indicator popping up to a lower pane.
We are happy to announce that our trading indicator is special and unique from different ones because of the features added above + we have added alerts to it. We believe that the indicator plotting and style on chart is also clean and easy for the eyes to catch compared to other indicators around. We have also enabled a function for our users to get a better view of the trend when they add the indicator to their chart. You can now view the trend background color (red&green) depending on if the price is above the EMA of your choice. you can also check whichever time interval you want that does not limit you to the time interval chosen on your chart itself.
Hope you enjoy it, Good luck and stay safe!
** If you are interested in this indicator. please use the link below to obtain access to this indicator

Divergence Histogram for Many IndicatorHello Traders,
This script analyses divergences for 11 predefined indicators and then draws column on the graph. Red columns for negatif divergence (means prices may go down or trend reversal), Lime columns for positive divergences (means prices may go up or trend reversal)
The script uses Pivot Points and on each bar it checks divergence between last Pivot Point and current High/Low and if it finds any divergence then immediately draws column. There is no Latency/Lag.
There are predefined 11 indicators in the script, which are RSI , MACD , MACD Histogram, Stochastic , CCI , Momentum, OBV, Diosc, VWMACD, CMF and MFI.
Smaller Pivot Point Period check smaller areas and if you use smaller numbers it would be more sensitive and may give alerts very often. So you should set it accordingly.
There is "Check Cut-Through in indicators" option, I recomment you to enable it. it checks that there is cut-through in indicators or not, if no cut-through then it's shown as valid divergence.
You should see following one as well if you haven't yet:
Enjoy!

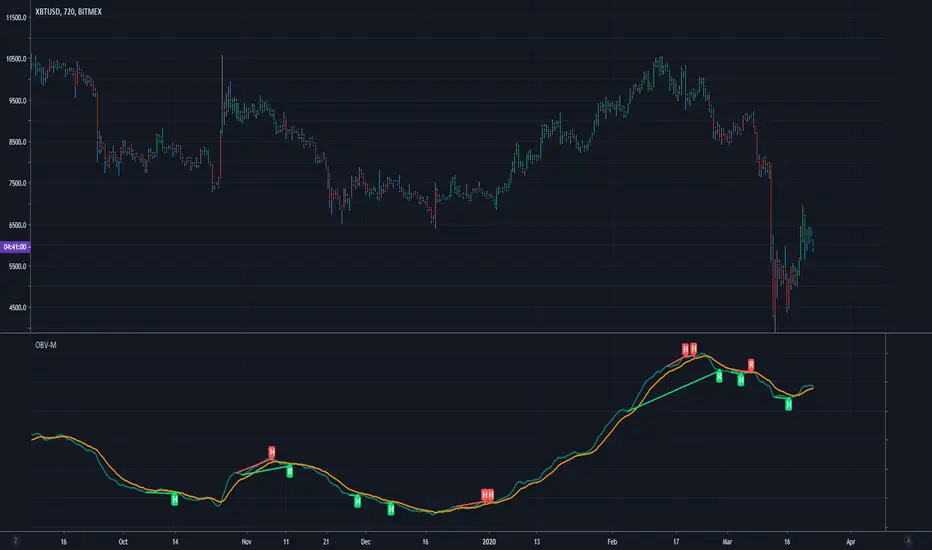
Modified OBV w/ Divergence Detection by CryptorhythmsApirine OBV-M Modified OBV w/ MA Selection by Cryptorhythms
Intro
Released in the April 2020 issue of TASC, and created by Vitali Apirine.
Description
OBV-M is of course based on the classic indicator on balance volume originally developed by Joe Granville. Apirine then smooths the calculation and adds a signal line to help denote entry and exit points.
As the author points out uts also great at showing divergences!
Extras
As usual when porting indicators to the library here on tradingview, I like to add some extra flare!
💠MA selection to allow you to experiment with alternate settings
💠Bar coloration based on trade state for easy visual at a glance chart checking
💠Divergence Detection and plotting thanks for Ricardo Santos' script
Enjoy!
👍 We hope you enjoyed this indicator and find it useful! We post free crypto analysis, strategies and indicators regularly. This is our 78th script on Tradingview!
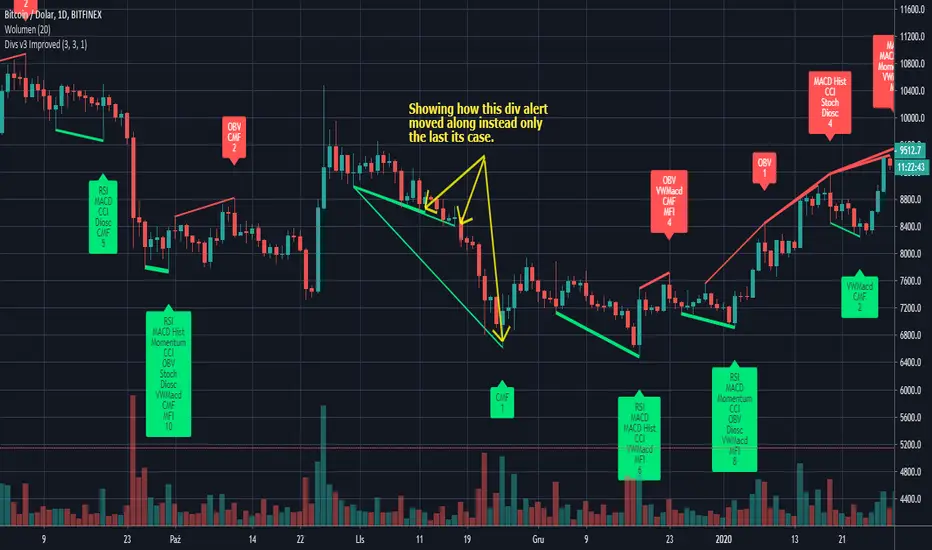
Divergence for many indicator v3 ImprovedThis is a modificated version of original script by @LonesomeTheBlue (Thank you for giving me rights to use your code with my modification in invite-only format):
I made few changes to lessen the amount of divergences generated on the chart and how they moved along (lines without cloud with text) instead only the last cases that may be missleading for some (especially when you would use that code to generate alerts).
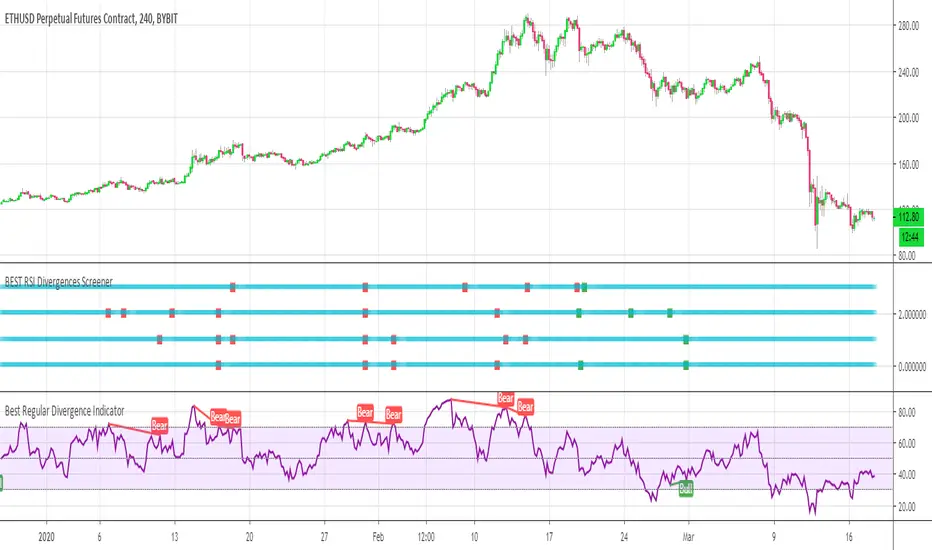
BEST RSI Divergences ScreenerHello traders
I hope you're all hanging on at home with what's going on these days...
The good news is.... it gives us more time to trade ^^.... #positive #attitude
I - Concept
This screener detects whether the regular RSI divergences based on the TradingView Divergence built-in indicator (made by the gentleman @everget I believe)
With this screener, you can see in 1 view which of your favorite cryptos/stocks/forex pairs/etc. showing strong divergences
The gentlemen (and demoiselles) traders can play with the lookback/ranges inputs to adjust the divergences based on what they think is best of their trading/timeframe/instrument/life
On that script screenshot, I'm showing the BYBIT:BTCUSD part of the screener matching with the divergences on the chart
II - How did I set the screener
The visual signals are as follow:
- square: whenever a divergence is detected
Then the colors are:
- green when there is bullish regular divergence
- red when there is bearish regular divergence
Best regards
Dave
RSI + DivergencesHi Guys,
This indicator gives you the trend changes (Designed with the basics of Vash's RSI advanced and the Fikira divergence indicator)
This indicator will only give you regular divergences.
Please keep in mind that a trading plan is not only built with momentum but also with location and structure.
Good trading,

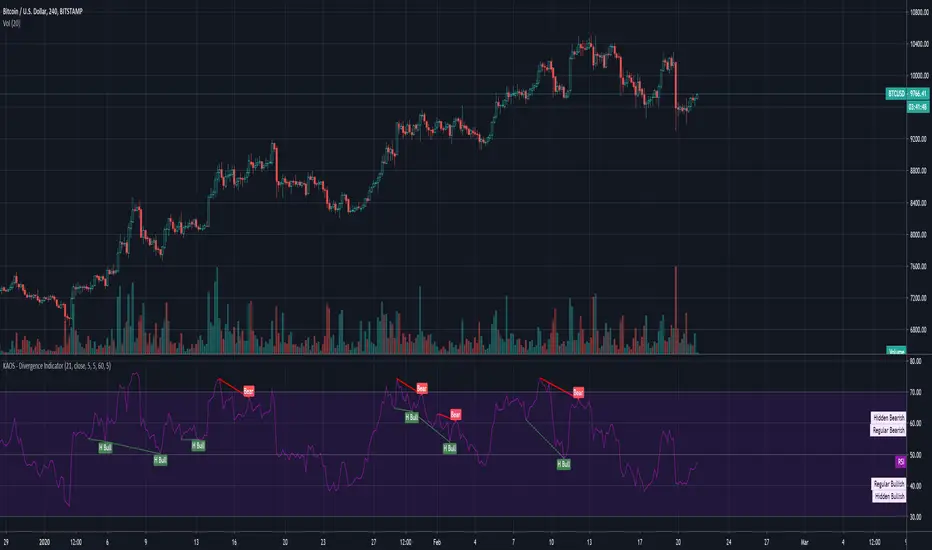
KAOS - Divergence IndicatorDivergence Indicator... Works pretty well, Use with caution as it does amend itself depending on market whale activity.
1hr, 4hr and Daily good for macro movements.
Should be used a supplemental indicator to your over all strategy NOT as a entry exit.
Have fun :)
Made by someone else, but has been tweaked with better settings
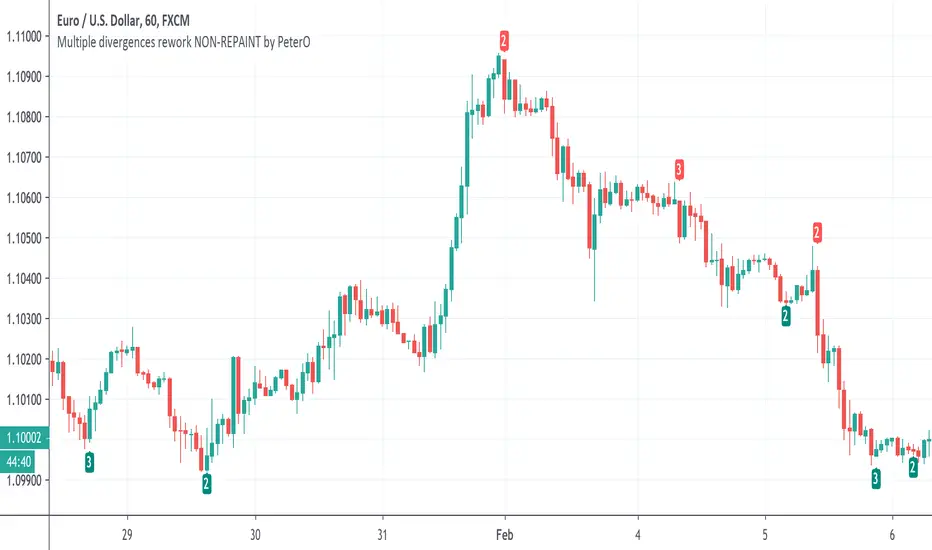
Multiple divergences NON-REPAINT by PeterODivergences are well-known tool for finding trend reversals. Powerful, yet... unreliable. Sometimes they show up, sometimes they don't. Sometimes they really mean trend end, sometimes the trend continues. I've witnessed countless discussions about which indicator to hunt for divergences on. All pointless.
Earlier today I found a very inspirational script by Lonesometheblue, combining multiple divergences together. Actually - summing them up and showing hunted divergences count in a label. Because if a divergence shows up on a single indicator like RSI, it can indeed mean trend reversal, but... yeah, check previous pargraph. But if this divergence shows up on 8 different indicators at the same time, then chances increase, don't they?
I decided to do my own version of Lonesome's indicator, because that one is using Label.New, which doesn't allow analysing entire script, only latest 50 occurences or so. I'm not going to hide it - I copy-pasted a lot from Lonesome's code. And from Everget's built-in divergences script, which you can find in PineScript/New. I didn't even bother to modify variable names or cover tracks in any other way, pretending it is my work from scratch. All with these two gentlemen consent and blessing. I added labels from myself, plus bit of rework and here it is:)
I hope you'll find it useful.
P.S. While analyzing divergences today, I discovered one thing. Hidden divergences are not useless, as many people think. But they should be used at trend dips to join the trend, not at trend ends, as reversals. Experiment yourself.
P.S.2 Still, never use only divergences. They need confirmation, they are not self-fulfilling prophecy.