Smart Money Time by TMUSMT-Integrated Institutional Structure
This solution addresses a critical limitation in retail technical analysis: Fractal Blindness. While standard indicators operate linearly on a single timeframe, this script utilizes a Synchronous Multi-Timeframe (MTF) Architecture combined with SMT (Smart Money Time) logic to overlay higher-order market structure directly onto your execution chart.
It is engineered to align your entry triggers with the dominant institutional trend, effectively filtering out counter-trend noise that often leads to liquidity sweeps.
Core Technology: The "Fractal-Sync" Engine
1. Hierarchical Trend Propagation (MTF Logic) The script performs a real-time request.security analysis of user-selected higher timeframes to determine the "True State" of the market.
The Mechanism: Instead of repainting historical data, the algorithm uses a Step-Locked logic. It projects the confirmed Swing Highs and Lows of the Higher Timeframe (e.g., 4H) onto your Lower Timeframe (e.g., 5m or 15m).
Practical Value: You instantly visualize the "Big Picture" bias without switching tabs, ensuring your local trades are aligned with the global flow.
2. SMT-Grade Pivot Detection Integrating concepts from Smart Money analysis, the indicator identifies Key Swing Points that have a high probability of defense by large operators.
Technique: By calculating volatility-adjusted deviations (ATR) across multiple timeframes, the script distinguishes between a standard "pullback" and a genuine Structure Shift (MSS) or Break of Structure (BOS).
Benefit: It visually separates weak internal structure (inducement) from strong external structure (protected levels).
Technical Specifications & Filters
To satisfy strict stability requirements and provide objective signals, the engine incorporates unique validation methods:
Volatility Normalization: Structure breaks are validated against a dynamic ATR threshold. This ensures that low-volume consolidation does not trigger false structural resets.
Candle-Close Validation Protocol: A level is considered breached only if the candle body closes beyond the pivot. This filters out "Wick Fakeouts" and Stop-Hunts often seen during news events.
Conflict Resolution: When the Lower Timeframe trend contradicts the Higher Timeframe structure, the indicator visualizes this as a "Retracement Phase," advising caution.
Operational Workflow
This tool acts as a Market Context Filter, not a simple signal generator:
Trend Alignment: Use the visual cues to instantly recognize the dominant institutional flow.
Zone Identification: The script automatically plots "Strong Lows" (Invalidation Points) and "Weak Highs" (Targets).
Execution: Seek entries on your timeframe only when the higher timeframe structure (shown by this script) confirms the direction.
Note for Professional Use: This script is designed for precision execution. It minimizes chart clutter by displaying only confirmed structural points, providing a clean, logic-driven workspace for objective decision-making.
Divergencetrading

SMT [Advanced] by TMUThis is a proprietary technical analysis tool designed to detect SMT (Smart Money Time) Divergences with a specific focus on Time-Cycle Theory and advanced Data Visualization.
Originality & Technical Uniqueness Unlike standard open-source SMT indicators that simply compare Highs/Lows and clutter the chart with overlapping text, this script utilizes a custom-built "Label Registry & Stacking Engine". Standard indicators often fail when multiple divergences occur simultaneously on different timeframes. This script solves this problem using a proprietary deferred rendering algorithm:
Registry System: Instead of drawing signals immediately, the script calculates potential divergences across multiple assets/timeframes and pushes them into a dynamic array (registry).
Dynamic Stacking: A background sorting algorithm processes this stack every bar, groups signals by their timestamp and type, and renders them with calculated offsets. This ensures labels never overlap, providing a clean, professional workspace impossible to achieve with basic plotting functions.
Signal Rotation: It implements a "rotation manager" logic for 90-minute cycles. As price action evolves, the script automatically assesses whether to update an existing divergence line or create a new historical reference, keeping the analysis strictly relevant to the current cycle structure.
How it Works (Methodology) The script performs a relative strength analysis between two correlated assets (e.g., ES vs. YM) using request.security to fetch comparative data.
Pivot Analysis: It identifies structural Pivot Highs and Lows based on a configurable length, filtering out minor internal noise.
Divergence Logic:
Bearish SMT: Validated when the primary asset makes a Higher High while the comparison asset makes a Lower High.
Bullish SMT: Validated when the primary asset makes a Lower Low while the comparison asset makes a Higher Low.
Time-Cycle Isolation: The analysis is confined within strictly defined temporal windows (Daily, Weekly, and custom 90-minute intraday blocks). The script detects cracks in correlation specifically within these isolated sessions rather than looking at infinite history.
Features
Smart Filter: Advanced logic to filter out "Internal" structure and focus only on major external pivot breaches.
Multi-Cycle Dashboard: A real-time table monitoring the SMT status of Monthly, Weekly, Daily, and intraday cycles simultaneously.
Auto-Ticker Selection: Automatically detects the current asset class (Indices/Forex) and selects the appropriate comparison symbol (e.g., selects YM when viewing ES).
Settings
Comparisons: Manual or Auto-ticker selection.
Visuals: Custom colors, line styles, and label positioning modes.
Alerts: Customizable alerts for valid SMT formation on any monitored timeframe.

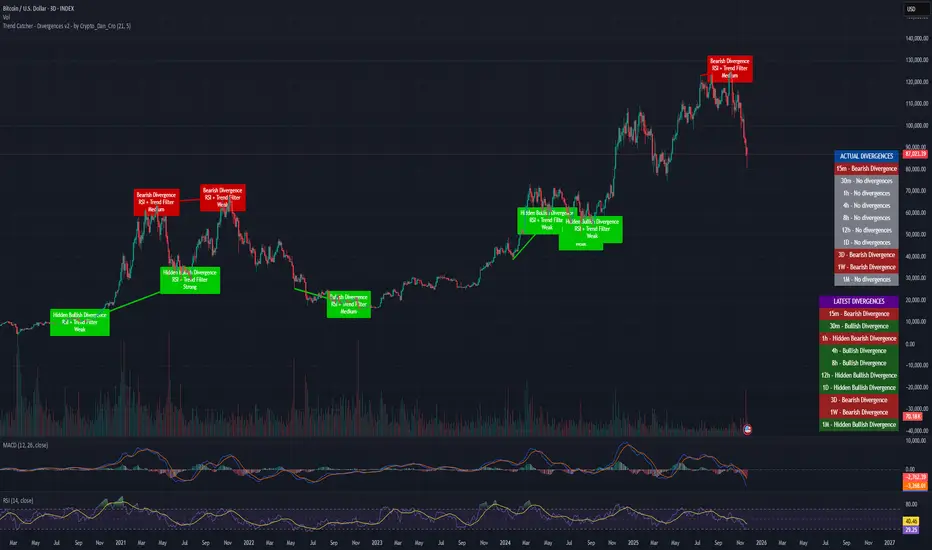
Trend Catcher - Divergences v2 - by Crypto_Dan_CroIf you want to get this indicator, contact me on
X handle: @crypto_dan_cro
What is Trend Catcher - Divergences v2?
It's advanced TradingView indicator designed to automatically detect and visualize divergences between price action and the RSI indicator, enhanced with smart filtering and visual strength analysis.
This tool helps traders identify potential trend reversals, continuation opportunities, and areas of weakening momentum with high clarity and precision.
Key Features
Automatic Detection of Divergences:
- Bullish divergence
- Bearish divergence
- Hidden bullish divergence
- Hidden bearish divergence
Overlap Prevention System
When bullish and bearish divergences occur in the same zone, the script intelligently prioritizes the stronger and more reliable signal to avoid confusion and clutter.
Visual Chart Rendering
Each divergence is displayed with:
- A line connecting key swing points
- A label showing: Divergence type, Active confirmation filter, Signal strength (Weak / Medium / Strong / Extreme)
Divergence Strength Heatmap
The indicator includes a Heatmap system that visually represents divergence strength using color intensity:
- Weak divergences appear lighter and more transparent
- Strong divergences appear bold and highly visible
Strength Classification Levels
Every divergence is categorized into one of four levels: Weak, Medium, Strong, Extreme
Confirmation Filters
- RSI + Trend Filter (recommended)
- RSI + MACD
- RSI + OBV
- MACD + Price Action
Multi-Timeframe Information Panels
ACTUAL DIVERGENCES
Displays currently active divergences across timeframes
LATEST DIVERGENCES
Shows the most recent divergence detected on each timeframe
Included timeframes:
15m, 30m, 1h, 4h, 8h, 12h, 1D, 3D, 1W, 1M
Ideal Use Cases
This indicator is perfect for:
- Swing trading
- Identifying reversal zones
- Momentum exhaustion detection
- Supporting price action strategies
- Trend confirmation and filtering
Trend Catcher – Divergences v2 provides a powerful yet clear approach to divergence trading by combining:
- Smart logic
- Visual clarity
- Strenght analysis
- Reliable filtering
It is built for traders who want precision, clarity, and confidence when trading divergences.
Crypto markets are volatile, if you choose to use this indicator for trading, you are doing it on your own. Crypto_dan_cro is not responsible for any profits or losses created by using this Indicator.
Volume HeatMap Divergence [BigBeluga]🔵 OVERVIEW
The Volume HeatMap Divergence is a smart volume visualization tool that overlays normalized volume data directly on the chart. Using a color heatmap from aqua to red, it transforms raw volume into an intuitive scale — highlighting areas of weak to intense market participation. Additionally, it detects volume-based divergences from price to signal potential reversals or exhaustion zones. Combined with clear visual labeling, this tool empowers traders with actionable volume insights.
🔵 CONCEPTS
Normalized Volume Heatmap : Volume is normalized to a 0–100% scale and visually represented as candles below the chart.
float vol = volume / ta.percentile_nearest_rank(volume, 1000, 100) * 100
Bar Coloring : Price candles are dynamically colored based on volume intensity.
Volume Divergence Logic :
Bullish Divergence : Price forms a lower low, but volume forms a higher low.
Bearish Divergence : Price forms a higher high, but volume forms a lower high.
Dynamic Detection Range : Customizable range ensures divergence signals are meaningful and not random.
Volume Labels : Additional info on divergence bars shows both the actual volume and its normalized % score.
🔵 FEATURES
Volume Heatmap Plot : Normalized volume values colored using a smooth gradient from aqua (low) to red (high).
Price Bar Coloring : Candlesticks on the main chart adopt the same heatmap color based on volume.
Divergence Detection :
Bullish divergence with label and low marker
Bearish divergence with label and high marker
Dual Divergence Labels :
On the volume plot : Direction (Bull/Bear), raw volume, and normalized %
On the price chart : Shape labels showing "Bull" or "Bear" at local highs/lows
Custom Inputs :
Divergence range (min & max), pivot detection distance (left/right)
Toggle to show/hide divergence labels, volume, and % text
Clear Bull/Bear Coloring : Fully customizable label and line colors for both bullish and bearish signals.
🔵 HOW TO USE
Use the indicator as an overlay to monitor real-time volume strength using the heatmap color.
Watch for divergence markers:
Bullish divergence: Candle shows higher volume while price makes a new low
Bearish divergence: Candle shows lower volume while price makes a new high
Use the volume info labels to verify the context of divergence:
Actual volume at divergence candle
Normalized % of that volume compared to past 1000 bars
Adjust pivot sensitivity using "Pivot Left" and "Pivot Right" to tune signal frequency and lag with a right pivot length.
Use divergence zones as early warnings for potential reversals or trend shifts.
Disable or customize labels in settings depending on your charting preferences.
🔵 CONCLUSION
Volume HeatMap Divergence merges heatmap-style volume visualization with intelligent divergence detection — giving traders a clean yet powerful edge. By revealing hidden disconnections between price and participation, it helps users spot exhaustion moves or hidden accumulation zones before the market reacts. Whether you’re a scalper, swing trader, or intraday strategist, this tool offers real-time clarity on who’s in control behind the candles.

Range Oscillator (Zeiierman)█ Overview
Range Oscillator (Zeiierman) is a dynamic market oscillator designed to visualize how far the price is trading relative to its equilibrium range. Instead of relying on traditional overbought/oversold thresholds, it uses adaptive range detection and heatmap coloring to reveal where price is trading within a volatility-adjusted band.
The oscillator maps market movement as a heat zone, highlighting when the price approaches the upper or lower range boundaries and signaling potential breakout or mean-reversion conditions.
Highlights
Adaptive range detection based on ATR and weighted price movement.
Heatmap-driven coloring that visualizes volatility pressure and directional bias.
Clear transition zones for detecting trend shifts and equilibrium points.
█ How It Works
⚪ Range Detection
The indicator identifies a dynamic price range using two main parameters:
Minimum Range Length: The number of bars required to confirm that a valid range exists.
Range Width Multiplier: Expands or contracts the detected range proportionally to the ATR (Average True Range).
This approach ensures that the oscillator automatically adapts to both trending and ranging markets without manual recalibration.
⚪ Weighted Mean Calculation
Instead of a simple moving average, the script calculates a weighted equilibrium mean based on the size of consecutive candle movements:
Larger price changes are given greater weight, emphasizing recent volatility.
⚪ Oscillator Formula
Once the range and equilibrium mean are defined, the oscillator computes:
Osc = 100 * (Close - Mean) / RangeATR
This normalizes price distance relative to the dynamic range size — producing consistent readings across volatile and quiet periods.
█ Heatmap Logic
The Range Oscillator includes a built-in heatmap engine that color-codes each oscillator value based on recent price interaction intensity:
Strong Bullish Zones: Bright green — price faces little resistance upward.
Weak Bullish Zones: Muted green — uptrend continuation but with minor hesitation.
Transition Zones: Blue — areas of uncertainty or trend shift.
Weak Bearish Zones: Maroon — downtrend pressure but soft momentum.
Strong Bearish Zones: Bright red — strong downside continuation with low resistance.
Each color band adapts dynamically using:
Number of Heat Levels: Controls granularity of the heatmap.
Minimum Touches per Level: Defines how reactive or “sensitive” each color zone is.
█ How to Use
⚪ Trend & Momentum Confirmation
When the oscillator stays above +0 with green coloring, it suggests sustained bullish pressure.
Similarly, readings below –0 with red coloring, it suggests sustained bearish pressure.
⚪ Range Breakouts
When the oscillator line breaks above +100 or below –100, the price is exceeding its normal volatility range, often signaling breakout potential or exhaustion extremes.
⚪ Mean Reversion Trades
Look for the oscillator to cross back toward zero after reaching an extreme. These transitions (often marked by blue tones) can identify early reversals or range resets.
⚪ Divergence
Use oscillator peaks and troughs relative to price action to spot hidden strength or weakness before the next move.
█ Settings
Minimum Range Length: Number of bars needed to confirm a valid range.
Range Width Multiplier: Expands or contracts range width based on ATR.
Number of Heat Levels: Number of gradient bands used in the oscillator.
Minimum Touches per Level: Sensitivity threshold for when a zone becomes “hot.”
-----------------
Disclaimer
The content provided in my scripts, indicators, ideas, algorithms, and systems is for educational and informational purposes only. It does not constitute financial advice, investment recommendations, or a solicitation to buy or sell any financial instruments. I will not accept liability for any loss or damage, including without limitation any loss of profit, which may arise directly or indirectly from the use of or reliance on such information.
All investments involve risk, and the past performance of a security, industry, sector, market, financial product, trading strategy, backtest, or individual's trading does not guarantee future results or returns. Investors are fully responsible for any investment decisions they make. Such decisions should be based solely on an evaluation of their financial circumstances, investment objectives, risk tolerance, and liquidity needs.

Divergence Strategy [Trendoscope®]🎲 Overview
The Divergence Strategy is a sophisticated TradingView strategy that enhances the Divergence Screener by adding automated trade signal generation, risk management, and trade visualization. It leverages the screener’s robust divergence detection to identify bullish, bearish, regular, and hidden divergences, then executes trades with precise entry, stop-loss, and take-profit levels. Designed for traders seeking automated trading solutions, this strategy offers customizable trade parameters and visual feedback to optimize performance across various markets and timeframes.
For core divergence detection features, including oscillator options, trend detection methods, zigzag pivot analysis, and visualization, refer to the Divergence Screener documentation. This description focuses on the strategy-specific enhancements for automated trading and risk management.
🎲 Strategy Features
🎯Automated Trade Signal Generation
Trade Direction Control : Restrict trades to long-only or short-only to align with market bias or strategy goals, preventing conflicting orders.
Divergence Type Selection : Choose to trade regular divergences (bullish/bearish), hidden divergences, or both, targeting reversals or trend continuations.
Entry Type Options :
Cautious : Enters conservatively at pivot points and exits quickly to minimize risk exposure.
Confident : Enters aggressively at the latest price and holds longer to capture larger moves.
Mixed : Combines conservative entries with delayed exits for a balanced approach.
Market vs. Stop Orders: Opt for market orders for instant execution or stop orders for precise price entry.
🎯 Enhanced Risk Management
Risk/Reward Ratio : Define a risk-reward ratio (default: 2.0) to set profit targets relative to stop-loss levels, ensuring consistent trade sizing.
Bracket Orders : Trades include entry, stop-loss, and take-profit levels calculated from divergence pivot points, tailored to the entry type and risk-reward settings.
Stop-Loss Placement : Stops are strategically set (e.g., at recent pivot or last price point) based on entry type, balancing risk and trade validity.
Order Cancellation : Optionally cancel pending orders when a divergence is broken (e.g., price moves past the pivot in the wrong direction), reducing invalid trades. This feature is toggleable for flexibility.
🎯 Trade Visualization
Target and Stop Boxes : Displays take-profit (lime) and stop-loss (orange) levels as boxes on the price chart, extending 10 bars forward for clear visibility.
Dynamic Trade Updates : Trade visualizations are added, updated, or removed as trades are executed, canceled, or invalidated, ensuring accurate feedback.
Overlay Integration : Trade levels overlay the price chart, complementing the screener’s oscillator-based divergence lines and labels.
🎯 Strategy Default Configuration
Capital and Sizing : Set initial capital (default: $1,000,000) and position size (default: 20% of equity) for realistic backtesting.
Pyramiding : Allows up to 4 concurrent trades, enabling multiple divergence-based entries in trending markets.
Commission and Margin : Accounts for commission (default: 0.01%) and margin (100% for long/short) to reflect trading costs.
Performance Optimization : Processes up to 5,000 bars dynamically, balancing historical analysis and real-time execution.
🎲 Inputs and Configuration
🎯Trade Settings
Direction : Select Long or Short (default: Long).
Divergence : Trade Regular, Hidden, or Both divergence types (default: Both).
Entry/Exit Type : Choose Cautious, Confident, or Mixed (default: Cautious).
Risk/Reward : Set the risk-reward ratio for profit targets (default: 2.0).
Use Market Order : Enable market orders for immediate entry (default: false, uses limit orders).
Cancel On Break : Cancel pending orders when divergence is broken (default: true).
🎯Inherited Settings
The strategy inherits all inputs from the Divergence Screener, including:
Oscillator Settings : Oscillator type (e.g., RSI, CCI), length, and external oscillator option.
Trend Settings : Trend detection method (Zigzag, MA Difference, External), MA type, and length.
Zigzag Settings : Zigzag length (fixed repaint = true).
🎲 Entry/Exit Types for Divergence Scenarios
The Divergence Strategy offers three Entry/Exit Type options—Cautious, Confident, and Mixed—which determine how trades are entered and exited based on divergence pivot points. This section explains how these settings apply to different divergence scenarios, with placeholders for screenshots to illustrate each case.
The divergence pattern forms after 3 pivots. The stop and entry levels are formed on one of these levels based on Entry/Exit types.
🎯Bullish Divergence (Reversal)
A bullish divergence occurs when price forms a lower low, but the oscillator forms a higher low, signaling a potential upward reversal.
💎 Cautious:
Entry : At the pivot high point for a conservative entry.
Exit : Stop-loss at the last pivot point (previous low that is higher than the current pivot low); take-profit at risk-reward ratio. Canceled if price breaks below the pivot (if Cancel On Break is enabled).
Behavior : Enters after confirmation and exits quickly to limit downside risk.
💎Confident:
Entry : At the last pivot low, (previous low which is higher than the current pivot low) for an aggressive entry.
Exit : Stop-loss at recent pivot low, which is the lowest point; take-profit at risk-reward ratio. Canceled if price breaks below the pivot. (lazy exit)
Behavior : Enters early to capture trend continuation, holding longer for gains.
💎Mixed:
Entry : At the pivot high point (conservative).
Exit : Stop-loss at the recent pivot point that has resulted in lower low (lazy exit). Canceled if price breaks below the pivot.
Behavior : Balances entry caution with extended holding for trend continuation.
🎯Bearish Divergence (Reversal)
A bearish divergence occurs when price forms a higher high, but the oscillator forms a lower high, indicating a potential downward reversal.
💎Cautious:
Entry : At the pivot low point (lower high) for a conservative short entry.
Exit : Stop-loss at the previous pivot high point (previous high); take-profit at risk-reward ratio. Canceled if price breaks above the pivot (if Cancel On Break is enabled).
Behavior : Enters conservatively and exits quickly to minimize risk.
💎Confident:
Entry : At the last price point (previous high) for an aggressive short entry.
Exit : Stop-loss at the pivot point; take-profit at risk-reward ratio. Canceled if price breaks above the pivot.
Behavior : Enters early to maximize trend continuation, holding longer.
💎Mixed:
Entry : At the previous piot high point (conservative).
Exit : Stop-loss at the last price point (delayed exit). Canceled if price breaks above the pivot.
Behavior : Combines conservative entry with extended holding for downtrend gains.
🎯Bullish Hidden Divergence (Continuation)
A bullish hidden divergence occurs when price forms a higher low, but the oscillator forms a lower low, suggesting uptrend continuation. In case of Hidden bullish divergence, b]Entry is always on the previous pivot high (unless it is a market order)
💎Cautious:
Exit : Stop-loss at the recent pivot low point (higher than previous pivot low); take-profit at risk-reward ratio. Canceled if price breaks below the pivot (if Cancel On Break is enabled).
Behavior : Enters after confirmation and exits quickly to limit downside risk.
💎Confident:
Exit : Stop-loss at previous pivot low, which is the lowest point; take-profit at risk-reward ratio. Canceled if price breaks below the pivot. (lazy exit)
Behavior : Enters early to capture trend continuation, holding longer for gains.
🎯Bearish Hidden Divergence (Continuation)
A bearish hidden divergence occurs when price forms a lower high, but the oscillator forms a higher high, suggesting downtrend continuation. In case of Hidden Bearish divergence, b]Entry is always on the previous pivot low (unless it is a market order)
💎Cautious:
Exit : Stop-loss at the latest pivot high point (which is a lower high); take-profit at risk-reward ratio. Canceled if price breaks above the pivot (if Cancel On Break is enabled).
Behavior : Enters conservatively and exits quickly to minimize risk.
💎Confident/Mixed:
Exit : Stop-loss at the previous pivot high point; take-profit at risk-reward ratio. Canceled if price breaks above the pivot.
Behavior : Uses the late exit point to hold longer.
🎲 Usage Instructions
🎯Add to Chart:
Add the Divergence Strategy to your TradingView chart.
The oscillator and divergence signals appear in a separate pane, with trade levels (target/stop boxes) overlaid on the price chart.
🎯Configure Settings:
Adjust trade settings (direction, divergence type, entry type, risk-reward, market orders, cancel on break).
Modify inherited Divergence Screener settings (oscillator, trend method, zigzag length) as needed.
Enable/disable alerts for divergence notifications.
🎯Interpret Signals:
Long Trades: Triggered on bullish or bullish hidden divergences (if allowed), shown with green/lime lines and labels.
Short Trades: Triggered on bearish or bearish hidden divergences (if allowed), shown with red/orange lines and labels.
Monitor lime (target) and orange (stop) boxes for trade levels.
Review strategy performance metrics (e.g., profit/loss, win rate) in the strategy tester.
🎯Backtest and Optimize:
Use TradingView’s strategy tester to evaluate performance on historical data.
Fine-tune risk-reward, entry type, position sizing, and cancellation settings to suit your market and timeframe.
For questions, suggestions, or support, contact Trendoscope via TradingView or official support channels. Stay tuned for updates and enhancements to the Divergence Strategy!

Quarterly Theory ICT 04 [TradingFinder] SSMT 4Quarter Divergence🔵 Introduction
Sequential SMT Divergence is an advanced price-action-based analytical technique rooted in the ICT (Inner Circle Trader) methodology. Its primary objective is to identify early-stage divergences between correlated assets within precise time structures. This tool not only breaks down market structure but also enables traders to detect engineered liquidity traps before the market reacts.
In simple terms, SMT (Smart Money Technique) occurs when two correlated assets—such as indices (ES and NQ), currency pairs (EURUSD and GBPUSD), or commodities (Gold and Silver)—exhibit different reactions at key price levels (swing highs or lows). This lack of alignment is often a sign of smart money manipulation and signals a lack of confirmation in the ongoing trend—hinting at an imminent reversal or at least a pause in momentum.
In its Sequential form, SMT divergences are examined through a more granular temporal lens—between intraday quarters (Q1 through Q4). When SMT appears at the transition from one quarter to another (e.g., Q1 to Q2 or Q3 to Q4), the signal becomes significantly more powerful, often aligning with a critical phase in the Quarterly Theory—a framework that segments market behavior into four distinct phases: Accumulation, Manipulation, Distribution, and Reversal/Continuation.
For instance, a Bullish SMT forms when one asset prints a new low while its correlated counterpart fails to break the corresponding low from the previous quarter. This usually indicates absorption of selling pressure and the beginning of accumulation by smart money. Conversely, a Bearish SMT arises when one asset makes a higher high, but the second asset fails to confirm, signaling distribution or a fake-out before a decline.
However, SMT alone is not enough. To confirm a true Market Structure Break (MSB), the appearance of a Precision Swing Point (PSP) is essential—a specific candlestick formation on a lower timeframe (typically 5 to 15 minutes) that reveals the entry of institutional participants. The combination of SMT and PSP provides a more accurate entry point and better understanding of premium and discount zones.
The Sequential SMT Indicator, introduced in this article, dynamically scans charts for such divergence patterns across multiple sessions. It is applicable to various markets including Forex, crypto, commodities, and indices, and shows particularly strong performance during mid-week sessions (Wednesdays and Thursdays)—when most weekly highs and lows tend to form.
Bullish Sequential SMT :
Bearish Sequential SMT :
🔵 How to Use
The Sequential SMT (SSMT) indicator is designed to detect time and structure-based divergences between two correlated assets. This divergence occurs when both assets print a similar swing (high or low) in the previous quarter (e.g., Q3), but in the current quarter (e.g., Q4), only one asset manages to break that swing level—while the other fails to reach it.
This temporal mismatch is precisely identified by the SSMT indicator and often signals smart money activity, a market phase transition, or even the presence of an engineered liquidity trap. The signal becomes especially powerful when paired with a Precision Swing Point (PSP)—a confirming candle on lower timeframes (5m–15m) that typically indicates a market structure break (MSB) and the entry of smart liquidity.
🟣 Bullish Sequential SMT
In the previous quarter, both assets form a similar swing low.
In the current quarter, one asset (e.g., EURUSD) breaks that low and trades below it.
The other asset (e.g., GBPUSD) fails to reach the same low, preserving the structure.
This time-based divergence reflects declining selling pressure, potential absorption, and often marks the end of a manipulation phase and the start of accumulation. If confirmed by a bullish PSP candle, it offers a strong long opportunity, with stop-losses defined just below the swing low.
🟣 Bearish Sequential SMT
In the previous quarter, both assets form a similar swing high.
In the current quarter, one asset (e.g., NQ) breaks above that high.
The other asset (e.g., ES) fails to reach that high, remaining below it.
This type of divergence signals weakening bullish momentum and the likelihood of distribution or a fake-out before a price drop. When followed by a bearish PSP candle, it sets up a strong shorting opportunity with targets in the discount zone and protective stops placed above the swing high.
🔵 Settings
⚙️ Logical Settings
Quarterly Cycles Type : Select the time segmentation method for SMT analysis.
Available modes include: Yearly, Monthly, Weekly, Daily, 90 Minute, and Micro.
These define how the indicator divides market time into Q1–Q4 cycles.
Symbol : Choose the secondary asset to compare with the main chart asset (e.g., XAUUSD, US100, GBPUSD).
Pivot Period : Sets the sensitivity of the pivot detection algorithm. A smaller value increases responsiveness to price swings.
Activate Max Pivot Back : When enabled, limits the maximum number of past pivots to be considered for divergence detection.
Max Pivot Back Length : Defines how many past pivots can be used (if the above toggle is active).
Pivot Sync Threshold : The maximum allowed difference (in bars) between pivots of the two assets for them to be compared.
Validity Pivot Length : Defines the time window (in bars) during which a divergence remains valid before it's considered outdated.
🎨 Display Settings
Show Cycle :Toggles the visual display of the current Quarter (Q1 to Q4) based on the selected time segmentation
Show Cycle Label : Shows the name (e.g., "Q2") of each detected Quarter on the chart.
Show Bullish SMT Line : Draws a line connecting the bullish divergence points.
Show Bullish SMT Label : Displays a label on the chart when a bullish divergence is detected.
Bullish Color : Sets the color for bullish SMT markers (label, shape, and line).
Show Bearish SMT Line : Draws a line for bearish divergence.
Show Bearish SMT Label : Displays a label when a bearish SMT divergence is found.
Bearish Color : Sets the color for bearish SMT visual elements.
🔔 Alert Settings
Alert Name : Custom name for the alert messages (used in TradingView’s alert system).
Message Frequency :
All: Every signal triggers an alert.
Once Per Bar: Alerts once per bar regardless of how many signals occur.
Per Bar Close: Only triggers when the bar closes and the signal still exists.
Time Zone Display : Choose the time zone in which alert timestamps are displayed (e.g., UTC).
Bullish SMT Divergence Alert : Enable/disable alerts specifically for bullish signals.
Bearish SMT Divergence Alert : Enable/disable alerts specifically for bearish signals
🔵 Conclusion
The Sequential SMT (SSMT) indicator is a powerful and precise tool for identifying structural divergences between correlated assets within a time-based framework. Unlike traditional divergence models that rely solely on sequential pivot comparisons, SSMT leverages Quarterly Theory, in combination with concepts like liquidity sweeps, market structure breaks (MSB) and precision swing points (PSP), to provide a deeper and more actionable view of market dynamics.
By using SSMT, traders gain not only the ability to identify where divergence occurs, but also when it matters most within the market cycle. This empowers them to anticipate major moves or traps before they fully materialize, and position themselves accordingly in high-probability trade zones.
Whether you're trading Forex, crypto, indices, or commodities, the true strength of this indicator is revealed when used in sync with the Accumulation, Manipulation, Distribution, and Reversal phases of the market. Integrated with other confluence tools and market models, SSMT can serve as a core component in a professional, rule-based, and highly personalized trading strategy.

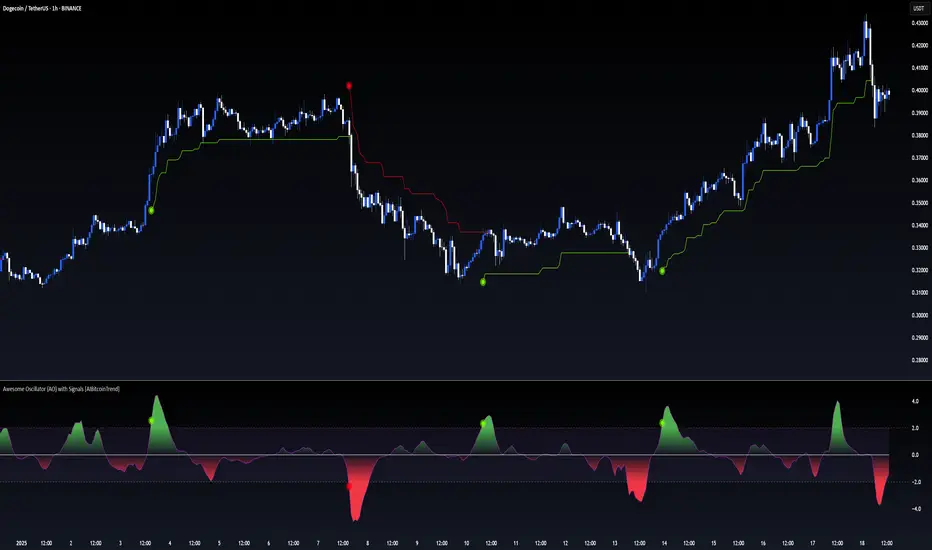
Awesome Oscillator (AO) with Signals [AIBitcoinTrend]👽 Multi-Scale Awesome Oscillator (AO) with Signals (AIBitcoinTrend)
The Multi-Scale Awesome Oscillator transforms the traditional Awesome Oscillator (AO) by integrating multi-scale wavelet filtering, enhancing its ability to detect momentum shifts while maintaining responsiveness across different market conditions.
Unlike conventional AO calculations, this advanced version refines trend structures using high-frequency, medium-frequency, and low-frequency wavelet components, providing traders with superior clarity and adaptability.
Additionally, it features real-time divergence detection and an ATR-based dynamic trailing stop, making it a powerful tool for momentum analysis, reversals, and breakout strategies.
👽 What Makes the Multi-Scale AO – Wavelet-Enhanced Momentum Unique?
Unlike traditional AO indicators, this enhanced version leverages wavelet-based decomposition and volatility-adjusted normalization, ensuring improved signal consistency across various timeframes and assets.
✅ Wavelet Smoothing – Multi-Scale Extraction – Captures short-term fluctuations while preserving broader trend structures.
✅ Frequency-Based Detail Weights – Separates high, medium, and low-frequency components to reduce noise and improve trend clarity.
✅ Real-Time Divergence Detection – Identifies bullish and bearish divergences for early trend reversals.
✅ Crossovers & ATR-Based Trailing Stops – Implements intelligent trade management with adaptive stop-loss levels.
👽 The Math Behind the Indicator
👾 Wavelet-Based AO Smoothing
The indicator applies multi-scale wavelet decomposition to extract high-frequency, medium-frequency, and low-frequency trend components, ensuring an optimal balance between reactivity and smoothness.
sma1 = ta.sma(signal, waveletPeriod1)
sma2 = ta.sma(signal, waveletPeriod2)
sma3 = ta.sma(signal, waveletPeriod3)
detail1 = signal - sma1 // High-frequency detail
detail2 = sma1 - sma2 // Intermediate detail
detail3 = sma2 - sma3 // Low-frequency detail
advancedAO = weightDetail1 * detail1 + weightDetail2 * detail2 + weightDetail3 * detail3
Why It Works:
Short-Term Smoothing: Captures rapid fluctuations while minimizing noise.
Medium-Term Smoothing: Balances short-term and long-term trends.
Long-Term Smoothing: Enhances trend stability and reduces false signals.
👾 Z-Score Normalization
To ensure consistency across different markets, the Awesome Oscillator is normalized using a Z-score transformation, making overbought and oversold levels stable across all assets.
normFactor = ta.stdev(advancedAO, normPeriod)
normalizedAO = advancedAO / nz(normFactor, 1)
Why It Works:
Standardizes AO values for comparison across assets.
Enhances signal reliability, preventing misleading spikes.
👽 How Traders Can Use This Indicator
👾 Divergence Trading Strategy
Bullish Divergence
Price makes a lower low, while AO forms a higher low.
A buy signal is confirmed when AO starts rising.
Bearish Divergence
Price makes a higher high, while AO forms a lower high.
A sell signal is confirmed when AO starts declining.
👾 Buy & Sell Signals with Trailing Stop
Bullish Setup:
✅AO crosses above the bullish trigger level → Buy Signal.
✅Trailing stop placed at Low - (ATR × Multiplier).
✅Exit if price crosses below the stop.
Bearish Setup:
✅AO crosses below the bearish trigger level → Sell Signal.
✅Trailing stop placed at High + (ATR × Multiplier).
✅Exit if price crosses above the stop.
👽 Why It’s Useful for Traders
Wavelet-Enhanced Filtering – Retains essential trend details while eliminating excessive noise.
Multi-Scale Momentum Analysis – Separates different trend frequencies for enhanced clarity.
Real-Time Divergence Alerts – Identifies early reversal signals for better entries and exits.
ATR-Based Risk Management – Ensures stops dynamically adapt to market conditions.
Works Across Markets & Timeframes – Suitable for stocks, forex, crypto, and futures trading.
👽 Indicator Settings
AO Short Period – Defines the short-term moving average for AO calculation.
AO Long Period – Defines the long-term moving average for AO smoothing.
Wavelet Smoothing – Adjusts multi-scale decomposition for different market conditions.
Divergence Detection – Enables or disables real-time divergence analysis. Normalization Period – Sets the lookback period for standard deviation-based AO normalization.
Cross Signals Sensitivity – Controls crossover signal strength for buy/sell signals.
ATR Trailing Stop Multiplier – Adjusts the sensitivity of the trailing stop.
Disclaimer: This indicator is designed for educational purposes and does not constitute financial advice. Please consult a qualified financial advisor before making investment decisions.
Divergence IQ [TradingIQ]Hello Traders!
Introducing "Divergence IQ"
Divergence IQ lets traders identify divergences between price action and almost ANY TradingView technical indicator. This tool is designed to help you spot potential trend reversals and continuation patterns with a range of configurable features.
Features
Divergence Detection
Detects both regular and hidden divergences for bullish and bearish setups by comparing price movements with changes in the indicator.
Offers two detection methods: one based on classic pivot point analysis and another that provides immediate divergence signals.
Option to use closing prices for divergence detection, allowing you to choose the data that best fits your strategy.
Normalization Options:
Includes multiple normalization techniques such as robust scaling, rolling Z-score, rolling min-max, or no normalization at all.
Adjustable normalization window lets you customize the indicator to suit various market conditions.
Option to display the normalized indicator on the chart for clearer visual comparison.
Allows traders to take indicators that aren't oscillators, and convert them into an oscillator - allowing for better divergence detection.
Simulated Trade Management:
Integrates simulated trade entries and exits based on divergence signals to demonstrate potential trading outcomes.
Customizable exit strategies with options for ATR-based or percentage-based stop loss and profit target settings.
Automatically calculates key trade metrics such as profit percentage, win rate, profit factor, and total trade count.
Visual Enhancements and On-Chart Displays:
Color-coded signals differentiate between bullish, bearish, hidden bullish, and hidden bearish divergence setups.
On-chart labels, lines, and gradient flow visualizations clearly mark divergence signals, entry points, and exit levels.
Configurable settings let you choose whether to display divergence signals on the price chart or in a separate pane.
Performance Metrics Table:
A performance table dynamically displays important statistics like profit, win rate, profit factor, and number of trades.
This feature offers an at-a-glance assessment of how the divergence-based strategy is performing.
The image above shows Divergence IQ successfully identifying and trading a bullish divergence between an indicator and price action!
The image above shows Divergence IQ successfully identifying and trading a bearish divergence between an indicator and price action!
The image above shows Divergence IQ successfully identifying and trading a hidden bullish divergence between an indicator and price action!
The image above shows Divergence IQ successfully identifying and trading a hidden bearish divergence between an indicator and price action!
The performance table is designed to provide a clear summary of simulated trade results based on divergence setups. You can easily review key metrics to assess the strategy’s effectiveness over different time periods.
Customization and Adaptability
Divergence IQ offers a wide range of configurable settings to tailor the indicator to your personal trading approach. You can adjust the lookback and lookahead periods for pivot detection, select your preferred method for normalization, and modify trade exit parameters to manage risk according to your strategy. The tool’s clear visual elements and comprehensive performance metrics make it a useful addition to your technical analysis toolbox.
The image above shows Divergence IQ identifying divergences between price action and OBV with no normalization technique applied.
While traders can look for divergences between OBV and price, OBV doesn't naturally behave like an oscillator, with no definable upper and lower threshold, OBV can infinitely increase or decrease.
With Divergence IQ's ability to normalize any indicator, traders can normalize non-oscillator technical indicators such as OBV, CVD, MACD, or even a moving average.
In the image above, the "Robust Scaling" normalization technique is selected. Consequently, the output of OBV has changed and is now behaving similar to an oscillator-like technical indicator. This makes spotting divergences between the indicator and price easier and more appropriate.
The three normalization techniques included will change the indicator's final output to be more compatible with divergence detection.
This feature can be used with almost any technical indicator.
Stop Type
Traders can select between ATR based profit targets and stop losses, or percentage based profit targets and stop losses.
The image above shows options for the feature.
Divergence Detection Method
A natural pitfall of divergence trading is that it generally takes several bars to "confirm" a divergence. This makes trading the divergence complicated, because the entry at time of the divergence might look great; however, the divergence wasn't actually signaled until several bars later.
To circumvent this issue, Divergence IQ offers two divergence detection mechanisms.
Pivot Detection
Pivot detection mode is the same as almost every divergence indicator on TradingView. The Pivots High Low indicator is used to detect market/indicator highs and lows and, consequently, divergences.
This method generally finds the "best looking" divergences, but will always take additional time to confirm the divergence.
Immediate Detection
Immediate detection mode attempts to reduce lag between the divergence and its confirmation to as little as possible while avoiding repainting.
Immediate detection mode still uses the Pivots Detection model to find the first high/low of a divergence. However, the most recent high/low does not utilize the Pivot Detection model, and instead immediately looks for a divergence between price and an indicator.
Immediate Detection Mode will always signal a divergence one bar after it's occurred, and traders can set alerts in this mode to be alerted as soon as the divergence occurs.
TradingView Backtester Integration
Divergence IQ is fully compatible with the TradingView backtester!
Divergence IQ isn’t designed to be a “profitable strategy” for users to trade. Instead, the intention of including the backtester is to let users backtest divergence-based trading strategies between the asset on their chart and almost any technical indicator, and to see if divergences have any predictive utility in that market.
So while the backtester is available in Divergence IQ, it’s for users to personally figure out if they should consider a divergence an actionable insight, and not a solicitation that Divergence IQ is a profitable trading strategy. Divergence IQ should be thought of as a Divergence backtesting toolkit, not a full-feature trading strategy.
Strategy Properties Used For Backtest
Initial Capital: $1000 - a realistic amount of starting capital that will resonate with many traders
Amount Per Trade: 5% of equity - a realistic amount of capital to invest relative to portfolio size
Commission: 0.02% - a conservative amount of commission to pay for trade that is standard in crypto trading, and very high for other markets.
Slippage: 1 tick - appropriate for liquid markets, but must be increased in markets with low activity.
Once more, the backtester is meant for traders to personally figure out if divergences are actionable trading signals on the market they wish to trade with the indicator they wish to use.
And that's all!
If you have any cool features you think can benefit Divergence IQ - please feel free to share them!
Thank you so much TradingView community!

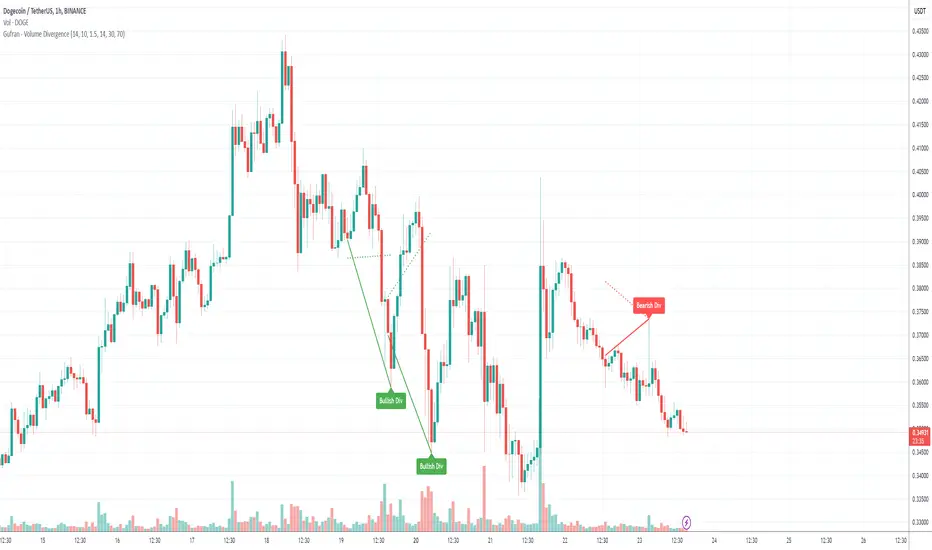
Gufran - Volume DivergenceThis indicator detects bullish and bearish divergences by analyzing price action, volume trends, and RSI (Relative Strength Index) for added confirmation. It highlights key market reversals or trend continuations by identifying when price movement diverges from volume dynamics, providing traders with actionable insights for entry and exit points.
Key Features:
Divergence Detection:
Bullish Divergence: Price makes a lower low, but volume shows higher lows, signaling potential upward reversals.
Bearish Divergence: Price makes a higher high, but volume shows lower highs, signaling potential downward reversals.
RSI Confirmation:
Bullish Signals: Confirmed when RSI is in the oversold zone.
Bearish Signals: Confirmed when RSI is in the overbought zone (optional relaxation of RSI conditions available).
Normalized Volume Analysis:
Volume is scaled to the price range, ensuring clear and meaningful visualization alongside price action.
Customizable Parameters:
Lookback Period: Define how far back the script looks to identify divergences.
Volume Significance: Adjust the threshold for significant volume movements.
RSI Levels: Fine-tune overbought and oversold thresholds for optimal signal accuracy.
Gap Control: Avoid clutter by setting a minimum number of candles between successive divergence signals.
Clear Visual Representation:
Bullish Divergence: Marked with green labels and connecting lines.
Bearish Divergence: Marked with red labels and connecting lines.
Dotted lines show normalized volume divergence, while solid lines indicate price divergence.
Ideal For:
Traders who rely on volume dynamics to validate price movements.
Those looking for an added layer of confidence using RSI to filter false signals.
Swing and intraday traders aiming to identify market reversal zones or continuation patterns.
Customization Options:
Lookback Period: Adjustable range for detecting highs and lows.
Volume Threshold: Define the multiplier for significant volume changes.
RSI Settings: Tailor overbought/oversold levels to suit your trading style.
Relax RSI Condition: Toggle stricter or more flexible conditions for bearish divergences.
How to Use:
Add the indicator to your chart and configure the parameters to fit the asset and timeframe you are trading.
Look for:
Green “Bullish Div” labels near price lows for potential buying opportunities.
Red “Bearish Div” labels near price highs for potential selling opportunities.
Use this indicator in combination with other tools like support/resistance levels, trendlines, or moving averages for a comprehensive trading strategy.
Disclaimer:
This indicator is a tool for educational purposes and should not be used as a standalone trading signal. Always conduct proper risk management and consider additional technical/fundamental analysis before making trading decisions.
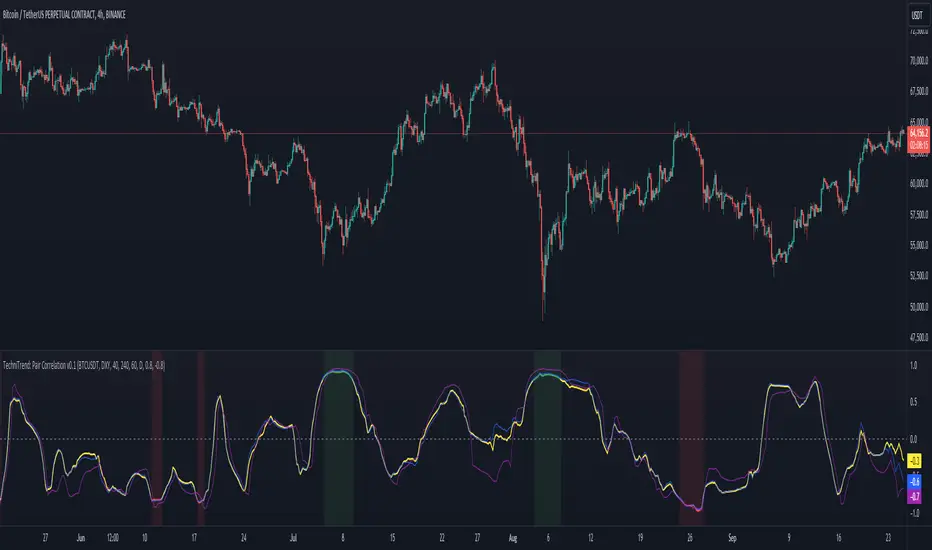
TechniTrend: Dynamic Pair CorrelationTechniTrend: Dynamic Pair Correlation
Description:
The TechniTrend: Dynamic Pair Correlation is a powerful and versatile indicator designed to track the correlation between two assets—whether cryptocurrencies, indices, or other financial instruments—across multiple timeframes. Understanding correlations can provide deep insights into market behavior, helping traders make informed decisions based on how two assets move in relation to each other.
Key Features:
Customizable Pair Selection: Compare any two assets (e.g., Bitcoin and DXY, Ethereum and SP500) to study how their price movements relate over time.
Multi-Timeframe Analysis: Simultaneously track correlations across different timeframes—standard, lower, and higher—providing a comprehensive view of market dynamics.
Dynamic Color Coding for Correlation Strength: Instantly spot correlations with visually intuitive colors—green for strong positive correlation, red for strong negative correlation, and yellow for neutral.
Heatmap Background: An easy-to-read background color heatmap highlights when correlations hit extreme levels, adding another layer of insight to your charts.
Real-Time Alerts: Get notified when correlations exceed your custom thresholds, signaling opportunities for potential breakouts, reversals, or divergences.
Divergence Detection: Automatically highlight moments when asset prices diverge, offering potential entry/exit points for smart trading decisions.
How to Use:
Asset Pair Comparison: Select two symbols to analyze their price correlation, such as BTC/USDT and DXY, or any other pair that fits your strategy.
Set Your Timeframes: Customize your standard, lower, and higher timeframes to monitor correlations at different intervals, allowing you to capture both short-term and long-term relationships.
Track Correlation Strength: Use dynamic color coding to quickly see how closely two assets are moving together. Strong correlations (positive or negative) could signal potential opportunities, while low correlations may indicate the absence of a strong trend.
Utilize Alerts: Receive real-time alerts when correlations cross your predefined thresholds, helping you take action when the market presents strong alignment or divergence.
Divergence Signals: Watch for divergence between the assets on multiple timeframes, which could indicate a potential trend reversal or a shift in market behavior.
Why It’s Essential:
Understanding the relationship between two assets can be a game changer for traders. Whether you're comparing Bitcoin to DXY, tracking the correlation between Ethereum and major indices, or evaluating two cryptocurrencies, this indicator gives you the tools to visualize and respond to market conditions with precision.
Perfect For:
Crypto traders looking to optimize strategies by monitoring the relationship between major cryptocurrencies and other assets.
Arbitrageurs seeking to capitalize on temporary pricing anomalies between correlated pairs.
Trend-followers aiming to catch large movements by detecting alignment or divergence between asset classes.
Portfolio managers monitoring how different asset classes impact each other to hedge or diversify investments.
By leveraging the TechniTrend: Dynamic Pair Correlation indicator, traders can gain deeper insights into market trends, correlations, and divergences, giving them an edge in fast-moving markets.
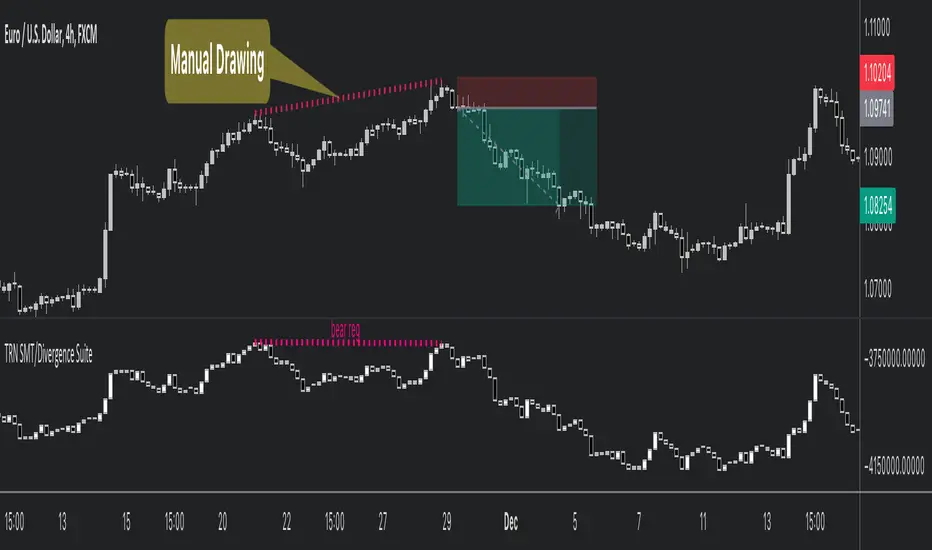
SMT/Divergence Suite (any Indicator)Hello Traders!
The TRN SMT/Divergence Suite detects divergences for any given indicator, even custom ones and divergences any two given instruments (SMT – smart money technique/tool). The indicator finds with unrivaled precision bullish and bearish as well as regular and hidden divergences. The main difference compared to other SMT/divergences indicators is that this indicator finds rigorously the extreme peaks of each swing, both in price and in the corresponding indicator/instrument. This precision is unmatched and therefore this is one of the best SMT/divergences detectors. The indicator helps traders to identify potential changes in trend before they occur.
Feature List
Works with any given custom oscillators or indicator
SMT (Smart Money Technique)/Divergence detecting for any given instruments
11 different build-in oscillators (incl. Cumulative Delta)
Customizable look and feel
The TRN SMT/Divergence Suite works with any given indicator, even custom ones. In addition, there are 11 built-in indicators. We have chosen a selection of different momentum, trend following and volume oscillators that gives you maximum flexibility. Most noticeable is the cumulative delta indicator, which works astonishingly well as a divergence indicator.
Following is the full list of the build in indicators/oscillators:
Awesome Oscillator (AO)
Commodity Channel Index (CCI)
Cumulative Delta Volume (CDV)
Chaikin Money Flow (CMF)
Moving Average Convergence Divergence (MACD)
Money Flow Index (MFI)
Momentum
On Balance Volume (OBV)
Relative Strength Index (RSI)
Stochastic
Williams Percentage Range (W%R)
The divergences are colored with vivid lines and labels. Bullish divergences are distinguished with luminous blue lines, while bearish divergences are denoted by striking red lines. Upon detecting a divergence, the colored lines act as a visual indicator for traders, signaling an imminent possibility of a trend reversal. In response, traders can leverage this valuable insight to make informed decisions in their trading activities.
Choose Your Custom Divergence Indicator
Handpick your custom indicator, and the TRN SMT/Divergence Suite will hunt for divergences in your preferred market and timeframe. Importantly, you must add the indicator to your chart. Afterwards, simply go to the “Parameters” section in the indicator settings and choose "External Indicator/SMT". If the custom indicator has one reference value, then choose this value in the “External Indicator/SMT (High)” field. If there are high and low values (e.g. candles), then you also must set the “External Indicator Low/SMT” field.
In the provided graphic, we've chosen the stochastic RSI as our example, and as you can see, the TRN SMT/Divergence Suite instantly identifies and plots bullish and bearish divergences on your chart.
Make sure that the TRN SMT/Divergence Suite is in the same panel as the custom divergence indicator and that both indicators are pinned to the same scale of your chart.
Smart Money Technique (SMT)/Divergence detecting in Relation to other Instruments
Smart Money Technique/Tool (SMT) means the divergence detection between two related instruments. The TRN SMT/Divergence Suite finds divergences in relation to other instruments, e.g. NQ vs. ES or BTCUSDT vs. ETHUSDT. Just add another instrument to the chart. As representation style you can choose lines or candles/bars. Afterwards, simply go to the “Parameters” section in the indicator settings and choose "External Indicator/SMT". If the second instrument is represented as line, then choose this value in the “External Indicator/SMT (High)” field. If there are high and low values (e.g. candles/bars), then you also must set the “External Indicator/SMT Low” field.
The detection of SMTs can help traders to decide whether the trend continues, or a reversal is imminent. E.g. if the NQ makes a new higher high but the ES fails to do so and makes a new lower high, then the TRN SMT/Divergence Suite shows a divergence. As a result, the probability is high that the trend will not continue, and the trader can make an informed decision about what to do next.
How to set Parameters for Divergence Indicators
To begin, access the indicator settings. Look for the "Parameters" section where you can fine-tune Parameters 1-3. The default settings are already optimized for the oscillators AO, RSI, CDV, W%R, MFI and Stochastic. For other divergence indicators, you might want to adjust the settings to your liking. The parameter order is the same as in the corresponding divergence indicator.
What are Divergences?
When the price of an asset moves in one direction, but its indicators move in the opposite direction, this is called a divergence. Divergences can be a powerful signal that a trend reversal is about to occur.
There are two types of regular divergences: bullish and bearish. A bullish divergence occurs when the price of an asset makes a lower low, but its indicators make a higher low. This can be a sign that the asset is oversold and that a reversal is imminent. A bearish divergence, on the other hand, occurs when the price of an asset makes a higher high, but its indicators (such as Relative Strength Index - RSI) make a lower high. This can be a sign that the asset is overbought and that a reversal is imminent.
Next to regular divergences there are hidden divergences. These divergences occur when the price of an asset moves in the opposite direction of an indicator, suggesting a possible shift in the underlying trend. In trading, hidden bearish and hidden bullish divergences are patterns that traders often look for on price charts to identify potential trend reversals or continuation patterns.
Conclusion
While signals from TRN SMT/Divergence Suite can be informative, it is important to recognize that their reliability may vary. Bearish and bullish divergences are not foolproof indicators and should be used in conjunction with other analysis techniques and risk management strategies.
Risk Disclaimer
The content, tools, scripts, articles, and educational resources offered by TRN Trading are intended solely for informational and educational purposes. Remember, past performance does not ensure future outcomes.
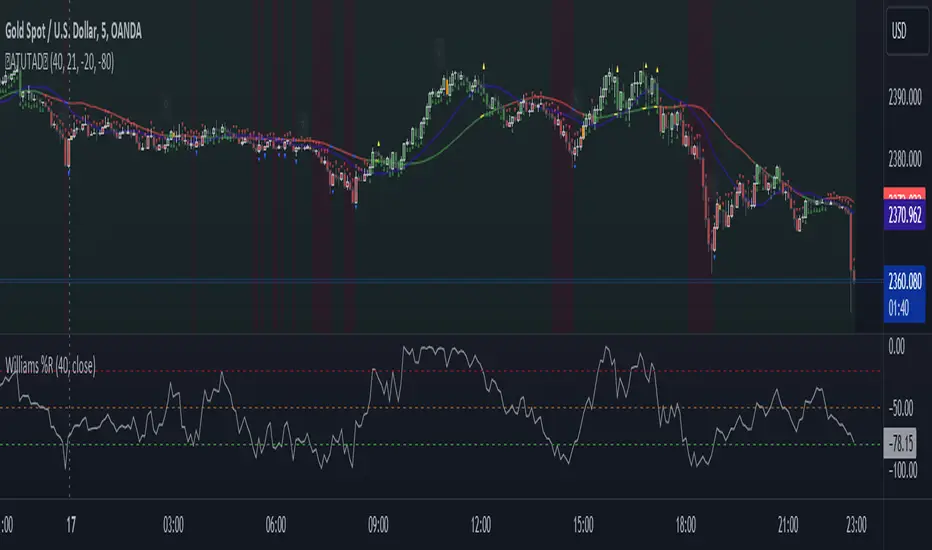
AllTheUpsTheresAlwaysDowns "AllTheUpsTheresAlwaysDowns" ☆ATUTAD☆ // w%r + ma indicator designed for forex trading.
This indicator combines the Williams %R, moving averages, and session tracking.
Key Inputs:
Williams%Range Period: Adjusts the sensitivity of the Williams %R calculation.
Moving Average Period: Defines the period for the moving average used in the indicator.
Overbought and Oversold Thresholds: Sets the thresholds for identifying overbought and oversold conditions.
Features:
Williams %R Calculation: Calculates the Williams %R, a momentum oscillator that measures overbought and oversold levels.
Moving Averages: Plots two moving averages to capitalize on and visualize trend direction.
Session Tracking: Identifies the start and end of trading sessions (Tokyo, London, New York) for better session-based analysis.
Signal Generation: Generates buy/sell signals based on Williams %R levels and moving average crossovers.
Color Coding: Visualizes color-coded bars and shapes to highlight different market conditions and signal types.
Alerts: For buy/sell signals and overbought/oversold conditions to prompt timely actions.
Usage Tips:
Interpret Signals: Trend direction through buy/sell signals and overbought/oversold trend,- reversal / breakout line conditions for potential trading opportunities.
Session Awareness: Take into account the trading sessions (Tokyo, London, New York) to move along with the market dynamics during different times of the day.
Confirmation: Use additional technical analysis tools to confirm signals before executing trades. For example the Williams Percetange Range indicator.
Risk Management: Trade with proper risk management strategies to avoid potential losses.
HappyTrading
Fisher+ [OSC]The Fisher Transform Indicator is classified as an oscillator, meaning that its value swings above and below a central point. This characteristic allows traders to identify overbought and oversold conditions, providing potential clues about market reversals. As mentioned previously, it is an oscillator so the strength of the move is displayed by how long the fisher line stays above/below zero. Indicator can be used to aid in confluence near supply/demand zones.
White Line = Fisher
Red/Blue Line = Moving Average
--Changes color whether fisher line is above/below the MA
Red/Blue Shaded Line = Moving Average
--Changes color based on a smoothing factor
Red/Blue Shaded Fill = Asset in Overbought/Oversold Conditions
Red/Blue Circles = Asset in Extreme Overbought/Oversold Conditions
Red/Blue Triangles = MACD Signals Below/Above "0"
Divergence Labels = Asset Signaling Divergence
The moving average line will turn red/blue as long as the fisher line is below/above the moving average. The shaded MA line will switch colors based on if it is moving in an up/down trend. The MA can also be used as a signal and treated similar to an oscillator. Market trending conditions will either keep the MA below/above the dashed zero line.
MACD code credited to LazyBear's MACD Leader indicator. It is used to filter out/confirm any signals such as divergences. As long as the MACD Leader line is above both the MACD line and signal lines then it'll signal with with a triangle. MACD divergences will be added at a later time.

YD_Divergence_RSI+CMFThe ‘YD_Divergence_RSI+CMF’ indicator can find divergence using RSI (Relative Strength Index) and CMF (Chaikin Money Flow) indicators.
📌 Key functions
1. Search pivot high and pivot low points in a certain length of price.
2. Connect pivot high to pivot high , pivot low to pivot low , forming two standards for divergence in result.
The marker then plots only the higher high, lower low lines.
(higher low and lower high in prices are referred to hidden divergence, which are not considered in this indicator)
3. Compare the two standards with RSI and CMF indicators, send an alert if there is a divergence. As a result, the indicator will find four combination of divergence.
A. Higher high price / Lower RSI (Bearish RSI Divergence)
B. Lower low price / Higher RSI (Bullish RSI Divergence)
C. Higher high price / Lower CMF (Bearish CMF Divergence)
D. Lower low price / Higher CMF (Bullish CMF Divergence)
📌 Details
Developing the indicators, we put a lot of effort in making a customizable and user-friendly interface.
#1. Pivot Setting
Users can set the length to find the pivot high / pivot low in ‘Pivot Settings – Pivot Length.’
Increased pivot Length takes more candles to interpret the chart but reduce false signals since the it uses only the most certain pivot high / pivot low values. Obviously, decreased pivot length will act the opposite.
Users can choose whether to use ‘High/Low’ or ‘Close’ in ‘Pivot Reference’ to set the swing point of prices.
Users can also choose whether to display the pivot high / pivot low marker on the chart.
#2 RSI & CMF Settings
Users can adjust the length of RSI & CMF separately. (The default values are set to 14 and 20 each.)
#3 Label Setting
Users can adjust the text displayed on the chart label. (The default values is set to ‘Bullish / Bearish’, ‘RSI/CMF’, ‘Divergence’.)
Users can reduce the length of text label or simply turn the label off. Just click the ‘Bull/Bear’ or ‘None’ button. ‘Divergence’ works the same.
Users can decide whether to display the ‘Divergence Line and Label’, set custom settings for the label and line. (color, thickness, style, etc)
📌 Alert
Alert are provided as a combination of the chart's symbol and the set label text. For example,
‘BINANCE:BTCUSDT.P, Bullish RSI Divergence’
====================================================
"YD_Divergence_RSI+CMF" 지표 는 RSI와 CMF 지표를 이용해서 Divergence 를 찾아낼 수 있습니다.
📌 주요 기능
1. 정해진 가격 움직임 안에서 pivot high와 pivot low 포인트 를 찾아냅니다.
2. Pivot high로만 이어진 라인과, Pivot low로만 이어진 두 라인을 작도한 뒤 divergence의 기준으로 삼습니다.
이 지표에서는 normal divergence만 사용하기 때문에 차트에 higher high와 lower low만 표기 합니다.
(higher low와 lower high는 hidden divergence로 정의되며, 이 지표에서는 다루지 않습니다.
3. 두 기준선과 RSI, CMF 지표를 각각 비교하고, 결과적으로 4개의 조합을 구할 수 있습니다.
A. Higher high price / Lower RSI (Bearish RSI Divergence)
B. Lower low price / Higher RSI (Bullish RSI Divergence)
C. Higher high price / Lower CMF (Bearish CMF Divergence)
D. Lower low price / Higher CMF (Bullish CMF Divergence)
📌 세부 사항
지표를 개발하며 사용자들이 원하는 방향으로 지표를 설정할 수 있게 작업에 많은 공을 들였습니다. 굉장히 다양한 옵션을 선택할 수 있으며, 원하는 방식으로 지표를 사용할 수 있습니다.
#1 Pivot Setting
Pivot setting에서는 Pivot Length를 변경할 수 있습니다.
Pivot Length를 늘릴 경우, 보다 확실한 Swing High와 Swing Low만을 사용하게 되므로, False signal이 줄어들 수 있습니다. 하지만 Swing High/ Low를 판정하는 데에 더 긴 시간이 걸리게 되므로, Signal이 다소 늦게 발생하는 단점이 생기게 됩니다.
Pivot Length를 줄일 경우, 반대로 Swing High/Low의 판정이 더 빨리 일어나기 때문에, Signal을 거래에 이용하기는 좋을 수 있습니다. 다만, Swing High와 Low가 훨씬 더 잦은 빈도로 발생하기 때문에 False Signal을 줄 가능성이 높아집니다.
Pivot Reference에서는 가격의 Swing Point를 설정함에 있어, High/Low(고가/저가)를 이용할 지 Close (종가)를 이용할 지 선택할 수 있습니다.
Pivot High/Low Marker를 선택할 경우 Pivot High/ Low에 Marker가 찍히게 됩니다.
#2 RSI와 CMF Setting
RSI와 CMF Setting에서는 RSI와 CMF의 길이를 각각 설정할 수 있습니다. 기본값은 14와 20으로 설정되어 있습니다.
#3 Label Setting
Label Setting에서는 Label에 표시되는 글자를 선택할 수 있습니다.
기본값은 "Bullish / Bearish", "RSI/CMF", "Divergence"로 선택되어 있으며, 너무 길다고 느껴질 경우 "Bull/Bear" 혹은 "None"을 클릭하여 길이를 줄일 수 있습니다. 마찬가지로 Divergence의 경우도 생략이 가능합니다.
하단에서는 Divergence Line과 Label을 켜고 끌 수 있으며, 선의 색깔, 굵기, 종류, 그리고 Label의 색깔, 크기, 종류를 선택할 수 있습니다. Label의 Text 색 역시 변경이 가능합니다.
📌 얼러트
얼러트는 자신이 설정한 차트의 심볼과 Label의 문구의 조합으로 제공되며 예를 들면 다음과 같습니다.
"BINANCE:BTCUSDT.P, Bullish RSI Divergence"

Bullish Divergence Short-term Long Trade FinderThis script is a Bullish divergence trade finder built to find small periods where Bitcoin will likely rise from. It looks for bullish divergence followed by a higher low as long as the hour RSI value is below the 40 mark, if then it will enter an long. It marks out Buy signals on the RSI if the value dips below 'RSI Bull Condition Minimum' (Default 40) on the current time frame in view. It also marks out Sell signals found when the RSI is above the 'RSI Bearish Condition Minimum' (Default 50). The sell signals are bearish divergence that has occurred recently on the RSI. When a long is in play it will sell if it finds bearish divergence or the time frame in view reaches RSI value higher than the 'RSI Sell Value'(Default 75). You can set your stop loss value with the 'Stop loss Percentage' (default 5).
Available inputs:
RSI Period: relative strength measurement length(Typically 14)
RSI Oversold Level: the bottom bar of the RSI (Typically 30)
RSI Overbought Level: the top bar of the RSI (Typically 70)
RSI Bearish Condition Minimum: The minimum value the script will use to look for a pivot high that starts the Bearish condition to Sell (Default 50)
RSI Bearish Condition Sell Min: the minimum value the script will accept a bearish condition (Default 60)
RSI Bull Condition Minimum: the minimum value it will consider a pivot low value in the RSI to find a divergence buy (Default 40)
Look Back this many candles: the amount of candles thee script will look back to find a low value in the RSI (Default 25)
RSI Sell Value: The RSI value of the exit condition for a long when value is reached (Default 75)
Stop loss Percentage: Percentage value for amount to lose (Default 5)
The formula to enter a long is stated below:
If price finds a lower low and there is a higher low found following a lower low and price has just made another dip and price closes lower than the last divergence and Relative strength index hour value is less than 40 enter a long.
The formula to exit a long is stated below:
If the value drops below the stop loss percentage OR (the RSI value is greater than the value of the parameter 'RSI Sell Value' or bearish divergence is found greater than the parameter 'RSI Bearish Condition Minimum' )
This script was built from much strategy testing on BTC but works with alts (occasionally) also. It is most successful to my knowledge using the 15 min and 7 min time frames with default values. Hope it helps! Follow for further possible updates to this script or other entry or exit strategies.
snapshot:
I only have a Pro trading view account so I cannot share a larger data set about this script because the buy signals happen pretty rarely. The most amount that I could find within a view for me was 40 trades within a viewable time. The suggested/default parameters that I have do not occur very often so it limits the data set. Adjustments can be made to the parameters so that trades can be entered more often. The scripts success is dependent on the values of the parameters set by the user. This script was written to be used for BTC/USD or BTC/USDT trading. I am unable to share a larger dataset without putting out results that are intended to fail or having a premium account so reaching the 100 trade minimum is not possible with my account.

Divergence IndicatorDescription:
The Divergence Indicator (DI) is a powerful technical analysis tool designed to identify potential bullish and bearish signals based on multiple indicators, including RSI, Stochastic Oscillator, MACD, and EMA. It helps traders spot divergences between price and these indicators, indicating potential trend reversals or continuations.
How it Works:
The Divergence Indicator compares various indicators and their relationships with price to identify bullish and bearish signals. It considers conditions such as rising or falling values of the Stochastic Oscillator (%K), RSI, and MACD lines, as well as the crossover and crossunder of the MACD Line and Signal Line. Additionally, it evaluates the relationship between fast and slow Exponential Moving Averages (EMA) to detect divergences. When a bullish or bearish condition is met, circles are plotted on the chart to highlight the signals.
Usage:
To effectively utilize the Divergence Indicator, follow these steps:
1. Apply the DI indicator to your chart by adding it from the available indicators.
2. Customize the color settings to suit your preferences. The bullish and bearish colors determine the colors of the plotted circles.
3. Observe the circles plotted on the chart:
- Bullish circles indicate potential bullish signals.
- Bearish circles indicate potential bearish signals.
4. Interpret the signals provided by the indicator:
- A bullish signal may occur when there is price divergence accompanied by rising values of the Stochastic Oscillator (%K), RSI, and MACD lines, or when the MACD Line crosses above the Signal Line. Additionally, a histogram value close to zero may strengthen the signal.
- A bearish signal may occur when there is price divergence accompanied by falling values of the Stochastic Oscillator (%K), RSI, and MACD lines, or when the MACD Line crosses below the Signal Line. A histogram value close to zero may also strengthen the signal.
5. Be cautious of false signals by considering additional factors such as the relationship between the fast and slow Exponential Moving Averages (EMA). If the EMAs or MACD values do not support the identified divergence, the signal may be less reliable.
6. Combine the signals from the Divergence Indicator with other technical analysis tools, such as support and resistance levels, trend lines, or candlestick patterns, to confirm potential trade setups.
7. Implement appropriate risk management strategies, including setting stop-loss orders and position sizing, to manage your trades effectively and protect your capital.
Note: The Divergence Indicator provides valuable insights into potential trend reversals or continuations based on divergences between price and multiple indicators. However, it is recommended to use this indicator in conjunction with other technical analysis tools and perform thorough analysis before making trading decisions.
Dynamo
╭━━━╮
╰╮╭╮┃
╱┃┃┃┣╮╱╭┳━╮╭━━┳╮╭┳━━╮
╱┃┃┃┃┃╱┃┃╭╮┫╭╮┃╰╯┃╭╮┃
╭╯╰╯┃╰━╯┃┃┃┃╭╮┃┃┃┃╰╯┃
╰━━━┻━╮╭┻╯╰┻╯╰┻┻┻┻━━╯
╱╱╱╱╭━╯┃
╱╱╱╱╰━━╯
Overview
Dynamo is built to be the Swiss-knife for price-movement & strength detection, it aims to provide a holistic view of the current price across multiple dimensions. This is achieved by combining 3 very specific indicators(RSI, Stochastic & ADX) into a single view. Each of which serve a different purpose, and collectively provide a simple, yet powerful tool to gauge the true nature of price-action.
Background
Dynamo uses 3 technical analysis tools in conjunction to provide better insights into price movement, they are briefly explained below:
Relative Strength Index(RSI)
RSI is a popular indicator that is often used to measure the velocity of price change & the intensity of directional moves. RSI computes the relative strength of the current price by comparing the security’s bullish strength versus bearish strength for a given period, i.e. by comparing average gain to average loss.
It is a range bound(0-100) variable that generates a bullish reading if average gain is higher, and a bullish reading if average loss is higher. Values over 50 are generally considered bullish & values less than 50 indicate a bearish market. Values over 70 indicate an overbought condition, and values below 30 indicate oversold condition.
Stochastic
Stochastic is an indicator that aims to measure the momentum in the market, by comparing most recent closing price of the security to its price range for a given period. It is based on the assumption that price tends to close near the recent high in an up trend, and it closes near the recent low during a down trend.
It is also range bound(0-100), values over 80 indicate overbought condition and values below 20 indicate oversold condition.
Average Directional Index(ADX)
ADX is an indicator that can quantify trend strength, it is derived from two underlying indices, known as Directional Movement Index(DMI). +DMI represents strength of the up trend, and -DMI represents strength of the down trend, and ADX is the average of the two.
ADX is non-directional or trend-neutral, which means, it does not follow the direction of the price, instead ADX will rise only when there is a strong trend, it does not matter if it’s an up trend or a down trend. Typical ranges of ADX are 25-50 for a strong trend, anything below 25 is considered as no trend or weak trend. ADX can frequently shoot upto higher values, but it generally finds exhaustion levels around the 60-75 range.
About the script
All these indicators are very powerful tools, but just like any other indicator they have their limitations. Stochastic & ADX can generate false signals in volatile markets, meaning price wouldn’t always follow through with what’s being indicated. ADX may even fail to generate a signal in less volatile markets, simply because it is based on moving averages, it tends to react slower to price changes. RSI can also lose it’s effectiveness when markets are trending strong, as it can stay in the overbought or oversold ranges for an extended period of time.
Dynamo aims to provide the trader with a much broader perspective by bringing together these contrasting indicators into a single simplified view. When Stochastic becomes less reliable in highly volatile conditions, one can cross validate their deduction by looking at RSI patterns. When RSI gets stuck in overbought or oversold range, one can refer to ADX to get better picture about the current trend. Similarly, various combinations of rules & setups can be formulated to get a more deterministic view, when working with either of these indicators.
There many possible use cases for a tool like this, and it totally depends on how you want to use it. An obvious option is to use it to trigger signals only after it has been confirmed by two or more indicators, for example, RSI & Stochastic make a great combination for cross-over or cross-under strategies. Some of the other options include trend detection, strength detection, reversals or price rejection points, possible duration of a trend, and all of these can very easily be translated into effective entry and exit points for trades.
How to use it
Dynamo is an easy-to-use tool, just add it to your chart and you’re good to start with your market analysis. Output consists of three overlapping plots, each of which tackle price movement from a slightly different angle.
Stochastic: A momentum indicator that plots the current closing price in relation to the price-range over a given period of time.
Can be used to detect the direction of the price movement, potential reversals, or duration of an up/down move.
Plotted as grey coloured histograms in the background.
Relative Strength Index(RSI): RSI is also a momentum indicator that measures the velocity with which the price changes.
Can be used to detect the speed of the price movement, RSI divergences can be a nice way to detect directional changes.
Plotted as an aqua coloured line.
Average Directional Index(ADX): ADX is an indicator that is used to measure the strength of the current trend.
Can be used to measure how strong the price movement is, both up and down, or to establish long terms trends.
Plotted as an orange coloured line.
Features
Provides a well-rounded view of the market movement by amalgamating some of the best strength indicators, helping traders make better informed decisions with minimal effort.
Simplistic plots that aim to convey clean signals, as a result, reducing clutter on the chart, and hopefully in the trader's head too.
Combines different types of indicators into a single view, which leads to an optimised use of the precious screen real-estate.
Final Note
Dynamo is designed to be minimalistic in functionality and in appearance, as it is being built to be a general purpose tool that is not only beginner friendly, but can also be highly-configurable to meet the needs of pro traders.
Thresholds & default values for the indicators are only suggestions based on industry standards, they may not be an exact match for all markets & conditions. Hence, it is advisable for the user to test & adjust these values according their securities and trading styles.
The chart highlights one of many possible setups using this tool, and it can used to create various types of setups & strategies, but it is also worth noting that the usability & the effectiveness of this tool also depends on the user’s understanding & interpretation of the underlying indicators.
Lastly, this tool is only an indicator and should only be perceived that way. It does not guarantee anything, and the user should do their own research before committing to trades based on any indicator.

True Momentum OscillatorThe True Momentum Oscillator (TMO) calculates the delta of the price using the open and close. We have taken the true momentum oscillator a step further and have added the momentum of the main signal (TMO) and the smooth signal line. We believe this helps give a clearer picture of price momentum and helps verify crossovers of the TMO and the smooth signal line. The momentum lines can also help confirm a divergence of the TMO. We have also added multiple moving average options so the user can customize the TMO to suit their needs.
TMO- Green when above Smooth Signal Line, red when below Smooth Signal Line
Smooth Signal- Gray Line
Histogram- TMO-Smooth Signal
TMO Momentum- Orange line
Smooth Signal Momentum- Yellow line
Overbought/Oversold regions- Gray highlighted boundaries
The TMO has defined overbought and oversold regions where either a crossover signal or divergence in the oscillator itself can be taken as a signal. Similar to the MACD, a crossover of the zero line by the TMO can also be utilized as a signal.

Divergence Finder (RSI/Price) with OptionsDivergence finder used to find BUY or SELL Signal based on a divergence between Price and RSI (Price goes UP when RSI goes down / opposite )
You can configure the script with several Options :
Source for Price Buy Div : you can use the close price of the candle (by default) or use the high price of the candle for exemple.
Source for Price Sell Div : you can use the close price of the candle (by default) or use the low price of the candle for exemple.
Source for RSI Div : you can use the close price of the candle (by default) to calculate the RSI .
Theses settings allow you to set a minimum RSI level to reach to activate the Divergence finder (p1 is the first point in time, and p2 is the second one):
Min RSI for Sell divergence(p1) : this is the minimum RSI level to reach for the first of the 2 points of divergence (Default 70) for the SELL Signal
Min RSI for Sell divergence (p2) : this is the minimum RSI level to reach for the second of the 2 points of divergence (Default 60) for the SELL Signal
Max RSI for Buy divergence (p1) : this is the minimum RSI level to reach for the first of the 2 points of divergence (Default 30) for the BUY Signal
Max RSI for Buy divergence (p2) : this is the minimum RSI level to reach for the second of the 2 points of divergence (Default 40 ) for the BUY Signal
Theses settings allow you to set a minimum margin difference between our two points (p1 and p2) to validate the Divergence
Min margin between price for displaying divergence (%) : Set a minimum margin (in % of the price) before the indicator validate this divergence
Min margin between RSI for displaying divergence (%) : Set a minimum margin (in % of the RSI ) before the indicator validate this divergence
Display Divergence label : Choose to display the price of the candle, and the RSI when a divergence is found
Display tops/bottoms : Display where the tops and bottoms are calculated directly on the chart
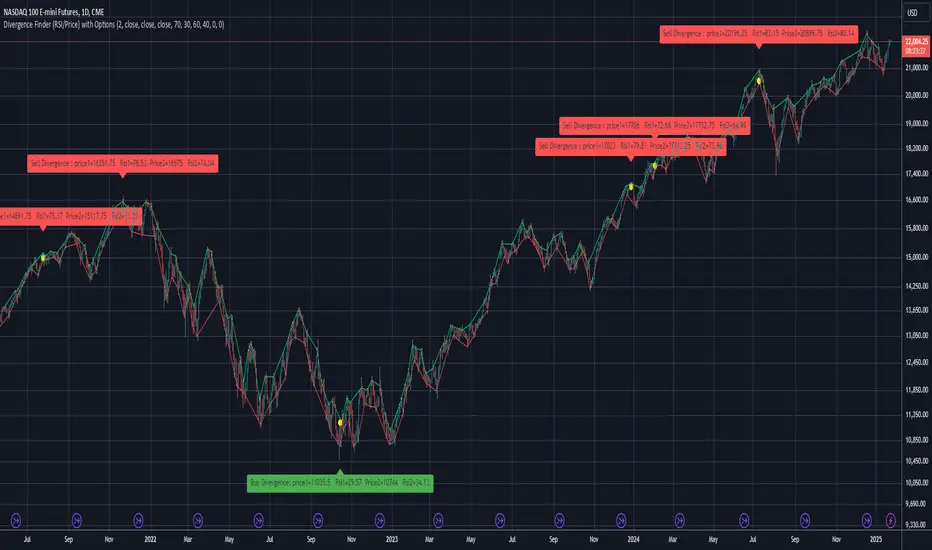
RSI DivergenceWhat is "RSI Divergence"?
"RSI Divergence" is a indicator that find RSI divergence automatically.
What it does?
When it finds an RSI divergence, it draws a line on the indicator.
How it does it?
The lines are found using the least squares method. If the signs of the linear regression on the graph and the linear regression plotted on the RSI are different, this is considered divergence.
How to use it?
RSI lenght = RSI lenght
source = source of RSI
RSI Divergence Lenght = lenght of lines that draws on indicator
zoom = zoom
examples:

Price Divergence IndicatorThis Price Divergence Indicator indicator modifies the standard Divergence Indicator to look for price divergences between the current chart and any other selected TradingView chart.
The thesis that this indicator is built upon:
Prices on assets or indices that are normally correlated move in lock step. Where there are deviations between the confirmed highs or lows of two assets or indices it is likely that they will "catch up" in the near future.
By default it will load the price data for the SPX and look for price divergences on the current chart timeframe. Any TradingView Symbol can be selected as the 'Comparison Source' and any timeframe. Some of the options I've been trying out include:
SPX vs NDQ
XAO vs SPX
UK100 vs NDQM
MSFT vs NDQM
GOOG vs NDQM
AMZN vs MSFT
BTC vs ETH
BTC vs NDQ
BTC vs DXY
I've found looking for divergences on a longer timeframe can be useful and don't expect any meaningful results if you set it to shorter than chart timeframes.
Alerts can be created based on any of the divergences and the 'Backtest Buy Signal' can be used to send notification to a backtester (bull = 2, hidden bull = 1, neutral = 0, hidden bear = -1, bear = -2), this is plotted to display.none, so enable it in Settings - Style and disable all other plots to see it.
Divergences are measured between the CONFIRMED peaks of the two charts. The confirmation timeframe is set using 'Pivot Lookback Right'. The lower the lookback the quicker the signal and the more likely it is to not have hit an actual peak, a higher lookback will give a much more dependable signal but the move may be finished by the time the alert actually fires. The "Plot When Alerts Fire" option should give you an idea (top and bottom triangles) of what to expect, but you should watch bar replays to understand how your setting will impact when alerts are created and potential false positives.

RSI Potential Divergence - FontiramisuIndicator showing potential momentum divergences on RSI Momentum.
The problem with the classic divergence is that when the signal appears, it is sometimes too late to enter a trade.
The potential divergence corrects this problem by signaling the beginning of a potential divergence.
RSI is a momentum indicator that offers relevant insights with divergences.
Potential divergences are indicated with the letter B and a red color for Bearish Div or Green color for Bullish Div .
Potential divergence is confirmed when the line and the label "Bear"' or "Bull" appear.
