ZenAlgo - BenderThis script combines several volume-based methodologies into a single chart overlay to help traders analyze market participation and volume distribution. It aggregates volume from multiple sources—spot and perpetual markets across different exchanges—and processes it to display various insights directly on the chart.
The script provides a detailed view of both individual-bar volume and broader aggregated trends. It calculates certain values, plots different shapes and overlays, and includes an optional informational table. However, it does not offer financial signals or predict future price movements. Instead, it presents multiple volume and range-related highlights for educational or analytical observations.
Below is a detailed breakdown of the core elements in this script:
Core Data Calculation and Aggregation
To build a comprehensive volume picture, the script retrieves volume data from multiple predefined exchanges for both Spot and Perpetual pairs. The volume for each bar is processed in Aggregated mode , meaning it combines data across selected sources to produce a single composite volume value.
The script applies average-based aggregation to calculate the final volume figures. The total volume is then used as the basis for further calculations, such as buy/sell volume decomposition and Delta analysis.
Buy/Sell Volume Decomposition
Each bar’s total volume is separated into an estimated buy portion and a sell portion. This decomposition uses logic that considers wick length, body size, and whether the bar closed higher or lower than it opened. The script assigns fractions of the total volume to the upper wick, lower wick, and body, then multiplies these by the total aggregated volume to estimate buy and sell volumes.
This breakdown is calculated separately for spot-only volume , perp-only volume , and their aggregated sums, allowing traders to analyze how much of each bar’s volume is estimated as "buy" or "sell."
Delta and Cumulative Delta
The script computes a Delta (buy volume minus sell volume) for each bar. A positive Delta suggests more buying during that bar, while a negative Delta suggests more selling.
It also computes Cumulative Delta , summing this Delta over 14 bars (a fixed period). This allows users to observe how short-term buy/sell imbalances accumulate over time.
Visual Bar Coloring (PVSRA Logic)
The script includes logic based on PVSRA (Price Volume Support Resistance Analysis) , which examines average volume over a recent lookback period to determine whether a bar meets certain "climax" or "above-average" thresholds.
Bars are categorized as:
Climax Up or Climax Down: If a bar meets strong volume and range conditions, it is identified as a high-activity bar.
Neutral Colors: Bars that do not meet the threshold are identified as standard volume bars.
Table Summaries
The script includes an optional Spot vs. Perpetual volume table that provides:
Aggregated Spot vs. Perpetual buy/sell volumes
The net difference between buying and selling
The total sum across all included sources
Percentage breakdown of buying vs. selling
A separate multi-timeframe table calculates volume-related metrics for fixed timeframes (15, 60, and 240 minutes), allowing traders to compare their current timeframe with broader trends.
Highlighted Shapes and Diamonds
The script places shape markers above or below bars when certain conditions are met, including:
Dots (circles): Representing a significant increase in net Delta compared to the previous bar.
Diamonds: Markers that appear when volume-based conditions align with predefined thresholds. These vary in size and include an optional "Hardcore Mode" , which applies stricter filtering.
Crossover Triangles: These appear when the internally computed Delta MA (a moving average of Delta) crosses above or below a predefined EMA.
These markers highlight notable changes in volume, Delta, or price action but do not constitute predictive trading signals.
Delta Averages and Overlaid EMAs
The script plots a histogram of the current net Delta (buy minus sell) . Additionally, a Delta Moving Average (Delta MA) is used for tracking trends. The Delta MA is plotted alongside predefined Exponential Moving Averages (EMAs) , such as:
A Delta MA calculated using an exponential moving average (EMA) over 21 bars.
A set of predefined EMAs (lengths such as 3, 5, 7, 10, 13, 16, 21, 25, etc.) plotted to visualize momentum changes.
Areas between these EMAs can be filled with translucent shading to highlight momentum shifts.
Comparing the Delta MA to the overlaid EMAs helps track changes in Delta momentum over time.
Interpreting the Elements
When using this script, consider the following:
Volume Aggregation: The script aggregates volume across multiple Spot and Perpetual sources to provide a broad market view.
Delta and Cumulative Delta: The Delta histogram may spike positively or negatively, highlighting areas of potential buying or selling pressure.
Table Data: If enabled, the tables display buy/sell volume splits for Spot and Perpetual markets, along with multi-timeframe comparisons.
EMA Overlays on Delta: The stacked EMAs help visualize short-term vs. longer-term Delta changes.
Shape Markers: Dots, diamonds, and triangles emphasize notable shifts in volume or Delta but do not imply recommendations for action.
Usage Tips
Toggle "Hardcore Mode" to apply stricter filtering to highlight conditions.
Enable or disable the Spot vs. Perpetual Table to see if the breakdown of volume sources is useful.
Use the multi-timeframe table to compare intraday data with broader trends.
If the chart appears too cluttered, toggle off features like PVSRA color tints or some EMAs to focus on specific elements.
Final Thoughts
This script integrates multiple volume-based calculations, range analysis, aggregated volume from predefined tickers, and various moving averages for Delta. Its visual layers—color-coded bars, histograms, shape markers, and tables—offer a rich perspective on market activity.
Users can analyze these elements across any timeframe or market combination they prefer. The script does not provide buy/sell signals or make predictions —it is purely an analytical tool for understanding volume-based market dynamics.
Traders should interpret these visual elements according to their own strategy and trading approach.
E-signal

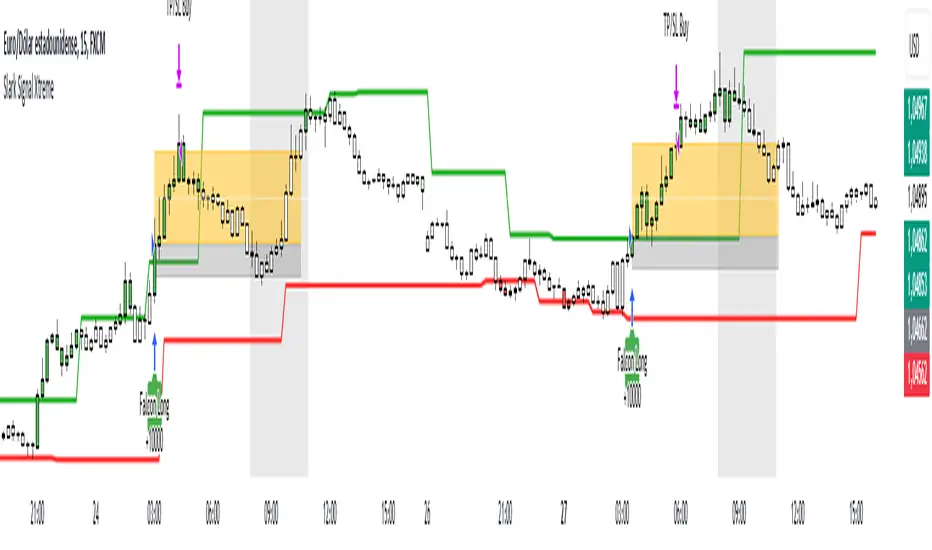
Slark Signal XtremeStrategy Description: Slark Signal Xtreme
The Slark Signal Xtreme is an innovative trading strategy designed to identify and capitalize on market opportunities by leveraging pivots, trend breakouts, and dynamic risk management. This strategy combines day-of-week and time filters with a ticks-based Stop Loss (SL) and Take Profit (TP) system, delivering customized signals and real-time alerts. Ideal for traders seeking a structured and highly customizable approach, Slark Signal Xtreme also incorporates advanced visual tools for efficient trade management.
Key Features:
Pivot- and Breakout-Based Signals: Utilizes pivot detection (highs/lows) combined with an ATR-based slope calculation to pinpoint trend changes and potential entry or exit points.
Dynamic Stop-Loss (SL) and Take-Profit (TP) Levels: Automatically calculates SL and TP based on the entry price and user-defined tick settings, adapting to volatility and optimizing risk management.
Time and Day Filters: Allows you to select specific days of the week and trading sessions during which signals are generated, avoiding low-liquidity periods or unwanted high volatility.
Customizable Risk Management: Lets you define the number of ticks for SL and TP, trading hours, initial capital, pyramiding, and commissions, tailoring the strategy to various risk profiles and assets.
Enhanced Visualization:
- SL and TP Boxes: Displays rectangular boxes on the chart indicating SL and TP levels, streamlining trade management.
- Candle Color Changes: Candles can be colored according to price position relative to pivot lines (bullish, bearish, or neutral).
- Session Highlight: Shades the chart background during the selected trading hours, providing immediate context on when the strategy is active.
Automated Alerts: Generates customizable alerts in TradingView whenever a buy or sell signal is triggered, detailing the timing, instrument, and SL/TP levels.
How the Strategy Works:
Technical Indicator Calculations:
- Pivot High/Low and Slope: Identifies price pivot points and calculates slope (based on ATR) to measure trend strength.
- Time and Day Filters: Signals only trigger within the specified days and hours, helping avoid undesirable market conditions.
Generating Buy and Sell Signals:
- Buy Signal (Long): Activated when price breaks above a downward pivot-based trendline or meets the condition for higher pivots.
- Sell Signal (Short): Activated when price breaks below an upward pivot-based trendline or meets the condition for lower pivots.
- Operation Conditions: Signals are only generated on selected days and during chosen trading hours, avoiding periods of low liquidity or excessive volatility.
Dynamic SL and TP Calculation:
- Stop-Loss (SL) and Take-Profit (TP): Determined by the entry price ± a user-defined number of ticks.
- SL and TP Visualization: Boxes are drawn on the chart from the entry price to SL/TP levels, enabling clear visual reference for trade management.
Order Execution and Alerts:
- Order Execution: When a signal is generated, Slark Signal Xtreme automatically opens a long or short position in TradingView’s backtesting environment.
- Alerts: Customizable alerts can be set up to provide real-time notifications (via TradingView or third-party integrations), offering essential details like instrument, time, SL/TP, etc.
Trade Management and Monitoring:
- Automatic Closure: Each trade is automatically closed upon reaching its SL or TP, ensuring disciplined risk control.
- Trade Summary: TradingView’s built-in reporting tools list all trades with cumulative results, simplifying performance evaluation.
Additional Visualization:
- Candle Coloring by Trend: Candles can be colored bullish, bearish, or neutral based on the pivot-driven trend detection.
- Operational Range Highlighting: The chart background is shaded during the permitted trading hours, clarifying when the strategy is active and enhancing visibility.
---
Strategy Properties (Important)
This backtest was conducted in TradingView under the following configuration:
Initial Capital: 1000 USD
Order Size: 10,000 contracts (adjust according to the traded asset)
Commission: 0.05 USD per order
Slippage: 1 tick
Pyramiding: 1 order
Price Verification for Limit Orders: 0 ticks
Recalculate on Every Tick & On Bar Close: Enabled
Bar Magnifier for Backtesting Precision: Enabled
These properties provide a realistic view of the strategy’s performance. However, default parameters may vary depending on each user or market:
Order Size: Should be calculated according to the asset traded and your desired risk level.
Commission and Slippage: Costs can vary by market and instrument; there is no universal default that guarantees realistic results.
All users are strongly recommended to adjust these properties within the script settings to match their own trading accounts and platforms, ensuring the most accurate backtest results.
---
Backtesting Results:
- Net Profit: +28.70
- Total Trades: 397
- Winning Trades: 138
- Win Rate: 34.76%
- Profit Factor: 1.07
- Sharpe Ratio: 1.25
- Sortino Ratio: 1.45
- Average Bars per Trade: 24
- Average Profit per Trade: 1.45
These numbers provide an overview of the strategy’s historical performance, demonstrating its potential for profitability given appropriate risk management.
---
Interpretation of Results:
- The strategy can be profitable despite a relatively modest win rate, thanks to a suitable risk-reward ratio.
- A profit factor of 1.07 indicates that total profits slightly exceed total losses.
- It is essential to monitor drawdown and ensure it aligns with your personal risk tolerance.
---
Risk Warning:
Trading leveraged financial instruments carries a high level of risk and may not be suitable for all investors. Before trading, carefully consider your investment objectives, experience level, and risk tolerance. Past performance does not guarantee future results. Always perform additional testing and adjust the strategy to your specific needs.
---
What Makes This Strategy Original?
Focus on Pivots and Time/Day Filters: Rather than purely relying on momentum indicators, Slark Signal Xtreme uses pivot-based signals and scheduling filters to capture higher-liquidity, directional market moves.
Dynamic Risk Management: Ticks-based SL/TP and customizable trading sessions enable precise adaptation to various markets and trading styles.
Advanced Visualization Tools: SL/TP boxes, candle coloring, and session highlights streamline market interpretation and facilitate real-time decision-making.
Seamless Alert Integration: Although native TradingView alerts are provided, it can be integrated with third-party messaging services (Telegram, Discord, etc.) for enhanced automation.
---
Additional Considerations
Continuous Testing and Optimization: Regularly backtest and fine-tune parameters (SL, TP, time filters, etc.) to accommodate changing market conditions.
Complementary Analysis: Combine this strategy with other technical or fundamental tools to confirm signals.
Rigorous Risk Management: Ensure SL/TP levels and position sizes conform to your overall risk management plan.
Updates and Support: Future updates and improvements may be released based on community feedback. For questions or suggestions, feel free to reach out.
---
Example Configuration
Assume you want to run Slark Signal Xtreme with these settings:
Trading Days: Monday to Friday
Trading Hours: 8:00 to 11:00 (exchange or broker time)
Stop Loss (SL) in Ticks: 100
Take Profit (TP) in Ticks: 300
SL/TP Box Extension: 20 bars
Initial Capital: 1000 USD
Risk per Trade: 1% of capital
Commissions & Slippage: 0.05 USD commission, 1 tick slippage
---
Conclusion
The Slark Signal Xtreme strategy delivers a robust and adaptable solution by merging pivots, time/day filters, flexible risk parameters, and advanced visualization. Its distinctive and customizable design makes it a powerful resource for traders aiming to diversify their methods and exploit trend breakouts under specific conditions. Fully compatible with TradingView, Slark Signal Xtreme can enhance your trading toolkit and foster a more systematic approach to your operations.
---
Final Disclaimer:
Financial markets are inherently volatile and pose significant risks. This strategy should be employed as part of a comprehensive trading plan and does not guarantee positive outcomes. Always consult a qualified financial advisor before making investment decisions. The use of Slark Signal Xtreme is solely at the user’s discretion, who must evaluate personal risk tolerance and financial objectives.
Cumulative Price Change AlertCumulative Price Change Alert
Version: 1.0
Author: QCodeTrader 🚀
Overview 🔍
The Cumulative Price Change Alert indicator analyzes the percentage change between the current and previous open prices and sums these changes over a user-defined number of bars. It then generates visual buy and sell signals using arrows and labels on the chart, helping traders spot cumulative price momentum and potential trading opportunities.
Key Features ⚙️
Customizable Timeframe 🕒:
Use a custom timeframe or default to the chart's timeframe for price data.
User-Defined Summation 🔢:
Specify the number of bars to sum, allowing you to analyze cumulative price changes.
Custom Buy & Sell Conditions 🔔:
Set individual percentage change thresholds and cumulative sum thresholds to tailor signals for
your strategy.
Visual Alerts 🚀:
Displays green upward arrows for buy signals and red downward arrows for sell signals directly
on the chart.
Informative Labels 📝:
Provides labels with formatted percentage change and cumulative sum details for the analyzed
bars.
Versatile Application 📊:
Suitable for stocks, forex, crypto, commodities, and more.
How It Works ⚡
Price Change Calculation ➗:
The indicator calculates the percentage change between the current bar's open price and the
previous bar's open price.
Cumulative Sum ➕:
It then sums these percentage changes over the last N bars (as specified by the user).
Signal Generation 🚦:
Buy Signal 🟢: When both the individual percentage change and the cumulative sum exceed
their respective buy thresholds, a green arrow and label are displayed.
Sell Signal 🔴: Conversely, if the individual change and cumulative sum fall below the sell
thresholds, a red arrow and label are shown.
How to Use 💡
Add the Indicator ➕:
Apply the indicator to your chart.
Customize Settings ⚙️:
Set a custom timeframe if desired.
Define the number of bars to sum.
Adjust the buy/sell percentage change and cumulative sum thresholds to match your trading
strategy.
Interpret Visual Cues 👀:
Monitor the chart for green or red arrows and corresponding labels that signal potential buy or
sell opportunities based on cumulative price movements.
Settings Explained 🛠️
Custom Timeframe:
Select an alternative timeframe for analysis, or leave empty to use the current chart's timeframe.
Number of Last Bars to Sum:
Determines how many bars are used to compute the cumulative percentage change.
Buy Condition - Min % Change:
The minimum individual percentage change required to consider a buy signal.
Buy Condition - Min Sum of Bars:
The minimum cumulative percentage change over the defined bars needed for a buy signal.
Sell Condition - Max % Change:
The maximum individual percentage change threshold for a sell signal.
Sell Condition - Max Sum of Bars:
The maximum cumulative percentage change over the defined bars for triggering a sell signal.
Best Use Cases 🎯
Momentum Identification 📈:
Quickly spot strong cumulative price movements and momentum shifts.
Entry/Exit Signals 🚪:
Use the visual signals to determine potential entry and exit points in your trading.
Versatile Strategy Application 🔄:
Effective for scalping, swing trading, and longer-term analysis across various markets.
UPD: uncheck labels for better performance

Multi-Indicator Signals with Selectable Options by DiGetMulti-Indicator Signals with Selectable Options
Script Overview
This Pine Script is a multi-indicator trading strategy designed to generate buy/sell signals based on combinations of popular technical indicators: RSI (Relative Strength Index) , CCI (Commodity Channel Index) , and Stochastic Oscillator . The script allows you to select which combination of signals to display, making it highly customizable and adaptable to different trading styles.
The primary goal of this script is to provide clear and actionable entry/exit points by visualizing buy/sell signals with arrows , labels , and vertical lines directly on the chart. It also includes input validation, dynamic signal plotting, and clutter-free line management to ensure a clean and professional user experience.
Key Features
1. Customizable Signal Types
You can choose from five signal types:
RSI & CCI : Combines RSI and CCI signals for confirmation.
RSI & Stochastic : Combines RSI and Stochastic signals.
CCI & Stochastic : Combines CCI and Stochastic signals.
RSI & CCI & Stochastic : Requires all three indicators to align for a signal.
All Signals : Displays individual signals from each indicator separately.
This flexibility allows you to test and use the combination that works best for your trading strategy.
2. Clear Buy/Sell Indicators
Arrows : Buy signals are marked with upward arrows (green/lime/yellow) below the candles, while sell signals are marked with downward arrows (red/fuchsia/gray) above the candles.
Labels : Each signal is accompanied by a label ("BUY" or "SELL") near the arrow for clarity.
Vertical Lines : A vertical line is drawn at the exact bar where the signal occurs, extending from the low to the high of the candle. This ensures you can pinpoint the exact entry point without ambiguity.
3. Dynamic Overbought/Oversold Levels
You can customize the overbought and oversold levels for each indicator:
RSI: Default values are 70 (overbought) and 30 (oversold).
CCI: Default values are +100 (overbought) and -100 (oversold).
Stochastic: Default values are 80 (overbought) and 20 (oversold).
These levels can be adjusted to suit your trading preferences or market conditions.
4. Input Validation
The script includes built-in validation to ensure that oversold levels are always lower than overbought levels for each indicator. If the inputs are invalid, an error message will appear, preventing incorrect configurations.
5. Clean Chart Design
To avoid clutter, the script dynamically manages vertical lines:
Only the most recent 50 buy/sell lines are displayed. Older lines are automatically deleted to keep the chart clean.
Labels and arrows are placed strategically to avoid overlapping with candles.
6. ATR-Based Offset
The vertical lines and labels are offset using the Average True Range (ATR) to ensure they don’t overlap with the price action. This makes the signals easier to see, especially during volatile market conditions.
7. Scalable and Professional
The script uses arrays to manage multiple vertical lines, ensuring scalability and performance even when many signals are generated.
It adheres to Pine Script v6 standards, ensuring compatibility and reliability.
How It Works
Indicator Calculations :
The script calculates the values of RSI, CCI, and Stochastic Oscillator based on user-defined lengths and smoothing parameters.
It then checks for crossover/crossunder conditions relative to the overbought/oversold levels to generate individual signals.
Combined Signals :
Depending on the selected signal type, the script combines the individual signals logically:
For example, a "RSI & CCI" buy signal requires both RSI and CCI to cross into their respective oversold zones simultaneously.
Signal Plotting :
When a signal is generated, the script:
Plots an arrow (upward for buy, downward for sell) at the corresponding bar.
Adds a label ("BUY" or "SELL") near the arrow for clarity.
Draws a vertical line extending from the low to the high of the candle to mark the exact entry point.
Line Management :
To prevent clutter, the script stores up to 50 vertical lines in arrays (buy_lines and sell_lines). Older lines are automatically deleted when the limit is exceeded.
Why Use This Script?
Versatility : Whether you're a scalper, swing trader, or long-term investor, this script can be tailored to your needs by selecting the appropriate signal type and adjusting the indicator parameters.
Clarity : The combination of arrows, labels, and vertical lines ensures that signals are easy to spot and interpret, even in fast-moving markets.
Customization : With adjustable overbought/oversold levels and multiple signal options, you can fine-tune the script to match your trading strategy.
Professional Design : The script avoids clutter by limiting the number of lines displayed and using ATR-based offsets for better visibility.
How to Use This Script
Add the Script to Your Chart :
Copy and paste the script into the Pine Editor in TradingView.
Save and add it to your chart.
Select Signal Type :
Use the "Signal Type" dropdown menu to choose the combination of indicators you want to use.
Adjust Parameters :
Customize the lengths of RSI, CCI, and Stochastic, as well as their overbought/oversold levels, to match your trading preferences.
Interpret Signals :
Look for green arrows and "BUY" labels for buy signals, and red arrows and "SELL" labels for sell signals.
Vertical lines will help you identify the exact bar where the signal occurred.
Tips for Traders
Backtest Thoroughly : Before using this script in live trading, backtest it on historical data to ensure it aligns with your strategy.
Combine with Other Tools : While this script provides reliable signals, consider combining it with other tools like support/resistance levels or volume analysis for additional confirmation.
Avoid Overloading the Chart : If you notice too many signals, try tightening the overbought/oversold levels or switching to a combined signal type (e.g., "RSI & CCI & Stochastic") for fewer but higher-confidence signals.

Range Filtered Trend Signals [AlgoAlpha]Introducing the Range Filtered Trend Signals , a cutting-edge trading indicator designed to detect market trends and ranging conditions with high accuracy. This indicator leverages a combination of Kalman filtering and Supertrend analysis to smooth out price fluctuations while maintaining responsiveness to trend shifts. By incorporating volatility-based range filtering, it ensures traders can differentiate between trending and ranging conditions effectively, reducing false signals and enhancing trade decision-making.
:key: Key Features
:white_check_mark: Kalman Filter Smoothing – Minimizes market noise while preserving trend clarity.
:bar_chart: Supertrend Integration – A dynamic trend-following mechanism for spotting reversals.
:fire: Volatility-Based Range Detection – Detects trending vs. ranging conditions with precision.
:art: Color-Coded Trend Signals – Instantly recognize bullish, bearish, and ranging market states.
:gear: Customizable Inputs – Fine-tune Kalman parameters, Supertrend settings, and color themes to match your strategy.
:bell: Alerts for Trend Shifts – Get real-time notifications when market conditions change!
:tools: How to Use
Add the Indicator – Click the star icon to add it to your TradingView favorites.
Analyze Market Conditions – Observe the color-coded signals and range boundaries to identify trend strength and direction.
Use Alerts for Trade Execution – Set alerts for trend shifts and market conditions to stay ahead without constantly monitoring charts.
:mag: How It Works
The Kalman filter smooths price fluctuations by dynamically adjusting its weighting based on market volatility. It helps remove noise while keeping the signal reactive to trend changes. The Supertrend calculation is then applied to the filtered price data, providing a robust trend-following mechanism. To enhance signal accuracy, a volatility-weighted range filter is incorporated, creating upper and lower boundaries that define trend conditions. When price breaks out of these boundaries, the indicator confirms trend continuation, while signals within the range indicate market consolidation. Traders can leverage this tool to enhance trade timing, filter false breakouts, and identify optimal entry/exit zones.

Volatility Momentum Breakout StrategyDescription:
Overview:
The Volatility Momentum Breakout Strategy is designed to capture significant price moves by combining a volatility breakout approach with trend and momentum filters. This strategy dynamically calculates breakout levels based on market volatility and uses these levels along with trend and momentum conditions to identify trade opportunities.
How It Works:
1. Volatility Breakout:
• Methodology:
The strategy computes the highest high and lowest low over a defined lookback period (excluding the current bar to avoid look-ahead bias). A multiple of the Average True Range (ATR) is then added to (or subtracted from) these levels to form dynamic breakout thresholds.
• Purpose:
This method helps capture significant price movements (breakouts) while ensuring that only past data is used, thereby maintaining realistic signal generation.
2. Trend Filtering:
• Methodology:
A short-term Exponential Moving Average (EMA) is applied to determine the prevailing trend.
• Purpose:
Long trades are considered only when the current price is above the EMA, indicating an uptrend, while short trades are taken only when the price is below the EMA, indicating a downtrend.
3. Momentum Confirmation:
• Methodology:
The Relative Strength Index (RSI) is used to gauge market momentum.
• Purpose:
For long entries, the RSI must be above a mid-level (e.g., above 50) to confirm upward momentum, and for short entries, it must be below a similar threshold. This helps filter out signals during overextended conditions.
Entry Conditions:
• Long Entry:
A long position is triggered when the current closing price exceeds the calculated long breakout level, the price is above the short-term EMA, and the RSI confirms momentum (e.g., above 50).
• Short Entry:
A short position is triggered when the closing price falls below the calculated short breakout level, the price is below the EMA, and the RSI confirms momentum (e.g., below 50).
Risk Management:
• Position Sizing:
Trades are sized to risk a fixed percentage of account equity (set here to 5% per trade in the code, with each trade’s stop loss defined so that risk is limited to approximately 2% of the entry price).
• Stop Loss & Take Profit:
A stop loss is placed a fixed ATR multiple away from the entry price, and a take profit target is set to achieve a 1:2 risk-reward ratio.
• Realistic Backtesting:
The strategy is backtested using an initial capital of $10,000, with a commission of 0.1% per trade and slippage of 1 tick per bar—parameters chosen to reflect conditions faced by the average trader.
Important Disclaimers:
• No Look-Ahead Bias:
All breakout levels are calculated using only past data (excluding the current bar) to ensure that the strategy does not “peek” into future data.
• Educational Purpose:
This strategy is experimental and provided solely for educational purposes. Past performance is not indicative of future results.
• User Responsibility:
Traders should thoroughly backtest and paper trade the strategy under various market conditions and adjust parameters to fit their own risk tolerance and trading style before live deployment.
Conclusion:
By integrating volatility-based breakout signals with trend and momentum filters, the Volatility Momentum Breakout Strategy offers a unique method to capture significant price moves in a disciplined manner. This publication provides a transparent explanation of the strategy’s components and realistic backtesting parameters, making it a useful tool for educational purposes and further customization by the TradingView community.

Ultimate Stochastics Strategy by NHBprod Use to Day Trade BTCHey All!
Here's a new script I worked on that's super simple but at the same time useful. Check out the backtest results. The backtest results include slippage and fees/commission, and is still quite profitable. Obviously the profitability magnitude depends on how much capital you begin with, and how much the user utilizes per order, but in any event it seems to be profitable according to backtests.
This is different because it allows you full functionality over the stochastics calculations which is designed for random datasets. This script allows you to:
Designate ANY period of time to analyze and study
Choose between Long trading, short trading, and Long & Short trading
It allows you to enter trades based on the stochastics calculations
It allows you to EXIT trades using the stochastics calculations or take profit, or stop loss, Or any combination of those, which is nice because then the user can see how one variable effects the overall performance.
As for the actual stochastics formula, you get control, and get to SEE the plot lines for slow K, slow D, and fast K, which is usually not considered.
You also get the chance to modify the smoothing method, which has not been done with regular stochastics indicators. You get to choose the standard simple moving average (SMA) method, but I also allow you to choose other MA's such as the HMA and WMA.
Lastly, the user gets the option of using a custom trade extender, which essentially allows a buy or sell signal to exist for X amount of candles after the initial signal. For example, you can use "max bars since signal" to 1, and this will allow the indicator to produce an extra sequential buy signal when a buy signal is generated. This can be useful because it is possible that you use a small take profit (TP) and quickly exit a profitable trade. With the max bars since signal variable, you're able to reenter on the next candle and allow for another opportunity.
Let me know if you have any questions! Please take a look at the performance report and let me know your thoughts! :)

[COG] Advanced School Run StrategyAdvanced School Run Strategy (ASRS) – Explanation
Overview: The Advanced School Run Strategy (ASRS) is an intraday trading approach designed to identify breakout opportunities based on specific time and price patterns. This script applies the concepts of the Advanced School Run Strategy as outlined in Tom Hougaard's research, adapted to work seamlessly on TradingView charts. It leverages 5-minute candlestick data to set actionable breakout levels and provides traders with visual cues and alerts to make informed decisions.
Features:
Dynamic Breakout Levels: Automatically calculates high and low levels based on the market's behavior during the initial trading minutes.
Custom Visualization: Highlights breakout zones with customizable colors and transparency, providing clear visual feedback for bullish and bearish breakouts.
Configurable Alerts: Includes alert conditions for both bullish and bearish breakouts, ensuring traders never miss a trading opportunity.
Reset Logic: Resets breakout levels daily at the market open to ensure accurate signal generation for each session.
How It Works:
The script identifies key levels (high and low) after a configurable number of minutes from the market open (default: 25 minutes).
If the price breaks above the high level or below the low level, a corresponding breakout is detected.
The script draws breakout zones on the chart and triggers alerts based on the breakout direction.
All levels and signals reset at the start of each new trading session, maintaining relevance to current market conditions.
Customization Options:
Line and box colors for bullish and bearish breakouts.
Transparency levels for breakout visualizations.
Alert settings to receive notifications for detected breakouts.
Acknowledgment: This script is inspired by Tom Hougaard's Advanced School Run Strategy. The methodology has been translated into Pine Script for TradingView users, adhering to TradingView’s policies and community guidelines. This script does not redistribute proprietary content from the original research but implements the principles for educational and analytical purposes.

RSI OB/OS Strategy Analyzer█ OVERVIEW
The RSI OB/OS Strategy Analyzer is a comprehensive trading tool designed to help traders identify and evaluate overbought/oversold reversal opportunities using the Relative Strength Index (RSI). It provides visual signals, performance metrics, and a detailed table to analyze the effectiveness of RSI-based strategies over a user-defined lookback period.
█ KEY FEATURES
RSI Calculation
Calculates RSI with customizable period (default 14)
Plots dynamic overbought (70) and oversold (30) levels
Adds background coloring for OB/OS regions
Reversal Signals
Identifies signals based on RSI crossing OB/OS levels
Two entry strategies available:
Revert Cross: Triggers when RSI exits OB/OS zone
Cross Threshold: Triggers when RSI enters OB/OS zone
Trade Direction
Users can select a trade bias:
Long: Focuses on oversold reversals (bullish signals)
Short: Focuses on overbought reversals (bearish signals)
Performance Metrics
Calculates three key statistics for each lookback period:
Win Rate: Percentage of profitable trades
Mean Return: Average return across all trades
Median Return: Median return across all trades
Metrics calculated as percentage changes from entry price
Visual Signals
Dual-layer signal display:
BUY: Green triangles + text labels below price
SELL: Red triangles + text labels above price
Semi-transparent background highlighting in OB/OS zones
Performance Table
Interactive table showing metrics for each lookback period
Color-coded visualization:
Win Rate: Gradient from red (low) to green (high)
Returns: Green for positive, red for negative
Time Filtering
Users can define a specific time window for the indicator to analyze trades, ensuring that performance metrics are calculated only for the desired period.
Customizable Display
Adjustable table font sizes: Auto/Small/Normal/Large
Toggle option for table visibility
█ PURPOSE
The RSI OB/OS Strategy Analyzer helps traders:
Identify mean-reversion opportunities through RSI extremes
Backtest entry strategy effectiveness across multiple time horizons
Optimize trade timing through visual historical performance data
Quickly assess strategy robustness with color-coded metrics
█ IDEAL USERS
Counter-Trend Traders: Looking to capitalize on RSI extremes
Systematic Traders: Needing quantitative strategy validation
Educational Users: Studying RSI behavior in different market conditions
Multi-Timeframe Analysts: Interested in forward returns analysis

Bollinger Bands Reversal Strategy Analyzer█ OVERVIEW
The Bollinger Bands Reversal Overlay is a versatile trading tool designed to help traders identify potential reversal opportunities using Bollinger Bands. It provides visual signals, performance metrics, and a detailed table to analyze the effectiveness of reversal-based strategies over a user-defined lookback period.
█ KEY FEATURES
Bollinger Bands Calculation
The indicator calculates the standard Bollinger Bands, consisting of:
A middle band (basis) as the Simple Moving Average (SMA) of the closing price.
An upper band as the basis plus a multiple of the standard deviation.
A lower band as the basis minus a multiple of the standard deviation.
Users can customize the length of the Bollinger Bands and the multiplier for the standard deviation.
Reversal Signals
The indicator identifies potential reversal signals based on the interaction between the price and the Bollinger Bands.
Two entry strategies are available:
Revert Cross: Waits for the price to close back above the lower band (for longs) or below the upper band (for shorts) after crossing it.
Cross Threshold: Triggers a signal as soon as the price crosses the lower band (for longs) or the upper band (for shorts).
Trade Direction
Users can select a trade bias:
Long: Focuses on bullish reversal signals.
Short: Focuses on bearish reversal signals.
Performance Metrics
The indicator calculates and displays the performance of trades over a user-defined lookback period ( barLookback ).
Metrics include:
Win Rate: The percentage of trades that were profitable.
Mean Return: The average return across all trades.
Median Return: The median return across all trades.
These metrics are calculated for each bar in the lookback period, providing insights into the strategy's performance over time.
Visual Signals
The indicator plots buy and sell signals on the chart:
Buy Signals: Displayed as green triangles below the price bars.
Sell Signals: Displayed as red triangles above the price bars.
Performance Table
A customizable table is displayed on the chart, showing the performance metrics for each bar in the lookback period.
The table includes:
Win Rate: Highlighted with gradient colors (green for high win rates, red for low win rates).
Mean Return: Colored based on profitability (green for positive returns, red for negative returns).
Median Return: Colored similarly to the mean return.
Time Filtering
Users can define a specific time window for the indicator to analyze trades, ensuring that performance metrics are calculated only for the desired period.
Customizable Display
The table's font size can be adjusted to suit the user's preference, with options for "Auto," "Small," "Normal," and "Large."
█ PURPOSE
The Bollinger Bands Reversal Overlay is designed to:
Help traders identify high-probability reversal opportunities using Bollinger Bands.
Provide actionable insights into the performance of reversal-based strategies.
Enable users to backtest and optimize their trading strategies by analyzing historical performance metrics.
█ IDEAL USERS
Swing Traders: Looking for reversal opportunities within a trend.
Mean Reversion Traders: Interested in trading price reversals to the mean.
Strategy Developers: Seeking to backtest and refine Bollinger Bands-based strategies.
Performance Analysts: Wanting to evaluate the effectiveness of reversal signals over time.

Normalized Price ComparisonNormalized Price Comparison Indicator Description
The "Normalized Price Comparison" indicator is designed to provide traders with a visual tool for comparing the price movements of up to three different financial instruments on a common scale, despite their potentially different price ranges. Here's how it works:
Features:
Normalization: This indicator normalizes the closing prices of each symbol to a scale between 0 and 1 over a user-defined period. This normalization process allows for the comparison of price trends regardless of the absolute price levels, making it easier to spot relative movements and trends.
Crossing Alert: It features an alert functionality that triggers when the normalized price lines of the first two symbols (Symbol 1 and Symbol 2) cross each other. This can be particularly useful for identifying potential trading opportunities when one asset's relative performance changes against another.
Customization: Users can input up to three symbols for analysis. The normalization period can be adjusted, allowing flexibility in how historical data is considered for the scaling process. This period determines how many past bars are used to calculate the minimum and maximum prices for normalization.
Visual Representation: The indicator plots these normalized prices in a separate pane below the main chart. Each symbol's normalized price is represented by a distinct colored line:
Symbol 1: Blue line
Symbol 2: Red line
Symbol 3: Green line
Use Cases:
Relative Performance Analysis: Ideal for investors or traders who want to compare how different assets are performing relative to each other over time, without the distraction of absolute price differences.
Divergence Detection: Useful for spotting divergences where one asset might be outperforming or underperforming compared to others, potentially signaling changes in market trends or investment opportunities.
Crossing Strategy: The alert for when Symbol 1 and Symbol 2's normalized lines cross can be used as a part of a trading strategy, signaling potential entry or exit points based on relative price movements.
Limitations:
Static Alert Messages: Due to Pine Script's constraints, the alert messages cannot dynamically include the names of the symbols being compared. The alert will always mention "Symbol 1" and "Symbol 2" crossing.
Performance: Depending on the timeframe and the number of symbols, performance might be affected, especially on lower timeframes with high data frequency.
This indicator is particularly beneficial for those interested in multi-asset analysis, offering a streamlined way to observe and react to relative price movements in a visually coherent manner. It's a powerful tool for enhancing your trading or investment analysis by focusing on trends and relationships rather than raw price data.

Phase Cross Strategy with Zone### Introduction to the Strategy
Welcome to the **Phase Cross Strategy with Zone and EMA Analysis**. This strategy is designed to help traders identify potential buy and sell opportunities based on the crossover of smoothed oscillators (referred to as "phases") and exponential moving averages (EMAs). By combining these two methods, the strategy offers a versatile tool for both trend-following and short-term trading setups.
### Key Features
1. **Phase Cross Signals**:
- The strategy uses two smoothed oscillators:
- **Leading Phase**: A simple moving average (SMA) with an upward offset.
- **Lagging Phase**: An exponential moving average (EMA) with a downward offset.
- Buy and sell signals are generated when these phases cross over or under each other, visually represented on the chart with green (buy) and red (sell) labels.
2. **Phase Zone Visualization**:
- The area between the two phases is filled with a green or red zone, indicating bullish or bearish conditions:
- Green zone: Leading phase is above the lagging phase (potential uptrend).
- Red zone: Leading phase is below the lagging phase (potential downtrend).
3. **EMA Analysis**:
- Includes five commonly used EMAs (13, 26, 50, 100, and 200) for additional trend analysis.
- Crossovers of the EMA 13 and EMA 26 act as secondary buy/sell signals to confirm or enhance the phase-based signals.
4. **Customizable Parameters**:
- You can adjust the smoothing length, source (price data), and offset to fine-tune the strategy for your preferred trading style.
### What to Pay Attention To
1. **Phases and Zones**:
- Use the green/red phase zone as an overall trend guide.
- Avoid taking trades when the phases are too close or choppy, as it may indicate a ranging market.
2. **EMA Trends**:
- Align your trades with the longer-term trend shown by the EMAs. For example:
- In an uptrend (price above EMA 50 or EMA 200), prioritize buy signals.
- In a downtrend (price below EMA 50 or EMA 200), prioritize sell signals.
3. **Signal Confirmation**:
- Consider combining phase cross signals with EMA crossovers for higher-confidence trades.
- Look for confluence between the phase signals and EMA trends.
4. **Risk Management**:
- Always set stop-loss and take-profit levels to manage risk.
- Use the phase and EMA zones to estimate potential support/resistance areas for exits.
5. **Whipsaws and False Signals**:
- Be cautious in low-volatility or sideways markets, as the strategy may generate false signals.
- Use additional indicators or filters to avoid entering trades during unclear market conditions.
### How to Use
1. Add the strategy to your chart in TradingView.
2. Adjust the input settings (e.g., smoothing length, offsets) to suit your trading preferences.
3. Enable the strategy tester to evaluate its performance on historical data.
4. Combine the signals with your own analysis and risk management plan for best results.
This strategy is a versatile tool, but like any trading method, it requires proper understanding and discretion. Always backtest thoroughly and trade with discipline. Let me know if you need further assistance or adjustments to the strategy!

Trend Trader-Remastered StrategyOfficial Strategy for Trend Trader - Remastered
Indicator: Trend Trader-Remastered (TTR)
Overview:
The Trend Trader-Remastered is a refined and highly sophisticated implementation of the Parabolic SAR designed to create strategic buy and sell entry signals, alongside precision take profit and re-entry signals based on marked Bill Williams (BW) fractals. Built with a deep emphasis on clarity and accuracy, this indicator ensures that only relevant and meaningful signals are generated, eliminating any unnecessary entries or exits.
Please check the indicator details and updates via the link above.
Important Disclosure:
My primary objective is to provide realistic strategies and a code base for the TradingView Community. Therefore, the default settings of the strategy version of the indicator have been set to reflect realistic world trading scenarios and best practices.
Key Features:
Strategy execution date&time range.
Take Profit Reduction Rate: The percentage of progressive reduction on active position size for take profit signals.
Example:
TP Reduce: 10%
Entry Position Size: 100
TP1: 100 - 10 = 90
TP2: 90 - 9 = 81
Re-Entry When Rate: The percentage of position size on initial entry of the signal to determine re-entry.
Example:
RE When: 50%
Entry Position Size: 100
Re-Entry Condition: Active Position Size < 50
Re-Entry Fill Rate: The percentage of position size on initial entry of the signal to be completed.
Example:
RE Fill: 75%
Entry Position Size: 100
Active Position Size: 50
Re-Entry Order Size: 25
Final Active Position Size:75
Important: Even RE When condition is met, the active position size required to drop below RE Fill rate to trigger re-entry order.
Key Points:
'Process Orders on Close' is enabled as Take Profit and Re-Entry signals must be executed on candle close.
'Calculate on Every Tick' is enabled as entry signals are required to be executed within candle time.
'Initial Capital' has been set to 10,000 USD.
'Default Quantity Type' has been set to 'Percent of Equity'.
'Default Quantity' has been set to 10% as the best practice of investing 10% of the assets.
'Currency' has been set to USD.
'Commission Type' has been set to 'Commission Percent'
'Commission Value' has been set to 0.05% to reflect the most realistic results with a common taker fee value.

Alternate Bat Harmonic Pattern [TradingFinder] ALT Bat Indicator🔵 Introduction
The Alternate Bat harmonic pattern is one of the most precise and practical tools in technical analysis, introduced by Scott Carney in 2003. This pattern focuses on specific Fibonacci ratios, such as 0.382 at point B and 1.13XA at point D, to identify Potential Reversal Zones (PRZ) where price is likely to reverse.
The Alternative Bat pattern emerged as a result of repeated failures observed in the standard Bat pattern. Traders entering trades near the 0.886XA level of the standard Bat often encountered losses. In the Alternate Bat, point D extends beyond 0.886XA, typically reversing at 1.13XA, offering a more accurate identification of the reversal zone.
A key characteristic of this pattern is its M- or W-shaped structure, where the midpoint B retraces 0.382XA or less. Additionally, the CD leg requires an extension of 2.0 to 3.618 to complete the pattern. Due to its accuracy and the predictable behavior of price near the PRZ, the Alternate Bat pattern is recognized as a powerful tool for forecasting price reversals.
In the bullish Alternative Bat pattern, an M-shaped structure forms. After an initial upward movement (XA), price undergoes a short correction at point B (0.382XA) and then declines toward point D (1.13XA and an extension of 2.0 to 3.618BC), where a potential upward reversal is expected.
In the bearish Alternate Bat pattern, a W-shaped structure forms. After an initial downward movement (XA), price retraces slightly at point B (0.382XA) and then rises toward point D (1.13XA and an extension of 2.0 to 3.618BC), where a potential downward reversal is anticipated.
🔵 How to Use
The Alternate Bat harmonic pattern is a key tool for identifying potential reversal zones (PRZ) in the market. By leveraging the 0.382 retracement at point B and the 1.13XA extension at point D, along with symmetrical price structures, this pattern offers precise reversal opportunities in both bullish and bearish market conditions.
🟣 Bullish Alternate Bat Pattern
The bullish Alternate Bat pattern forms during a downtrend, signaling a potential reversal to the upside. This pattern consists of three downward movements with two corrective waves, ultimately reaching point D, which marks the PRZ.
At the PRZ, the convergence of Fibonacci levels—1.13XA and extensions ranging from 2.0 to 3.618BC—creates a strong support zone where price is likely to reverse upward.
🟣 Bearish Alternative Bat Pattern
The bearish Alternate Bat pattern develops during an uptrend, indicating a potential reversal to the downside. This pattern features three upward price movements with two retracements, ending at point D, where the PRZ forms.
Point D is defined by the 1.13XA extension and the 2.0 to 3.618BC projection, creating a strong resistance zone where price is expected to reverse downward.
🔵 Setting
🟣 Logical Setting
ZigZag Pivot Period : You can adjust the period so that the harmonic patterns are adjusted according to the pivot period you want. This factor is the most important parameter in pattern recognition.
Show Valid Format : If this parameter is on "On" mode, only patterns will be displayed that they have exact format and no noise can be seen in them. If "Off" is, the patterns displayed that maybe are noisy and do not exactly correspond to the original pattern.
Show Formation Last Pivot Confirm : if Turned on, you can see this ability of patterns when their last pivot is formed. If this feature is off, it will see the patterns as soon as they are formed. The advantage of this option being clear is less formation of fielded patterns, and it is accompanied by the latest pattern seeing and a sharp reduction in reward to risk.
Period of Formation Last Pivot : Using this parameter you can determine that the last pivot is based on Pivot period.
🟣 Genaral Setting
Show : Enter "On" to display the template and "Off" to not display the template.
Color : Enter the desired color to draw the pattern in this parameter.
LineWidth : You can enter the number 1 or numbers higher than one to adjust the thickness of the drawing lines. This number must be an integer and increases with increasing thickness.
LabelSize : You can adjust the size of the labels by using the "size.auto", "size.tiny", "size.smal", "size.normal", "size.large" or "size.huge" entries.
🟣 Alert Setting
Alert : On / Off
Message Frequency : This string parameter defines the announcement frequency. Choices include: "All" (activates the alert every time the function is called), "Once Per Bar" (activates the alert only on the first call within the bar), and "Once Per Bar Close" (the alert is activated only by a call at the last script execution of the real-time bar upon closing). The default setting is "Once per Bar".
Show Alert Time by Time Zone : The date, hour, and minute you receive in alert messages can be based on any time zone you choose. For example, if you want New York time, you should enter "UTC-4". This input is set to the time zone "UTC" by default.
🔵 Conclusion
The Alternate Bat harmonic pattern, with its precise Fibonacci ratios like 0.382 and 1.13XA, is a reliable tool for identifying Potential Reversal Zones (PRZ) in financial markets. By recognizing symmetrical price structures and focusing on both bullish and bearish scenarios, traders can identify optimal entry and exit points with high accuracy.
The key strength of this pattern lies in its ability to define strong support and resistance zones near the PRZ, increasing the probability of price reversals. Combining the pattern with candlestick confirmations and volume analysis enhances its effectiveness.
Ultimately, incorporating the Alternative Bat pattern with proper risk management and Fibonacci-based targets allows traders to enter the market confidently and capitalize on potential price reversals.

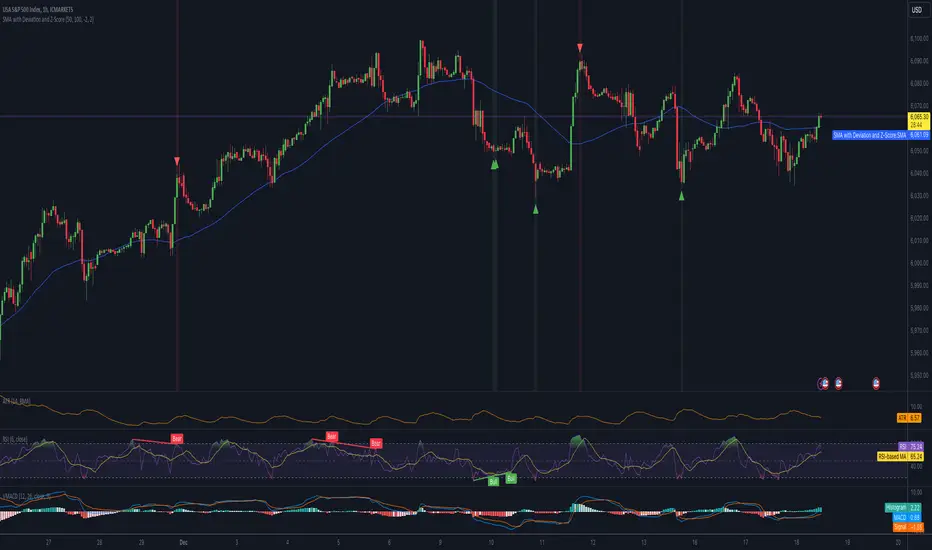
Mean Reversion IndicatorSMA with Deviation and Z-Score Indicator
Overview:
This indicator combines the Simple Moving Average (SMA) with statistical measures of price deviation to identify potential buy and sell signals based on mean reversion principles. It calculates the Z-Score, which quantifies how far the current price is from its moving average in terms of standard deviations, helping traders spot when an asset might be overbought or oversold.
Key Features:
SMA Calculation: Uses a user-defined period to compute a Simple Moving Average, providing a baseline for price movement.
Z-Score: Measures the number of standard deviations the current price is from the SMA. This is crucial for identifying extreme price movements.
Formula: Z-Score = (Current Price - SMA) / Standard Deviation
Signal Generation:
Buy Signal: Generated when the Z-Score falls below a predefined threshold, suggesting the price is significantly below its mean and potentially undervalued.
Sell Signal: Triggered when the Z-Score exceeds another threshold, indicating the price is significantly above its mean and possibly overvalued.
Visual Indicators:
SMA Line: Plotted in blue on the chart for easy reference.
Z-Score Line: Available but hidden by default, can be shown if needed for deeper analysis.
Buy/Sell Signals: Represented by green up-arrows for buy signals and red down-arrows for sell signals.
Background Color: Changes to green or red subtly to indicate buy or sell zones based on Z-Score thresholds.
Z-Score Label: Provides the numerical Z-Score for each bar, aiding in precise decision-making.
Customizable Parameters:
SMA Length: Adjust the period over which the SMA is calculated.
Lookback Period: Set the number of periods for calculating the standard deviation and Z-Score.
Buy/Sell Z-Scores: Thresholds for generating buy and sell signals can be tailored to your strategy or market conditions. FX:EURUSD FX:EURUSD
Usage Tips:
This indicator is best used in conjunction with other forms of analysis for confirmation. Mean reversion does not always hold in trending markets.
Adjust the Z-Score thresholds based on asset volatility for more or less frequent signals.
Backtest with historical data to optimize settings for your specific trading approach.
Note: While this indicator can help identify potential trading opportunities based on statistical anomalies, it does not guarantee success and should be part of a broader trading strategy that includes risk management and market context understanding.
Wave Surge [UAlgo]The "Wave Surge " is a comprehensive indicator designed to provide advanced wave pattern analysis for market trends and price movements. Built with customizable parameters, it caters to both beginner and advanced traders looking to improve their decision-making process.
This indicator utilizes wave-based calculations, adaptive thresholds, and volume analysis to detect and visualize key market signals. By integrating multiple analysis techniques.
It calculates waves for high, low, and close prices using a configurable moving average (EMA) technique and pairs it with volume and baseline analysis to confirm patterns. The result is a robust framework for identifying potential entry and exit points in the market.
🔶 Key Features
Wave-Based Analysis: This indicator computes waves using exponential moving averages (EMA) of high, low, and close prices, with an adjustable wave period to suit different market conditions.
Customizable Baseline: Traders can select from multiple baseline types, including VWMA (Volume-Weighted Moving Average), EMA, SMA (Simple Moving Average), and HMA (Hull Moving Average), for trend confirmation.
Adaptive Thresholds: The adaptive threshold feature dynamically adjusts sensitivity based on a chosen period, ensuring the indicator remains responsive to varying market volatility.
Volume Analysis: The integrated volume analysis calculates volume ratios and allows traders to enable or disable this feature to refine signal accuracy.
Pattern Recognition: The indicator identifies specific wave patterns (Wave 1, Wave 3, Wave 4, Wave 5, Wave 6) and visually plots them on the chart for easy interpretation.
Visual and Color-Coded Signals: Clear visual signals (upward and downward arrows) are plotted on the chart to highlight potential bullish or bearish patterns. The baseline is color-coded for an intuitive understanding of market trends.
Configuration: Parameters for wave period, baseline length, volume factors, and sensitivity can be tailored to align with the trader’s strategy and market environment.
🔶 Interpreting the Indicator
Wave Patterns
The indicator detects and plots six unique wave patterns based on price changes that exceed an adaptive threshold. These patterns are validated by the direction of the baseline:
Wave 1 (Bullish): Triggered when the price increases above the threshold while the baseline is falling.
Wave 3, 4, and 6 (Bearish): Indicate potential downtrends validated by a rising baseline.
Wave 5 (Bullish): Suggests upward momentum when prices exceed the threshold with a falling baseline.
Baseline Trend
The baseline serves as a trend confirmation tool, dynamically changing color to reflect market direction:
Aqua (Rising): Indicates an upward trend.
Red (Falling): Indicates a downward trend.
Volume Confirmation
When enabled, the volume analysis feature ensures that signals are supported by significant volume movements. Patterns with high volume are considered more reliable.
Signal Visualization
Upward Arrows (🡹): Highlight potential bullish opportunities.
Downward Arrows (🡻): Highlight potential bearish opportunities.
Alerts
Alerts are triggered when key wave patterns are identified, providing traders with timely notifications to take action without being tied to the screen.
🔶 Disclaimer
Use with Caution: This indicator is provided for educational and informational purposes only and should not be considered as financial advice. Users should exercise caution and perform their own analysis before making trading decisions based on the indicator's signals.
Not Financial Advice: The information provided by this indicator does not constitute financial advice, and the creator (UAlgo) shall not be held responsible for any trading losses incurred as a result of using this indicator.
Backtesting Recommended: Traders are encouraged to backtest the indicator thoroughly on historical data before using it in live trading to assess its performance and suitability for their trading strategies.
Risk Management: Trading involves inherent risks, and users should implement proper risk management strategies, including but not limited to stop-loss orders and position sizing, to mitigate potential losses.
No Guarantees: The accuracy and reliability of the indicator's signals cannot be guaranteed, as they are based on historical price data and past performance may not be indicative of future results.

Quick scan for signal🙏🏻 Hey TV, this is QSFS, following:
^^ Quick scan for drift (QSFD)
^^ Quick scan for cycles (QSFC)
As mentioned before, ML trading is all about spotting any kind of non-randomness, and this metric (along with 2 previously posted) gonna help ya'll do it fast. This one will show you whether your time series possibly exhibits mean-reverting / consistent / noisy behavior, that can be later confirmed or denied by more sophisticated tools. This metric is O(n) in windowed mode and O(1) if calculated incrementally on each data update, so you can scan Ks of datasets w/o worrying about melting da ice.
^^ windowed mode
Now the post will be divided into several sections, and a couple of things I guess you’ve never seen or thought about in your life:
1) About Efficiency Ratios posted there on TV;
Some of you might say this is the Efficiency Ratio you’ve seen in Perry's book. Firstly, I can assure you that neither me nor Perry, just as X amount of quants all over the world and who knows who else, would say smth like, "I invented it," lol. This is just a thing you R&D when you need it. Secondly, I invite you (and mods & admin as well) to take a lil glimpse at the following screenshot:
^^ not cool...
So basically, all the Efficiency Ratios that were copypasted to our platform suffer the same bug: dudes don’t know how indexing works in Pine Script. I mean, it’s ok, I been doing the same mistakes as well, but loxx, cmon bro, you... If you guys ever read it, the lines 20 and 22 in da code are dedicated to you xD
2) About the metric;
This supports both moving window mode when Length > 0 and all-data expanding window mode when Length < 1, calculating incrementally from the very first data point in the series: O(n) on history, O(1) on live updates.
Now, why do I SQRT transform the result? This is a natural action since the metric (being a ratio in essence) is bounded between 0 and 1, so it can be modeled with a beta distribution. When you SQRT transform it, it still stays beta (think what happens when you apply a square root to 0.01 or 0.99), but it becomes symmetric around its typical value and starts to follow a bell-shaped curve. This can be easily checked with a normality test or by applying a set of percentiles and seeing the distances between them are almost equal.
Then I noticed that on different moving window sizes, the typical value of the metric seems to slide: higher window sizes lead to lower typical values across the moving windows. Turned out this can be modeled the same way confidence intervals are made. Lines 34 and 35 explain it all, I guess. You can see smth alike on an autocorrelogram. These two match the mean & mean + 1 stdev applied to the metric. This way, we’ve just magically received data to estimate alpha and beta parameters of the beta distribution using the method of moments. Having alpha and beta, we can now estimate everything further. Btw, there’s an alternative parameterization for beta distributions based on data length.
Now what you’ll see next is... u guys actually have no idea how deep and unrealistically minimalistic the underlying math principles are here.
I’m sure I’m not the only one in the universe who figured it out, but the thing is, it’s nowhere online or offline. By calculating higher-order moments & combining them, you can find natural adaptive thresholds that can later be used for anomaly detection/control applications for any data. No hardcoded thresholds, purely data-driven. Imma come back to this in one of the next drops, but the truest ones can already see it in this code. This way we get dem thresholds.
Your main thresholds are: basis, upper, and lower deviations. You can follow the common logic I’ve described in my previous scripts on how to use them. You just register an event when the metric goes higher/lower than a certain threshold based on what you’re looking for. Then you take the time series and confirm a certain behavior you were looking for by using an appropriate stat test. Or just run a certain strategy.
To avoid numerous triggers when the metric jitters around a threshold, you can follow this logic: forget about one threshold if touched, until another threshold is touched.
In general, when the metric gets higher than certain thresholds, like upper deviation, it means the signal is stronger than noise. You confirm it with a more sophisticated tool & run momentum strategies if drift is in place, or volatility strategies if there’s no drift in place. Otherwise, you confirm & run ~ mean-reverting strategies, regardless of whether there’s drift or not. Just don’t operate against the trend—hedge otherwise.
3) Flex;
Extension and limit thresholds based on distribution moments gonna be discussed properly later, but now you can see this:
^^ magic
Look at the thresholds—adaptive and dynamic. Do you see any optimizations? No ML, no DL, closed-form solution, but how? Just a formula based on a couple of variables? Maybe it’s just how the Universe works, but how can you know if you don’t understand how fundamentally numbers 3 and 15 are related to the normal distribution? Hm, why do they always say 3 sigmas but can’t say why? Maybe you can be different and say why?
This is the primordial power of statistical modeling.
4) Thanks;
I really wanna dedicate this to Charlotte de Witte & Marion Di Napoli, and their new track "Sanctum." It really gets you connected to the Source—I had it in my soul when I was doing all this ∞

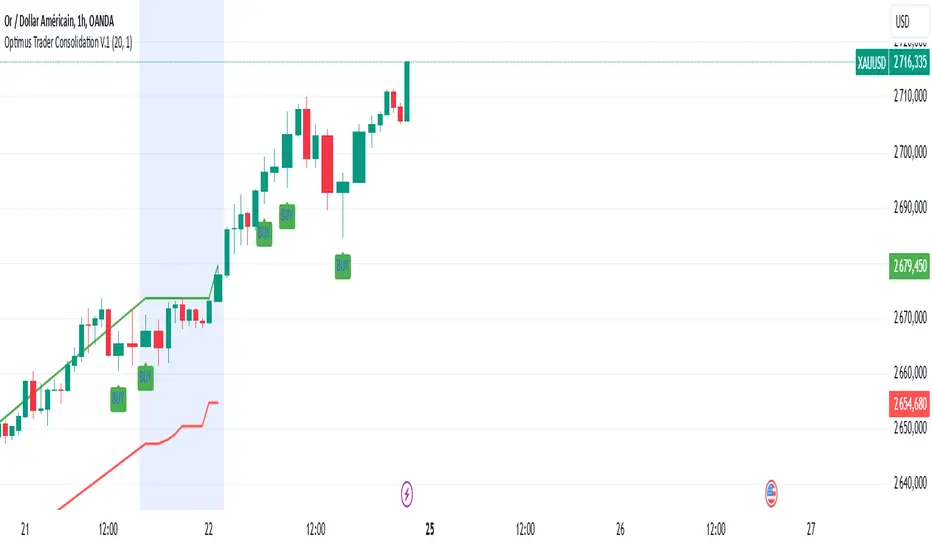
Optimus Trader Consolidation V.1 Indicator Description: "Optimus Trader Consolidation V.1"
This Pine Script indicator is designed to assist traders by identifying key market conditions, including **trend direction**, **volume dynamics**, **liquidity zones**, and **consolidation periods**, alongside candlestick patterns like **Pin Bars** and **Inside Bars**. It provides clear buy and sell signals based on a confluence of these factors. Here’s a detailed breakdown of its functionality:
---
Key Features:
1. **Moving Average (MA) and VWAP Integration**:
- The indicator uses a 50-period Simple Moving Average (SMA) and VWAP (Volume Weighted Average Price) to identify the market trend.
- **Uptrend**: Price is above both the MA and VWAP.
- **Downtrend**: Price is below both the MA and VWAP.
2. **Volume Threshold**:
- A dynamic volume threshold is calculated based on the 20-period SMA of volume, multiplied by a factor of 1.2.
- This ensures signals are filtered to consider only significant volume spikes, avoiding noise from low-volume periods.
3. **Pin Bar Detection**:
- Identifies bullish and bearish Pin Bars based on candlestick characteristics:
- **Bullish Pin Bar**: Large wick above the body, small lower wick, and a green body.
- **Bearish Pin Bar**: Large wick below the body, small upper wick, and a red body.
4. **Inside Bar Detection**:
- Detects Inside Bars, where the current candle’s high and low are fully contained within the previous candle’s range.
- Indicates a period of indecision or potential breakout zones.
5. **Liquidity Zone Identification**:
- Uses recent 20-period highs and lows to approximate liquidity zones.
- Highlights areas where price is near these zones, indicating potential support or resistance.
6. **Buy and Sell Signal Generation**:
- **Buy Signal**: Triggered when a bullish Pin Bar or Inside Bar occurs in an uptrend, with high volume, and near liquidity zones.
- **Sell Signal**: Triggered when a bearish Pin Bar or Inside Bar occurs in a downtrend, with high volume, and near liquidity zones.
- Signals are visually plotted with green (BUY) and red (SELL) markers.
7. **Consolidation Zone Detection**:
- Identifies periods of low price range volatility using a user-defined period (`length`) and range threshold (`range_threshold` in %).
- Highlights periods where the price range is less than the threshold, visually marking consolidation zones.
- Upper and lower boundaries of consolidation zones are plotted with green and red lines, respectively.
8. **Visual Enhancements**:
- Consolidation zones are shaded with a blue background to make them easily recognizable.
- Clear markers for buy and sell signals help traders quickly spot opportunities.
---
Use Cases:
- **Trend Confirmation**: By integrating MA, VWAP, and volume analysis, this indicator helps confirm trends before entering trades.
- **Liquidity Zone Trading**: Identifies price areas where support or resistance may lead to significant price movement.
- **Consolidation Breakouts**: Highlights consolidation zones, which often precede explosive moves, allowing traders to anticipate breakouts.
- **Candlestick Reversal Patterns**: Pin Bars and Inside Bars are powerful patterns that provide early indications of potential reversals or continuation setups.
---
Customizable Parameters:
- **MA Period**: Length of the moving average (default: 50).
- **Volume Threshold**: Sensitivity to volume spikes (default: 20-period SMA × 1.2).
- **Consolidation Period**: Lookback period for identifying consolidation (default: 20).
- **Consolidation Range Threshold**: Maximum percentage range considered as consolidation (default: 1%).
---
Visualization:
- **Green BUY Signals**: Bullish opportunities based on confluence of patterns, trends, and volume.
- **Red SELL Signals**: Bearish opportunities under similar conditions.
- **Consolidation Zones**: Marked by shaded blue backgrounds and clear horizontal lines for high and low boundaries.
- **Dynamic Levels**: Liquidity zones (highs and lows) plotted for added context.
---
Advantages:
- **Confluence of Factors**: Combines trend, volume, and candlestick analysis for robust signal generation.
- **Market State Detection**: Effectively identifies consolidation and breakout conditions.
- **Customizable**: Users can fine-tune parameters for different instruments or trading styles.
---
This indicator is ideal for traders seeking a comprehensive tool to navigate market conditions with precision, leveraging multiple layers of analysis in a single, easy-to-use overlay.
Reversal Signals [AlgoAlpha]📈🔄 Reversal Signals – Master Market Reversals with Precision! 🚀✨
Elevate your trading strategy with the Reversal Signals indicator by AlgoAlpha. This advanced tool is designed to pinpoint potential bullish and bearish reversals by analyzing price action and, optionally, volume confirmations. It seamlessly combines reversal detection with trend analysis, giving you a comprehensive view of market dynamics to make informed trading decisions.
Key Features
🔎 Price Action Reversal Detection : Identifies potential reversal points by comparing current price movements against historical candle patterns within a customizable lookback period.
📊 Volume Confirmation : Optionally integrates volume analysis to confirm the strength of reversal signals, enhancing their reliability.
📈 Stepped Moving Average Trend Indicator : Employs a stepped moving average that adjusts at set intervals to reflect underlying market trends.
⚙️ Customizable Settings : Tailor the indicator to your trading style with adjustable parameters for lookback periods, confirmation windows, moving average types, and more.
🎨 Visual Signals and Trend Coloring : Clear on-chart labels for reversal signals and color-coded trend areas to quickly identify bullish and bearish conditions.
🔔 Alerts for Key Market Events : Set up custom alerts for reversal signals and trend shifts to stay ahead of market movements.
Quick Guide to Using the Reversal Signals Indicator :
🛠 Add the Indicator : Add the indicator to your favorites by pressing the star icon. Customize settings like Candle Lookback, Confirm Within, and Use Volume Confirmation to fit your trading style.
📊 Market Analysis : Observe the "𝓡" labels on the chart indicating bullish and bearish reversal signals. Look for labels below the bars for bullish signals and above the bars for bearish signals. Use the color-filled areas between the stepped moving average and the center line to assess market trends.
🔔 Alerts : Enable notifications for reversal signals and trend shifts to stay informed about market movements without constantly monitoring the chart.
How It Works
The Reversal Signals indicator operates by conducting a thorough analysis of price action over a user-defined lookback period. For a bullish reversal, the indicator checks if the current closing price is lower than the lows of the preceding candles within the lookback window, suggesting a potential oversold condition. If this criterion is met, it marks the candle as a potential reversal point and waits for confirmation within a specified number of subsequent candles. Confirmation occurs when the price rises above the high of the identified candle, signaling a bullish reversal. An optional volume confirmation can be enabled to ensure that the reversal is supported by higher-than-average trading volume, adding an extra layer of validation to the signal. The process is mirrored for bearish reversals, where the indicator looks for the closing price exceeding previous highs and awaits confirmation of a downward move.
Complementing the reversal signals, the indicator features a stepped moving average that serves as a dynamic trend indicator. This moving average updates at intervals defined by the MA Step Period and shifts direction based on price crossings. If the price remains above the stepped MA, it indicates a bullish trend, coloring the area between the MA and the center line in green. Conversely, if the price falls below the stepped MA, a bearish trend is signaled, and the area is shaded red. This visual representation helps traders quickly assess the prevailing market trend and align their trading decisions accordingly.
Experience a new level of market insight with the Reversal Signals indicator. Add it to your TradingView chart today and enhance your ability to detect and act on key ma

Samih Signal AV V2The Samih Signal VA indicator is built for traders who prioritize technical analysis to determine market entry and exit points. It combines signals based on volume, moving averages, the Volume Weighted Average Price (VWAP), and identifies specific candlestick patterns, such as the Pin Bar and Inside Bar. This indicator assists in spotting optimal moments to buy or sell by analyzing trends, volume activity, and nearby liquidity zones.
Parameters and Features:
Simple Moving Average (MA) and VWAP:
Samih Signal VA uses a 50-period simple moving average for trend identification, paired with VWAP to refine price analysis with volume-weighted data.
Together, these components reveal whether the market is trending upward or downward, strengthening the reliability of entry and exit signals.
Volume Threshold:
A volume filter is applied by calculating a 20-period moving average, then setting a threshold at 1.2 times this average volume. This filter helps prevent false signals, focusing only on periods of increased market interest.
Candlestick Pattern Recognition:
Pin Bar: Detects this popular reversal/continuation pattern in both bullish and bearish scenarios, indicating potential entry or exit points.
Inside Bar: Identifies this pattern, which represents a moment of price compression and indecision, often preceding a breakout.
Trend Identification:
The indicator defines an uptrend when the price remains above both the MA and VWAP. A downtrend is confirmed when the price stays below these indicators.
Liquidity Zone Detection:
Samih Signal VA includes a feature to approximate liquidity zones, identifying recent support and resistance levels. Recognizing when prices approach these areas enhances the accuracy of buy or sell signals.
Buy and Sell Signal Logic:
Buy Signal: Triggered when a bullish Pin Bar or Inside Bar appears in an uptrend with high volume and proximity to a liquidity zone.
Sell Signal: Generated when a bearish Pin Bar or Inside Bar is detected in a downtrend with high volume, near a liquidity zone.
Signal Display on the Chart:
The indicator marks buy signals with a green “BUY” label below the bar, and sell signals with a red “SELL” label above the bar, directly on the chart for immediate clarity.
Summary:
The Samih Signal VA is suited for traders focused on precise entries and exits, integrating trend analysis, volume metrics, and candlestick patterns. By identifying liquidity zones, this indicator reduces the likelihood of false signals and provides clear buy and sell alerts.
This description can be easily added to TradingView to help users understand the features and decision-making logic of the Samih Signal VA indicator. Let me know if you’d like any additional adjustments!
Optimus trader Optimus Trader
Indicator Description:
The Optimus Trader indicator is designed for technical traders looking for entry and exit points in financial markets. It combines signals based on volume, moving averages, VWAP (Volume Weighted Average Price), as well as the recognition of candlestick patterns such as Pin Bar and Inside Bars. This indicator helps identify opportune moments to buy or sell based on trends, volumes, and recent liquidity zones.
Parameters and Features:
1. Simple Moving Average (MA) and VWAP:
- Optimus Trader uses a 50-period simple moving average to determine the underlying trend. It also includes VWAP for precise price analysis based on traded volumes.
- These two indicators help identify whether the market is in an uptrend or downtrend, enhancing the reliability of buy and sell signals.
2. Volume :
- To avoid false signals, a volume threshold is set using a 20-period moving average, adjusted to 1.2 times the average volume. This filters signals by considering only high-volume periods, indicating heightened market interest.
3. Candlestick Pattern Recognition:
- Pin Bar: This sought-after candlestick pattern is detected for both bullish and bearish setups. A bullish or bearish *Pin Bar* often signals a possible reversal or continuation.
- *Inside Bar*: This price compression pattern is also detected, indicating a zone of indecision before a potential movement.
4. Trend:
- An uptrend is confirmed when the price is above the MA and VWAP, while a downtrend is identified when the price is below both indicators.
5. Liquidity Zones:
- Optimus Trader includes an approximate liquidity zone detection feature. By identifying recent support and resistance levels, the indicator detects if the price is near these zones. This feature strengthens the relevance of buy or sell signals.
6. Buy and Sell Signals:
- Buy: A buy signal is generated when the indicator detects a bullish *Pin Bar* or *Inside Bar* in an uptrend with high volume, and the price is close to a liquidity zone.
- Sell: A sell signal is generated when a bearish *Pin Bar* or *Inside Bar* is detected in a downtrend with high volume, and the price is near a liquidity zone.
Signal Display:
The signals are visible directly on the chart:
- A "BUY" label in green is displayed below the bar for buy signals.
- A "SELL" label in red is displayed above the bar for sell signals.
Summary:
This indicator is intended for traders seeking precise entry and exit points by integrating trend analysis, volume, and candlestick patterns. With liquidity zones, *Optimus Trader* helps minimize false signals, providing clear and accurate alerts.
---
This description can be directly added to TradingView to help users quickly understand the features and logic of this indicator.

Trend Trader-RemasteredThe script was originally coded in 2018 with Pine Script version 3, and it was in invite only status. It has been updated and optimised for Pine Script v5 and made completely open source.
Overview
The Trend Trader-Remastered is a refined and highly sophisticated implementation of the Parabolic SAR designed to create strategic buy and sell entry signals, alongside precision take profit and re-entry signals based on marked Bill Williams (BW) fractals. Built with a deep emphasis on clarity and accuracy, this indicator ensures that only relevant and meaningful signals are generated, eliminating any unnecessary entries or exits.
Key Features
1) Parabolic SAR-Based Entry Signals:
This indicator leverages an advanced implementation of the Parabolic SAR to create clear buy and sell position entry signals.
The Parabolic SAR detects potential trend shifts, helping traders make timely entries in trending markets.
These entries are strategically aligned to maximise trend-following opportunities and minimise whipsaw trades, providing an effective approach for trend traders.
2) Take Profit and Re-Entry Signals with BW Fractals:
The indicator goes beyond simple entry and exit signals by integrating BW Fractal-based take profit and re-entry signals.
Relevant Signal Generation: The indicator maintains strict criteria for signal relevance, ensuring that a re-entry signal is only generated if there has been a preceding take profit signal in the respective position. This prevents any misleading or premature re-entry signals.
Progressive Take Profit Signals: The script generates multiple take profit signals sequentially in alignment with prior take profit levels. For instance, in a buy position initiated at a price of 100, the first take profit might occur at 110. Any subsequent take profit signals will then occur at prices greater than 110, ensuring they are "in favour" of the original position's trajectory and previous take profits.
3) Consistent Trend-Following Structure:
This design allows the Trend Trader-Remastered to continue signaling take profit opportunities as the trend advances. The indicator only generates take profit signals in alignment with previous ones, supporting a systematic and profit-maximising strategy.
This structure helps traders maintain positions effectively, securing incremental profits as the trend progresses.
4) Customisability and Usability:
Adjustable Parameters: Users can configure key settings, including sensitivity to the Parabolic SAR and fractal identification. This allows flexibility to fine-tune the indicator according to different market conditions or trading styles.
User-Friendly Alerts: The indicator provides clear visual signals on the chart, along with optional alerts to notify traders of new buy, sell, take profit, or re-entry opportunities in real-time.

Dynamic Sentiment RSI [UAlgo]The Dynamic Sentiment RSI is a technical analysis tool that combines the classic RSI (Relative Strength Index) concept with dynamic sentiment analysis, offering traders enhanced insights into market conditions. Unlike the traditional RSI, this indicator integrates volume weighting, sentiment factors, and smoothing features to provide a more nuanced view of momentum and potential market reversals. It is designed to assist traders in detecting overbought/oversold conditions, momentum shifts, and to generate potential buy or sell signals using crossover and crossunder techniques. By dynamically adjusting based on sentiment and volume factors, this RSI offers better adaptability to varying market conditions, making it suitable for different trading styles and timeframes.
This tool is particularly helpful for traders who wish to explore not only price movement but also the underlying market sentiment, offering a more comprehensive approach to momentum analysis. The sentiment factor amplifies the RSI's sensitivity to price shifts, making it easier to detect early signals of market reversals or the continuation of a trend.
🔶 Key Features
Dynamic Sentiment Calculation: The indicator incorporates a "Sentiment Factor" that adjusts the RSI length dynamically based on a multiplier, helping traders better understand market sentiment at different time intervals.
Volume Weighting: When enabled, the RSI calculations are weighted by volume, allowing traders to give more importance to price movements with higher trading volume, which may provide more accurate signals.
Smoothing Feature: A customizable smoothing period is applied to the RSI to help filter out noise and make the signal smoother. This feature is particularly useful for traders who prefer to focus on long-term trends while minimizing false signals.
Step Size Customization: A "Step Size" input allows users to round the sentiment RSI to predefined intervals, making the results easier to interpret and act upon. This feature allows you to focus on significant sentiment changes and ignore minor fluctuations.
Crossover/Crossunder Alerts: The indicator includes crossover and crossunder signals on the zero-line, helping traders identify potential buy and sell opportunities as the smoothed RSI crosses these levels.
The indicator offers a clear visual display with multiple color-coded lines and areas:
Sentiment RSI: Plotted as an area chart, color-coded based on sentiment strength.
Raw RSI: A purple line representing the raw adjusted RSI.
Smoothed RSI: A dynamic line, color-coded aqua or orange based on its position relative to the zero line.
Buy/Sell Signals: Triangle shapes are plotted at crossovers and crossunders, providing clear entry and exit points.
🔶 Interpreting the Indicator
Sentiment RSI
-This line represents the sentiment-adjusted RSI, where the higher the value, the stronger the bullish sentiment, and the lower the value, the stronger the bearish sentiment. It is rounded to step intervals, making it easier to detect significant shifts in sentiment.
- A positive sentiment RSI (above 0) suggests bullish market conditions, while a negative sentiment RSI (below 0) suggests bearish conditions.
Smoothed RSI
The smoothed RSI helps reduce noise and shows the trend more clearly.
Crossovers of the zero line are significant:
- Crossover above zero: Indicates that bullish momentum is building, potentially signaling a buying opportunity.
- Crossunder below zero: Signals a shift towards bearish momentum, potentially indicating a sell signal.
Traders should look for these crossovers in conjunction with other signals for more accurate entry/exit points.
Raw RSI (Adjusted)
The raw adjusted RSI offers a less smoothed, more responsive version of the RSI. While it may be noisier, it provides early signals of market reversals and trends.
Crossover/Crossunder Signals
- When the smoothed RSI crosses above the zero line, a "Signal Up" triangle appears, indicating a potential buying opportunity.
- When the smoothed RSI crosses below the zero line, a "Signal Down" triangle appears, signaling a potential sell opportunity.
These signals help traders time their entries and exits by identifying momentum shifts.
Volume Weighting (Optional)
- If volume weighting is enabled, the RSI will give more weight to periods of higher trading volume, making the signals more reliable when the market is highly active.
Strong Up/Down Levels (40/-40)
- These dotted lines represent extreme sentiment levels. When the sentiment RSI reaches 40 or -40, the market may be nearing an overbought or oversold condition, respectively. This could be a signal for traders to prepare for potential reversals or shifts in momentum.
By combining the various components of this indicator, traders can gain a comprehensive view of market sentiment and price action, helping them make more informed trading decisions. The combination of sentiment factors, volume weighting, and smoothing makes this indicator highly flexible and suitable for a variety of trading strategies.
🔶 Disclaimer
Use with Caution: This indicator is provided for educational and informational purposes only and should not be considered as financial advice. Users should exercise caution and perform their own analysis before making trading decisions based on the indicator's signals.
Not Financial Advice: The information provided by this indicator does not constitute financial advice, and the creator (UAlgo) shall not be held responsible for any trading losses incurred as a result of using this indicator.
Backtesting Recommended: Traders are encouraged to backtest the indicator thoroughly on historical data before using it in live trading to assess its performance and suitability for their trading strategies.
Risk Management: Trading involves inherent risks, and users should implement proper risk management strategies, including but not limited to stop-loss orders and position sizing, to mitigate potential losses.
No Guarantees: The accuracy and reliability of the indicator's signals cannot be guaranteed, as they are based on historical price data and past performance may not be indicative of future results.
