Dominance Signal Apex [CHE]]Dominance Signal Apex — Triple-confirmed entry markers with stateful guardrails
Summary
This indicator focuses on entry timing by plotting markers only when three conditions align: a closed-bar Heikin-Ashi bias, a monotonic stack of super-smoother filters, and the current HMA slope. A compact state machine provides guardrails: it starts a directional state on closed-bar Heikin-Ashi bias, maintains it only while the smoother stack remains ordered, and renders a marker only if HMA slope agrees. This design aims for selective signals and reduces isolated prints during mixed conditions. Markers fade over time to visualize the age and persistence of the current state.
Motivation: Why this design?
Common triggers flip frequently in noise or react late when regimes shift. The core idea is to gate entry markers through a closed-bar state plus independent filter alignment. The state machine limits premature prints, removes markers when alignment breaks, and uses the HMA as a final directional gate. The result is fewer mixed-context entries and clearer clusters during sustained trends.
What’s different vs. standard approaches?
Reference baseline: Single moving-average slope or classic MA cross signals.
Architecture differences:
Multi-length two-pole super-smoother stack with strict ordering checks.
Closed-bar Heikin-Ashi bias to start a directional state.
HMA slope as a final gate for rendering markers.
Time-based alpha fade to surface state age.
Practical effect: Entry markers appear in clusters during aligned regimes and are suppressed when conditions diverge, improving selectivity.
How it works (technical)
Measurements: Four recursive super-smoother series on price at short to medium horizons. Up regime means each shorter smoother sits below the next longer one; down regime is the inverse.
State machine: On bar close, positive Heikin-Ashi bias starts a bull state and negative bias starts a bear state. The state terminates the moment the smoother ordering breaks relative to the prior bar.
Rendering gate: A marker prints only if the active state agrees with the current HMA slope. The HMA is plotted and colored by slope for context.
Normalization and clamping: Marker transparency transitions from a starting to an ending alpha across a fixed number of bars, clamped within the allowed range.
Initialization: Persistent variables track state and bar-count since state start; Heikin-Ashi open is seeded on the first valid bar.
HTF/security: None used. State updates are closed-bar, which reduces repaint paths.
Bands: Smoothed high, low, centerline, and offset bands are computed but not rendered.
Parameter Guide
Show Markers — Toggle rendering — Default: true — Hides markers without changing logic.
Bull Color / Bear Color — Visual colors — Defaults: bright green / red — Aesthetic only.
Start Alpha / End Alpha — Transparency range — Defaults: one hundred / fifty, within zero to one hundred — Controls initial visibility and fade endpoint.
Steps — Fade length in bars — Default: eight, minimum one — Longer values extend the visual memory of a state.
Smoother Length — Internal band smoothing — Default: twenty-one, minimum two — Affects computed bands only; not drawn.
Band Multiplier — Internal band offset — Default: one point zero — No impact on markers.
Source — Input for HMA — Default: close — Align with your workflow.
Length — HMA length — Default: fifty, minimum one — Larger values reduce flips; smaller values react faster.
Reading & Interpretation
Entry markers:
Bull marker (below bar): Closed-bar Heikin-Ashi bias is positive, smoother stack remains aligned for up regime, and HMA slope is rising.
Bear marker (above bar): Closed-bar Heikin-Ashi bias is negative, smoother stack remains aligned for down regime, and HMA slope is falling.
Fade: Transparency progresses over the configured steps, indicating how long the current state has persisted.
Practical Workflows & Combinations
Trend following: Focus on marker clusters aligned with HMA color. Add structure filters such as higher highs and higher lows or lower highs and lower lows to avoid counter-trend entries.
Exits/Stops: Consider exiting or reducing risk when smoother ordering breaks, when HMA color flips, or when marker cadence thins out.
Multi-asset/Multi-TF: Suitable for liquid crypto, FX, indices, and equities. On lower timeframes, shorten HMA length and fade steps for faster response.
Behavior, Constraints & Performance
Repaint/confirmation: State transitions and marker eligibility are decided on closed bars; live bars do not commit state changes until close.
security()/HTF: Not used.
Resources: Declared max bars back of one thousand five hundred; recursive filters and persistent states; no explicit loops.
Known limits: Some delay around sharp turns; brief states may start in noisy phases but are quickly revoked when alignment fails; HMA gating can miss very early reversals.
Sensible Defaults & Quick Tuning
Start here: Keep defaults.
Too many flips: Increase HMA length and raise fade steps.
Too sluggish: Decrease HMA length and reduce fade steps.
Markers too faint/bold: Adjust start and end alpha toward lower or higher opacity.
What this indicator is—and isn’t
A selective entry-marker layer that prints only under triple confirmation with stateful guardrails. It is not a full system, not predictive, and does not handle risk. Combine with market structure, risk controls, and position management.
Disclaimer
The content provided, including all code and materials, is strictly for educational and informational purposes only. It is not intended as, and should not be interpreted as, financial advice, a recommendation to buy or sell any financial instrument, or an offer of any financial product or service. All strategies, tools, and examples discussed are provided for illustrative purposes to demonstrate coding techniques and the functionality of Pine Script within a trading context.
Any results from strategies or tools provided are hypothetical, and past performance is not indicative of future results. Trading and investing involve high risk, including the potential loss of principal, and may not be suitable for all individuals. Before making any trading decisions, please consult with a qualified financial professional to understand the risks involved.
By using this script, you acknowledge and agree that any trading decisions are made solely at your discretion and risk.
Best regards and happy trading
Chervolino
EDGE

CAM | Comparison and Normalisation Indicator Description: "CAM | Comparison and Normalisation" 🌟
Overview 📊
The "CAM | Comparison and Normalisation" indicator is a must-have tool for forex traders! 🚀 It analyzes the strength of a currency pair’s base and quote currencies against the pair’s price movement, using automatic detection, composite calculations, and normalization—all wrapped in a colorful, easy-to-read package. 🎨
How It Works 🛠️
- 🔍 **Automatic Currency Detection**: Instantly spots the base (e.g., EUR in EURUSD) and quote (e.g., USD) currencies—no manual setup needed!
- 💪 **Composite Strength Calculation**: Measures each currency’s power by averaging its rate against 9 major currencies (GBP, EUR, CHF, USD, AUD, CAD, NZD, JPY, NOK). A true strength test! 🏋️♂️
- 📏 **Normalization**: Scales everything with a smart formula (price minus moving average, divided by standard deviation) so base, quote, and pair prices play on the same field. ⚖️
- 🎨 **Dynamic Visualization**:
- Plots 3 normalized lines with unique colors:
- **Base Composite** (e.g., purple for GBP, blue for EUR)
- **Quote Composite** (e.g., green for USD, yellow for JPY)
- **Actual Pair** (⚪ white)
- Adds labels on the last bar (e.g., "Base: GBP" in purple). 🏷️
- 📊 **Performance Histogram**: Shows the base vs. quote strength gap with a green (👍) or red (👎) area chart—adjusted by the pair’s price.
- ⚙️ **Customizable Settings**: Adjust Scaling Period (50), Histogram Scale (0.5), and Levels (1, -1) to fit your style! 🎚️
Benefits 🌈
- 🧠 **Simplified Analysis**: Normalized data cuts through the noise, making trends crystal clear.
- ✅ **Enhanced Decisions**: Colorful lines and histograms spotlight trading signals fast.
- ⏱️ **Time-Saver**: No setup—just drop it on a chart and go!
- 🌍 **Versatile**: Works on any supported pair, with colors adapting automatically (e.g., orange AUD on AUDCAD).
- 👀 **Eye-Catching**: Currency-specific colors (like purple GBP from pound notes) make it fun and easy to follow.
How It Helps Traders 💡
- 📈 **Spot Trends**: See if the base is flexing 💪 or the quote is fading 📉, and how it ties to the pair’s price.
- ⚠️ **Catch Divergences**: Histogram flags when currency strength and price don’t match—hello, opportunity! 🚨
- 🛡️ **Manage Risk**: Normalized values and levels help gauge overbought/oversold zones for smarter stops.
- **Big Picture**: Compare currency strength to pair price for strategic edge, whether scalping or swinging.
Example in Action 🎬
- **GBPUSD Chart**:
- purple GBP line climbs, greenUSD dips, histogram turns green 👍—GBP’s gaining! If the white pair line rises too, it’s a bullish hint.
Conclusion ✨
"CAM | Comparison and Normalisation" turns forex complexity into clear, actionable insights. With its auto-detection, vibrant visuals, and trader-friendly design, it’s your shortcut to smarter trades! 📈💰

[AlbaTherium] MTF Volatility Edge Zones Premium for Price Action Volatility Edge Zones Premium for Price Action (HTF)
The MTF Volatility Edge Zones Premium for Price Action is an advanced Multiple Timeframes (MTF) trading indicator that combines the power of volume analysis with price action, designed to reveal key volatility zones and assess market participants’ engagement levels . This tool offers unique insights into the dynamics of higher timeframes (HTF), helping traders identify critical zones of decision-making, such as potential reversals, continuations, or breakout areas.
Introduction to the MTF Volatility Edge Zones Premium
This indicator is built upon a deep understanding of the interaction between price action and volume. By mapping volume data onto price action, Volatility Edge Zones Premium (HTF) pinpoints areas of heightened market engagement. These zones represent where buyers and sellers have shown significant activity, allowing traders to identify market intent and anticipate key movements.
Key Features:
Higher Timeframe Analysis: Focuses on significant price and volume interactions over HTFs (e.g., 4H, Daily, Weekly) for a broader perspective on market trends.
Volatility Zones : Highlights areas where market participants show increased activity, signaling potential market turning points or strong continuations.
Volume-Driven Insights: Tracks the behavior of aggressive buyers and sellers, showing their engagement levels relative to price changes.
Overlayon Price Action: Provides a clear and actionable visual representation of volatility and engagement zones directly on price charts.
Chapter 1: Understanding Volatility and Engagement
1.1 Volatility Edge Zones
Volatility Edge Zones are areas where price and volume interact to signal potential changes in market direction or momentum. These zones are derived from high-volume clusters where significant market activity occurs.
1.2 Participant Engagement
Market participants can be categorized based on their level of engagement in these zones:
Aggressive Buyers: Represented by sharp spikes in volume and upward price action.
Aggressive Sellers: Represented by high volume during downward price movement.
Passive Participants: Identified in zones of consolidation or low volatility.
By isolating these behaviors, traders can gain a clearer picture of market sentiment and the relative strength of buyers versus sellers.
Chapter 2: The Principle of Volume and Price Interplay
2.1 Volume as a Leading Indicator
Volume often precedes price movements, and the Volatility Edge Zones Premium captures this relationship by overlaying volume activity onto price charts. This allows traders to:
Identify where volume supports price movement (trend confirmation).
Spot divergences where price moves without volume support (potential reversals).
2.2 The Role of Higher Timeframes
HTFs filter out market noise, revealing macro trends and key levels of engagement. The indicator uses this perspective to highlight long-term volatility zones, helping traders align their strategies with the broader market context.
Chapter 3: Visualizing Volatility Edge Zones
3.1 Color-Coded Zones for Engagement
The indicator uses a color-coded system to represent volatility zones and market engagement levels. These colors correspond to different market conditions:
Red Zones: High selling pressure and aggressive bearish activity.
Blue Zones: High buying pressure and aggressive bullish activity.
Yellow Zones: Transitional zones, representing indecision or balance between buyers and sellers.
White Zones: Neutral areas, where low engagement is observed but could serve as potential breakout points.
3.2 Key Metrics Tracked
Volume Clusters: Areas of concentrated buying or selling activity.
Directional Bias: Net buying or selling dominance.
Momentum Shifts: Sudden changes in volume relative to price action.
These metrics provide actionable insights into market dynamics, making it easier to predict key movements.
Chapter 4: Practical Applications in Trading
4.1 Identifying High-Impact Zones
By focusing on HTFs, traders can use the Volatility Edge Zones Premium to identify high-impact areas where market participants are most engaged. These zones often align with:
Support and Resistance Levels: High-volume areas that act as barriers or catalysts for price movement.
Breakout Points: Zones of heightened volatility where price is likely to escape consolidation.
4.2 Detecting Bull and Bear Campaigns
The indicator highlights early signs of bullish or bearish campaigns by analyzing volume surges in critical volatility zones. These campaigns often signal the beginning of significant trends.
Chapter 5: Real-World Examples and Strategies
5.1 Spotting Market Reversals
Real-world examples demonstrate how the indicator can identify volatility zones signaling potential reversals, allowing traders to enter positions early.
5.2 Riding the Trend
By tracking volatility zones in alignment with HTF trends, traders can maximize profit potential by entering during periods of high engagement and riding the trend until it weakens.
Conclusion
The MTF Volatility Edge Zones Premium for Price Action is an essential tool for traders looking to master market dynamics through a combination of volume and price action analysis. By focusing on higher timeframes and overlaying volatility zones onto price charts, this indicator provides unparalleled insights into market participant engagement.
Whether you’re trading intraday, swing, or long-term strategies, the MTF Volatility Edge Zones Premium equips you with the information needed to make confident and precise trading decisions. Stay tuned as we continue to enhance this tool for even greater accuracy and usability.

Precision Trading Strategy: Golden EdgeThe PTS: Golden Edge strategy is designed for scalping Gold (XAU/USD) on lower timeframes, such as the 1-minute chart. It captures high-probability trade setups by aligning with strong trends and momentum, while filtering out low-quality trades during consolidation or low-volatility periods.
The strategy uses a combination of technical indicators to identify optimal entry points:
1. Exponential Moving Averages (EMAs): A fast EMA (3-period) and a slow EMA (33-period) are used to detect short-term trend reversals via crossover signals.
2. Hull Moving Average (HMA): A 66-period HMA acts as a higher-timeframe trend filter to ensure trades align with the overall market direction.
3. Relative Strength Index (RSI): A 12-period RSI identifies momentum. The strategy requires RSI > 55 for long trades and RSI < 45 for short trades, ensuring entries are backed by strong buying or selling pressure.
4. Average True Range (ATR): A 14-period ATR ensures trades occur only during volatile conditions, avoiding choppy or low-movement markets.
By combining these tools, the PTS: Golden Edge strategy creates a precise framework for scalping and offers a systematic approach to capitalize on Gold’s price movements efficiently.

Optimal Buy Day (Zeiierman)█ Overview
The Optimal Buy Day (Zeiierman) indicator identifies optimal buying days based on historical price data, starting from a user-defined year. It simulates investing a fixed initial capital and making regular monthly contributions. The unique aspect of this indicator involves comparing systematic investment on specific days of the month against a randomized buying day each month, aiming to analyze which method might yield more shares or a better average price over time. By visualizing the potential outcomes of systematic versus randomized buying, traders can better understand the impact of market timing and how regular investments might accumulate over time.
These statistics are pivotal for traders and investors using the script to analyze historical performance and strategize future investments. By understanding which days offered more shares for their money or lower average prices, investors can tailor their buying strategies to potentially enhance returns.
█ Key Statistics
⚪ Shares
Definition: Represents the total number of shares acquired on a particular day of the month across the entire simulation period.
How It Works: The script calculates how many shares can be bought each day, given the available capital or monthly contribution. This calculation takes into account the day's opening price and accumulates the total shares bought on that day over the simulation period.
Interpretation: A higher number of shares indicates that the day consistently offered better buying opportunities, allowing the investor to acquire more shares for the same amount of money. This metric is crucial for understanding which days historically provided more value.
⚪ AVG Price
Definition: The average price paid per share on a particular day of the month, averaged over the simulation period.
How It Works: Each time shares are bought, the script calculates the average price per share, factoring in the new shares purchased at the current price. This average evolves over time as more shares are bought at varying prices.
Interpretation: The average price gives insight into the cost efficiency of buying shares on specific days. A lower average price suggests that buying on that day has historically led to better pricing, making it a potentially more attractive investment strategy.
⚪ Buys
Definition: The total number of transactions or buys executed on a particular day of the month throughout the simulation.
How It Works: This metric increments each time shares are bought on a specific day, providing a count of all buying actions taken.
Interpretation: The number of buys indicates the frequency of investment opportunities. A higher count could mean more consistent opportunities for investment, but it's important to consider this in conjunction with the average price and the total shares acquired to assess overall strategy effectiveness.
⚪ Most Shares
Definition: Identifies the day of the month on which the highest number of shares were bought, highlighting the specific day and the total shares acquired.
How It Works: After simulating purchases across all days of the month, the script identifies which day resulted in the highest total number of shares bought.
Interpretation: This metric points out the most opportune day for volume buying. It suggests that historically, this day provided conditions that allowed for maximizing the quantity of shares purchased, potentially due to lower prices or other factors.
⚪ Best Price
Definition: Highlights the day of the month that offered the lowest average price per share, indicating both the day and the price.
How It Works: The script calculates the average price per share for each day and identifies the day with the lowest average.
Interpretation: This metric is key for investors looking to minimize costs. The best price day suggests that historically, buying on this day led to acquiring shares at a more favorable average price, potentially maximizing long-term investment returns.
⚪ Randomized Shares
Definition: This metric represents the total number of shares acquired on a randomly selected day of the month, simulated across the entire period.
How It Works: At the beginning of each month within the simulation, the script selects a random day when the market is open and calculates how many shares can be purchased with the available capital or monthly contribution at that day's opening price. This process is repeated each month, and the total number of shares acquired through these random purchases is tallied.
Interpretation: Randomized shares offer a comparison point to systematic buying strategies. By comparing the total shares acquired through random selection against those bought on the best or worst days, investors can gauge the impact of timing and market fluctuations on their investment strategy. A higher total in randomized shares might indicate that over the long term, the specific days chosen for investment might matter less than consistent market participation. Conversely, if systematic strategies yield significantly more shares, it suggests that timing could indeed play a crucial role in maximizing investment returns.
⚪ Randomized Price
Definition: The average price paid per share for the shares acquired on the randomly selected days throughout the simulation period.
How It Works: Each time shares are bought on a randomly chosen day, the script calculates the average price paid for all shares bought through this randomized strategy. This average price is updated as the simulation progresses, reflecting the cost efficiency of random buying decisions.
Interpretation: The randomized price metric helps investors understand the cost implications of a non-systematic, random investment approach. Comparing this average price to those achieved through more deliberate, systematic strategies can reveal whether consistent investment timing strategies outperform random investment actions in terms of cost efficiency. A lower randomized price suggests that random buying might not necessarily result in higher costs, while a higher average price indicates that systematic strategies might provide better control over investment costs.
█ How to Use
Traders can use this tool to analyze historical data and simulate different investment strategies. By inputting their initial capital, regular contribution amount, and start year, they can visually assess which days might have been more advantageous for buying, based on historical price actions. This can inform future investment decisions, especially for those employing dollar-cost averaging strategies or looking to optimize entry points.
█ Settings
StartYear: This setting allows the user to specify the starting year for the investment simulation. Changing this value will either extend or shorten the period over which the simulation is run. If a user increases the value, the simulation begins later and covers a shorter historical period; decreasing the value starts the simulation earlier, encompassing a longer time frame.
Capital: Determines the initial amount of capital with which the simulation begins. Increasing this value simulates starting with more capital, which can affect the number of shares that can be initially bought. Decreasing this value simulates starting with less capital.
Contribution: Sets the monthly financial contribution added to the investment within the simulation. A higher contribution increases the investment each month and could lead to more shares being purchased over time. Lowering the contribution decreases the monthly investment amount.
-----------------
Disclaimer
The information contained in my Scripts/Indicators/Ideas/Algos/Systems does not constitute financial advice or a solicitation to buy or sell any securities of any type. I will not accept liability for any loss or damage, including without limitation any loss of profit, which may arise directly or indirectly from the use of or reliance on such information.
All investments involve risk, and the past performance of a security, industry, sector, market, financial product, trading strategy, backtest, or individual's trading does not guarantee future results or returns. Investors are fully responsible for any investment decisions they make. Such decisions should be based solely on an evaluation of their financial circumstances, investment objectives, risk tolerance, and liquidity needs.
My Scripts/Indicators/Ideas/Algos/Systems are only for educational purposes!

Probabilities Module - The Quant Science This module can be integrate in your code strategy or indicator and will help you to calculate the percentage probability on specific event inside your strategy. The main goal is improve and simplify the workflow if you are trying to build a quantitative strategy or indicator based on statistics or reinforcement model.
Logic
The script made a simulation inside your code based on a single event. For single event mean a trading logic composed by three different objects: entry, take profit, stop loss.
The script scrape in the past through a look back function and return the positive percentage probability about the positive event inside the data sample. In this way you are able to understand and calculate how many time (in percentage term) the conditions inside the single event are positive, helping to create your statistical edge.
You can adjust the look back period in you user interface.
How can set up the module for your use case
At the top of the script you can find:
1. entry_condition : replace the default condition with your specific entry condition.
2. TPcondition_exit : replace the default condition with your specific take profit condition.
3. SLcondition_exit : replace the default condition with your specific stop loss condition.

SuperJump Edge CCI RSIThis indicator for detecting inflection points of CCI and RSI.
Low time frames have high variability, which can lead to more unreliable signals.
But you can filter it appropriately by entering the levels of oversold and overbought.
Because CCI is highly volatile, RSI signals are more reliable.
You can also use it for other panes for example RSI or CCI pane.
Repainting is not used because I implemented the filter by myself.

[TTI] Edge Arrows––––History & Credit
This indicator has been done from deep analysis of the common market conditions prior to having a massive winner. We have analysed over 400 stocks, thought by Mark Minervini in his Master Trader Program and found that in 95% of the cases the EDGE arrow occurs during the buy points!!
–––––What it does
The indicator mixes unique analysis of the RSIs, Moving averages and Bollinger Bands to print out a high probability reversal arrows. It works both on the upside and the downside.
–––––How to use it
Use the indicator as an confirmation signal for the direction of trading. When the arrow EdgeUp points there is high probabiliy of move to the long side and when the arrow EdgeDown prints there is a high probability for reversal trend/
EXAMPLES

Oscillator EdgesAnother simple script to be added on top of other indicators. Simply provides a symbol of varying color depending on the value of the oscillator. Allows up to 4 different colors in each direction. Includes alerts conditions. Demonstration is the indicator being applied to the RSI (purple) included in Market Cipher B.
To use, simply add it to your indicator, and choose and oscillator of your choice in the Input Settings. Alternatively, you can just keep it on 'close' and use the built in RSI. Or, you can use the RSI formula on top of something else (if that's your thing).
The names are silly, so I hope this is okay with all of you.
Let me know what you think, and if there are any problems, questions, or concerns!

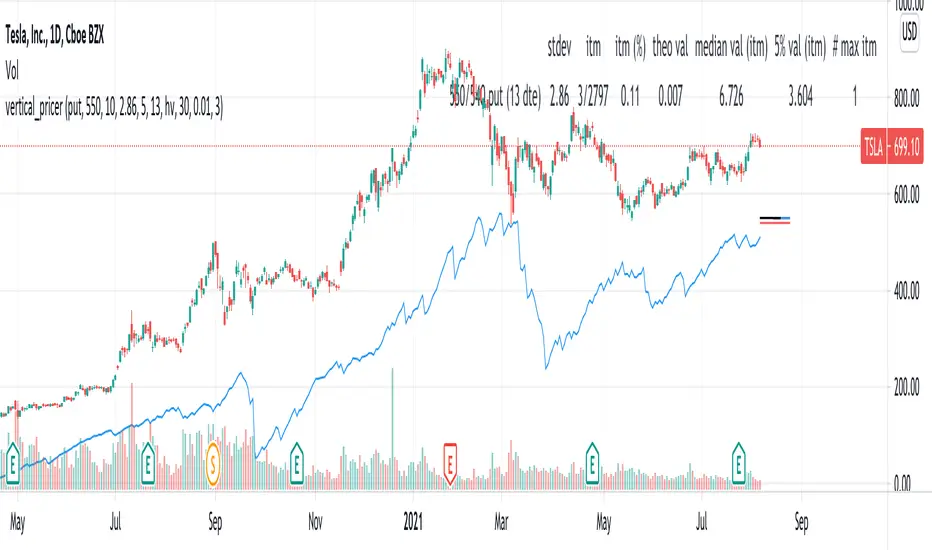
vertical_pricer
USAGE
1. Select the type of contract (call or put), the long strike, and the width.
2. Select the volatility model
3. The standard deviation is shown, enter it into the input.
The tool gives a theoretical price of a vertical spread, based on a
historical sample. The test assumes that a spread of equal width was sold on
every prior trading day at the given standard deviation, based on the
volatility model and duration of the contract. For example, if the 20 dte
110 strike is presently two standard deviations based on the 30 period
historical volatility, then the theoretical value is the average price all
2SD (at 20 dte) calls upon expiration, limited by the width of the spread and
normalized according to the present value of the underlying.
Other statistics include:
- The number of spreads in the sample, and percentage expired itm
- The median value at expiration
- The Nth percentile value of spreads at expiration
- The number of spreads that expired at max loss
Check the script comments and release notes for further updates, since Tradingview doesn't allow me to edit this description.
strangle_pricerUsage:
1. Set the put and call strike inputs to values of your choosing.
2. Select "days to expiration".
3. Set the put and call standard deviations using the output table.
The indicator is meant help price a strangle using historical data and a volatility model. By default, the model is an ewma-method historical volatility. After selecting strikes and standard their corresponding standard deviation, theoretical values and probabilities will be shown in the table. The script is initialized with -1 for several inputs, and won't show any data until these are adjusted.
The theoretical values shown assume a strangle was bought or sold on every historical bar, and averaging their value at expiration.
For example, if you choose the $50 call and $40 put when the underlying is at $45 and there are 30 days until expiration, suppose the volatility is N and
these strikes correspond to M standard deviations. Input those and the resulting theoretial values shown will be based on opening a 30 dte call and put at M standard deviations with respect to the volatility at each bar.
- Past volatility forecasts are plotted in blue, and hidden by default.
- The current volatility forecast is drawn as a blue line.
- The put and call strikes are drawn as red lines.
This indicator is only meant for the daily chart!
Since I won't be able to edit this description later, also check the release notes and script comments for important changes.

GODXBTTRADING SCRIPT "GODXBT"
ALL IN ONE !!!
This script helps you to understand the market situation
Script includes
. Support & resistance tool
. 3 EMA's ( exponential moving average ) ( you can change ema values )
. Smooth Guppy : helps to understand support and resistance also helps to understand trend direction ( Red is bearish trend & Blue is bullish trend )
. And Buy & Sell signals to take entry and exit
how to trade :
Buy/Long when " BUY " signal appears
Sell/Short when " SELL " signal appears
take profits near support and resistance lines / close position on the break of it
* Customized Switches to on/off Guppy , S/R levels
* When guppy is blue longs are profitable and when red shorts are profitable
*DM for access

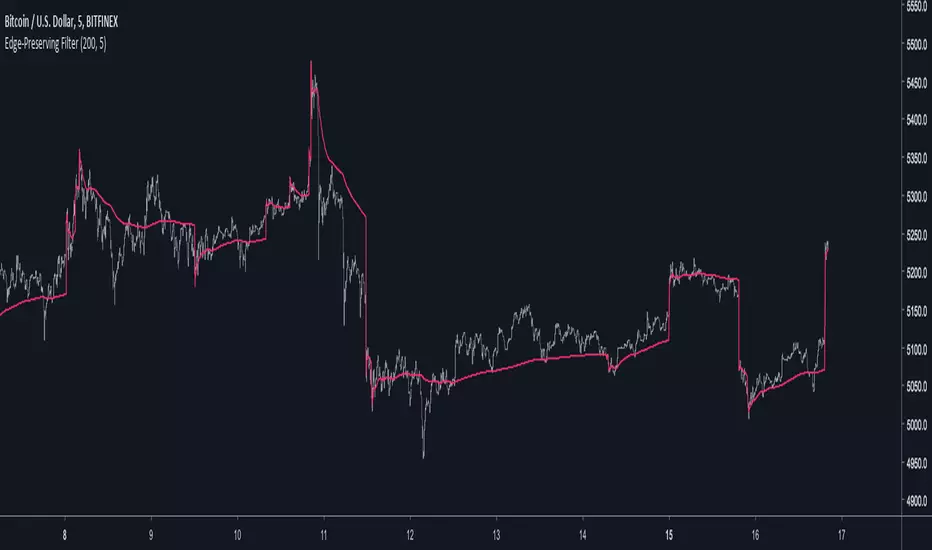
Edge-Preserving FilterIntroduction
Edge-preserving smoothing is often used in image processing in order to preserve edge information while filtering the remaining signal. I introduce two concepts in this indicator, edge preservation and an adaptive cumulative average allowing for fast edge-signal transition with period increase over time. This filter have nothing to do with classic filters for image processing, those filters use kernels convolution and are most of the time in a spatial domain.
Edge Detection Method
We want to minimize smoothing when an edge is detected, so our first goal is to detect an edge. An edge will be considered as being a peak or a valley, if you recall there is one of my indicator who aim to detect peaks and valley (reference at the bottom of the post) , since this estimation return binary outputs we will use it to tell our filter when to stop filtering.
Filtering Increase By Using Multi Steps Cumulative Average
The edge detection is a binary output, using a exponential smoothing could be possible and certainly more efficient but i wanted instead to try using a cumulative average approach because it smooth more and is a bit more original to use an adaptive architecture using something else than exponential averaging. A cumulative average is defined as the sum of the price and the previous value of the cumulative average and then this result is divided by n with n = number of data points. You could say that a cumulative average is a moving average with a linear increasing period.
So lets call CMA our cumulative average and n our divisor. When an edge is detected CMA = close price and n = 1 , else n is equal to previous n+1 and the CMA act as a normal cumulative average by summing its previous values with the price and dividing the sum by n until a new edge is detected, so there is a "no filtering state" and a "filtering state" with linear period increase transition, this is why its multi-steps.
The Filter
The filter have two parameters, a length parameter and a smooth parameter, length refer to the edge detection sensitivity, small values will detect short terms edges while higher values will detect more long terms edges. Smooth is directly related to the edge detection method, high values of smooth can avoid the detection of some edges.
smooth = 200
smooth = 50
smooth = 3
Conclusion
Preserving the price edges can be useful when it come to allow for reactivity during important price points, such filter can help with moving average crossover methods or can be used as a source for other indicators making those directly dependent of the edge detection.
Rsi with a period of 200 and our filter as source, will cross triggers line when an edge is detected
Feel free to share suggestions ! Thanks for reading !
References
Peak/Valley estimator used for the detection of edges in price.
Session P EdgesThis is an attempt to chart the primary balance ranges, however,
I have been having difficulty getting the lows to work in the graph, any assistance would be welcome

B3 Edge Trail-TraderAnswer to the locked strategy... Formerly "High-Low Trader" .. Changed the name to Edge Trail Trader to delineate from the locked version, which is no different. You can add this one to your favorites now.
Similar to SuperTrend or the ATR trailing stop lines that are common-place in chart indicator circles, the B3 High-Low Trail-Trader works as a back-break line to flip binary long and short biasing. Here is the strategy set to 7 bars back. You can find this style of trading system in several books, and there are many ways to come to the trailing stop line, so I imagine the bars back length can be slid around to suit certain charts. This happens to be my favorite trailing line.

B3 AutoEdgeBreak FibonacciHere is the lazy person's Fibonacci retracement drawing machine. Keep the bars in range pretty big, but you can play around and see what it does. If too small, it gets in your way, and If oversized, your retracements will not properly work upward and downward according to action. So, if you notice that it's always retracing the same direction, then lower the first input.
Now on top of the coding being tricky because of massive history in T-view, trading the Fibs is not an easy task either. Experienced Fib traders will probably love my script, and those that are not good at Fibs will love the historical look of it, but feel helpless in real-time. It took me years to learn a reaction pattern to the Fib lines, and the one key piece of my memory: if a price-line test comes and fails in relation to your trade, get out!!! <- Not real advice, just experience talking.
I expect to be upgrading this particular script in the future. Enjoy!

B3 Donchian CloudsThis is the Donchian Channel expressed with a percentage cloud. Default 12.5% of the range will be filled at each edge, this helps to show reversal possibilities as price returns to the area between the clouds. This offers a usage to essentially fade the turtle trader system. That system is loosely based on the playing of the breakouts of the the channel... as you can see the that last turtle trade long in YM1! was and is off the charts awesome. I will look for the fall out of the cloud to short the market.
