[RS]Simple Forecast - Keltner WormsEXPERIMENTAL: Using keltner channels with automatic multiplier finding, offsets and show_last cutoffs to generate a forecast area. video showing why its named keltner worms :p.. streamable.comPine Script®指標由RicardoSantos提供1010898
Spread by//Every spread & central tendency measure in 1 script with comfortable visualization, including scrips's status line. Spread measures: - Standard deviation (for most cases); - Average deviation (if there are extreme values); - GstDev - Geometric Standard Deviation (exclusively for Geometric Mean); - HstDev - Harmonic Deviation (exclusively for Harmonic Mean). These modified functions will calculate everything right, they will take source, length, AND basis of your choice, unlike the ones from TW. Central tendency measures: - Mean (if everything's cool & equal); - Median (values clustering towards low/high part of the rolling window); - Trimean (3/more distinguishable clusters of data); - Midhinhe (2 distinguishable clusters of data); - Geometric Mean ( |low.. ... ... .. .... ... . . . . . . . . . . . .high| this kinda data); <- Exp law - Harmonic Mean { |low. . . . . . . . . . . . . . .. . . .high| kinda data). <- Reciprocal law Listen: 1) Don't hesitate using Standard Deviation with non-mean, like "Midhinge Standard Devition", despite what ol' stats gurus gonna say, it works when it's appropriate; 2) Don't check log space while using Geometric Mean & Geometric Standard Deviation, these 2 implement log stuff by design, I mean unless u wanna make it double xd 3) You can use this script, modify it how you want, ask me questions whatever, just make money using it; 4) Use Midrange & Midpoints in tandem when data follows ~addition law (like this . . . . . . . . . . . . . . . . . . . . .). <- just addition law Look at the data, choose spread measure first, then choose central tendency measure, not vice versa. !!! Ain't gonna place ® sign on standard deviations like one B guy did in 1980s lmao, but if your wanna use Harmonic Deviations in science/write about/cite it/whatever, pls give me a lil credit at least, I've never seen it anywhere and unfortunately had to develop it by myself. it's useful when your data develops by reciprocals law (opposite to exponential). Peace TWPine Script®指標由gorx1提供已更新 1919531
Pre-Market Volume ProfileThis indicator displays the pre-market volume (note: without the post-market of the previous day). Unusual pre-market volume often indicates that institutional market makers are moving the market, which is a good sign for unusual high price movement. The indicator helps me to spot stocks, if a pre-market gap is confirmed with enough (unusual) volume. You can define, what "unusual" means by you, by adjusting the SMA length and the SMA multiplier. The default is a length of 21 bars and a 2.5 multiplier, meaning I'm interested in a stock, if the pre-market volume exceeds the average pre-market volume by 2.5 times.Pine Script®指標由Clansi提供已更新 2727 1 K
Linear Regression (All Data)The tool plots a linear regression line using the entire history of an instrument on chart. There are may be issues on intraday timeframes less then 1h. On daily, weekly and monthly charts it works without problem. If an instrument has a lot of data points, you may not see the line (this is TV feature): To fix that you need to scroll your chart to the left and find the starting point of the line: And then do an auto-scroll to the last bar: Pine Script®指標由everget提供已更新 1616 1 K
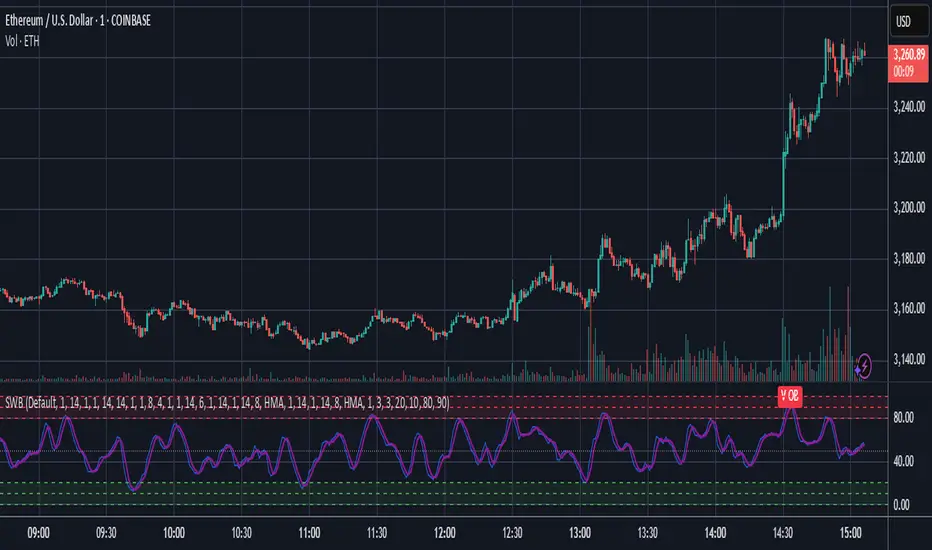
[PX] External LevelHello everyone, today I'd like to share a script, which enables you to use external logic to plot levels on your chart. How does it work? The concept is based on two scripts. One script, which uses an external input as a trigger to print a new level and one script that calculates an output, which will be fetched. Sounds complicated? It really is not! Let's take a closer look. // This source code is subject to the terms of the Mozilla Public License 2.0 at mozilla.org // © paaax //@version=4 study("RSI OS/OB") l = input(14, "RSI Length") ob = input(70, "Overbought") os = input(30, "Oversold") r = rsi(close, l) hline(ob) hline(os) plot(r, "RSI", color=color.orange) // The following plot produces an output, which will be fetched the "External Level"-script. // It evaluates to one of the following three values: 1.0, -1.0 or 0.0 plot(crossover(r, ob) ? 1.0 : crossunder(r, os) ? -1.0 : 0.0, "Output", transp=100) The example script above uses an RSI and two threshold levels (70 and 30). The logic here is, that whenever the RSI is crossing down the lower threshold or crossing up the upper threshold we'd consider the current movement to be either oversold or overbought. Therefore, it's a point of interest, which we could visualize with a level. The script creates an output when the crossover or crossunder of a threshold happens. A crossover would result in a value of 1.0, a crossunder in a value of -1.0. In all other cases the value would be 0.0. The output of the RSI script would then be used as an input of the External Level script, which has a "Source"-parameter in its input-section. If the fetched input shows 1.0, then the script prints a resistance level. If it shows -1.0 a support level will be printed. And that's basically it. A very simple approach to print levels on your chart with an infinite number of use cases. For example, you could use fetch outputs from a MACD script, MA script, outputs based on volume or price movement. Just remember the output has to evaluate to either 1.0 or -1.0 and has to be selected in the input-section. Hope that might be useful to some of you :) Please click the "Like"-button and follow me for future open-source script publications. If you are looking for help with your custom PineScript development, don't hesitate to contact me directly here on Tradingview or through the link in my signature :)Pine Script®指標由paaax提供5252 1.4 K
Bernoulli Process - Binary Entropy FunctionThis indicator is the Bernoulli Process or Wikipedia - Binary Entropy Function . Within Information Theory, Entropy is the measure of available information, here we use a binary variable 0 or 1 (P) and (1-P) (Bernoulli Function/Distribution), and combined with the Shannon Entropy measurement. As you can see below, it produces some wonderful charts and signals, using price, volume, or both summed together. The chart below shows you a couple of options and some critical details on the indicator. The best part about this is the simplicity, all of this information in a couple of lines of code. Using the indicator: The longer the Entropy measurement the more information you are capturing, so the analogy is, the shorter the signal, the less information you have available to utilize. You'll run into your Nyquist frequencies below a length of 5. I've found values between 9 and 22 work well to gather enough measurements. You also have an averaging summation that measures the weight or importance of the information over the summation period. This is also used for highlighting when you have an information signal above the 5% level (2 sigma) and then can be adjusted using the Percent Rank Variable. Finally, you can plot the individual signals (Price or Volume) to get another set of measurements to utilize. As can be seen in the chart below, the volume moves before price (but hopefully you already knew that) At its core, this is taking the Binary Entropy measurement (using a Bernoulli distribution) for price and volume. I've subtracted the volume from the price so that you can use it like a MACD, also for shorter time frames (7, 9, 11) you can get divergences on the histogram. These divergences are primarily due to the weekly nature of the markets (5 days, 10 days is two weeks,...so 9 is measuring the last day of the past two weeks...so 11 is measuring the current day and the past two weeks). Here are a couple of other examples, assuming you just love BTC, Stocks, or FOREX. I fashioned up a strategy to show the potential of the indicator. BTC-Strategy Stock-Strategy (#loveyouNFLX) FOREX - (for everyone hopped up on 40X leverage) Pine Script®指標由kocurekc提供已更新 5353 3.3 K
Relative CandleThis script visualizes the relative movement of a single OHLC candle compared to an index (or another symbol). The vertical location of the candle indicates the general positive/negative comparison of the bar vs the index. The color of the candle indicates how the candle moved relative to the index. The wick indicates the closing range compared to the index (did the symbol close at lows of the bar while the index closed at highs). The area graph in the background shows the average relative close over a 10-day simple moving average. I use this to pop any behavior that is out of line with the market, whether positive or negative. For example, is a red bar day due to the market pullback or something specific to the stock. Or did the market pull back and the stock did the opposite, strong day! Pine Script®指標由drewby4321提供已更新 1515424
Momentum Acceleration by DGTItalian physicist Galileo Galilei is usually credited with being the first to measure speed by considering the distance covered and the time it takes. Galileo defined speed as the distance covered during a period of time. In equation form, that is v = Δd / Δt where v is speed, Δd is change in distance, and Δt is change in time. The Greek symbol for delta, a triangle (Δ), means change. Is the speed getting faster or slower? Acceleration will be the answer, acceleration is defined as the rate of change of speed over a set period of time, meaning something is getting faster or slower. Mathematically expressed, acceleration denoted as a is a = Δv / Δt , where Δv is the change in speed and Δt is the change in time. How to apply in trading Lets think about Momentum, Rate of Return, Rate of Change all are calculated in almost same approach with Speed Momentum measures change in price over a specified time period, Rate of Change measures percent change in price over a specified time period, Rate of Return measures the net gain or loss over a specified time period, And Speed measures change in distance over a specified time period So we may state that measuring the change in distance is also measuring the change in price over a specified time period which is length, hence speed can be calculated as (source – source )/length and acceleration becomes (speed – speed )/length In this study acceleration is used as signal line and result plotted as arrows demonstrating bull or bear direction where direction changes can be considered as trading setups Just a little fun, since we deal with speed the short name of the study is named after famous cartoon character Speedy Gonzales Trading success is all about following your trading strategy and the indicators should fit within your trading strategy, and not to be traded upon solely Disclaimer: The script is for informational and educational purposes only. Use of the script does not constitutes professional and/or financial advice. You alone the sole responsibility of evaluating the script output and risks associated with the use of the script. In exchange for using the script, you agree not to hold dgtrd TradingView user liable for any possible claim for damages arising from any decision you make based on use of the script Pine Script®指標由dgtrd提供已更新 133133 5.4 K
TF Segmented Linear RegressionFit a line at successive intervals, where the interval period is determined by a user-selected time frame, this allows the user to have an estimate of the intrinsic trend within various intervals. Settings Timeframe : Determine the period of the interval, if the timeframe is weekly then a new line will be fit at the start each weeks, by default "Daily" Mult : Multiplication factor for the RMSE, determine the distance between the upper and lower extremities Src : Input data for the indicator Plot Extremities : Logical value, if true then the extremities of the channel are plotted, if false only the midline is plotted, true by default. Usage The timeframe setting should be higher than the current chart timeframe, note however that too large values of timeframe might return an error. Since the maximum number of lines that can be plotted is 54, using the extremities will only return 18 channels. The indicator can be compared to the "regression trend" drawing tool Main tf = 5 min with the indicator using a daily timeframe, the filled area is produced by the regression trend drawing tool using the same interval as the indicator, and coincide with it. Main tf = 15 min with the indicator using a weekly timeframe, wider channel indicate that the values tend to be farther away from the fitted line. A line with a significant slope indicates a strong trend, in that case, the width of the channel is determined by the amplitude of the retracements in the trend, with a narrower channel indicating a cleaner trend. When the fitted line has a low slope value and the channel is wide, it means that there were two or more variations of opposite directions with large amplitudes within the interval, this also indicates that a linear model is not appropriate. A slope approximately equal to 0 with a low channel width indicates a trendless market with cyclical variations of low amplitude in it. Refrences Determining the starting and ending points of the fitted line was done using a linear combination between the wma and sma The wma and sma functions both use a series as period by making use of the Wma and Sum functions in the following script Pine Script®指標由alexgrover提供2727 3.2 K
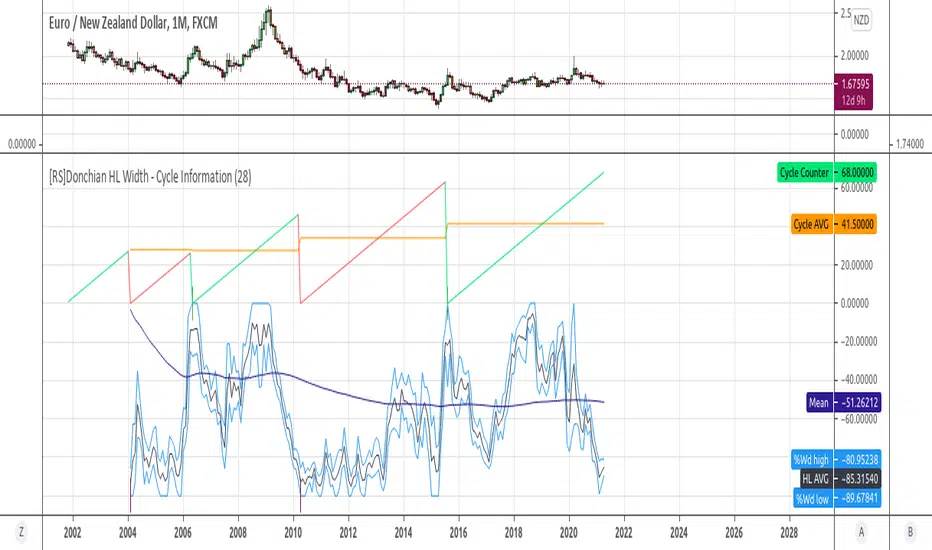
[RS]Donchian HL Width - Cycle InformationExperimental: some information on cyclical new peaks using Donchian Channel % Widths.Pine Script®指標由RicardoSantos提供已更新 1919798
Stochastic Weights - Basic [BigBitsIO]This script is a compilation of several different stochastic indicators (and RSI) where the K value of each indicator is equally weighted. The purpose of the indicator is to combine many indicators together in a fashion that weights them easier. By default, the Stochastic and Stochastic RSI are both enabled - the idea is to speed up the relatively slower Stochastic and to slow down the relatively fast Stochastic RSI. Other Stochastics are also available, including some of my own custom calculations that can also be added to the weighted calculation. Only the K value is weighted, as the D value is just a moving average of the weighted K. Explained: - Calculates enabled indicators - Calculates the weighted value of K for enabled indicators - Calculates a D value from the weighted K FAQ: - Why is this script useful? - To weight multiple indicators together so that you can attempt to find optimal values shared amongst the indicators. Ex: If Stochastic RSI is 100 and Stochastic is 50, K would be 75 and not particularly high. If you add in a 50 RSI, the K would be 67 in this example. If we weight indicators together that all have a high value they could potentially help find elements that align together to produce a stronger signal. DISCLAIMER: For educational and entertainment purposes only. Nothing in this content should be interpreted as financial advice or a recommendation to buy or sell any sort of security or investment including all types of crypto. DYOR, TYOB.Pine Script®指標由BigBitsIO提供已更新 66519
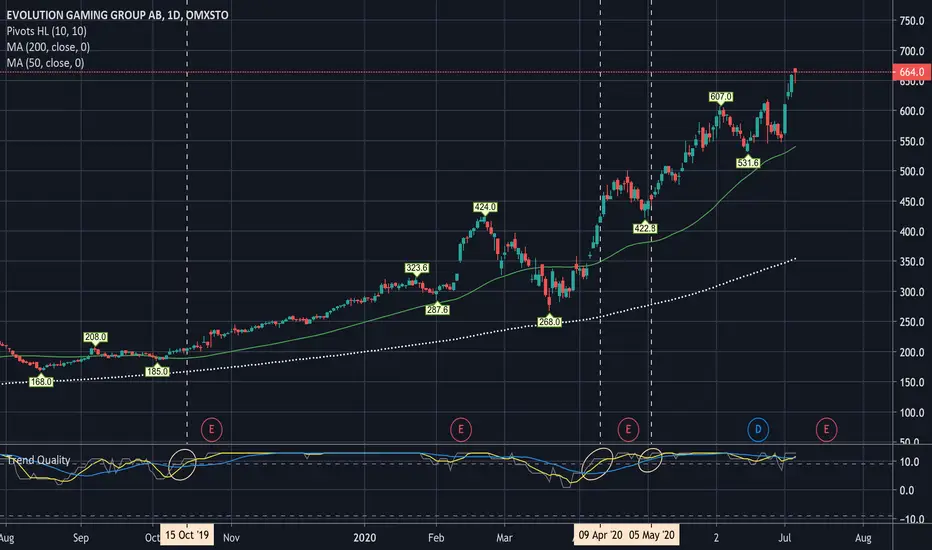
Trend QualityThe quality of the current trend is calculated by adding or subtracting one point to the total value depending on the following criteras: 1. EMA-8, MA-20, MA-50, MA-100, MA-200 , each get a point if they are increasing. 2. EMA-8 > MA-20 > MA-20 > MA-50 > MA-100 > MA-200 , each condition that is true gets one point. On top of the Trend Quality value we apply a "weekly" (5 periods) and a "monthly" (22 periods) moving average. When above a value of 5, a strong trend is indicated and hence a trend following strategy should be used. Use this to Buy when bouncing back from e.g MA-20 or a confirming consolidation/candlestick/trendline pattern. When the trend decreases below Zero a trend shift may have occured. Idea, curtesy: Tobbe RosènPine Script®指標由kruskakli提供已更新 1616 2.2 K
SwingArm ATR Trend IndicatorThe general idea of using SwingArms is to provide a visual confirmation of a trend change. Green for bullish (BUY) Red for bearish (SELL) A color-coded system providing an easy way for a novice to understand. Converted to TradingView based on the work of Jose Azcarate. I hope you guys enjoy.Pine Script®指標由vsnfnd提供101101 6.6 K
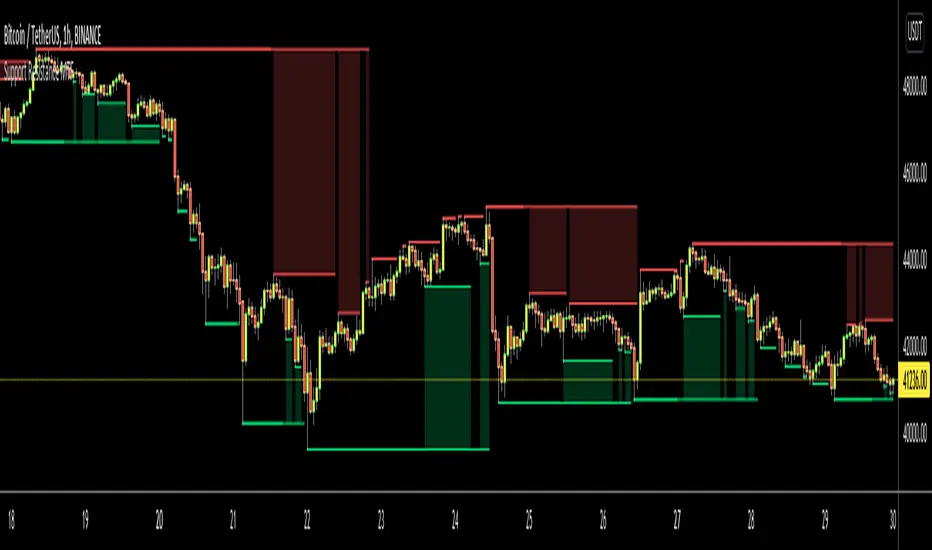
Support Resistance MTFHello Traders, This is Support Resistance script that uses Multi Time Frame. While getting Close/Open/High/Low values of Higher Time Frames the script does NOT use Security function , instead it calculates them. while choosing Higher Time Frame, you can use "Auto" option so it uses predefined Higher Time Frames, or you can choose the Higher Time Frame Manually from the list. options for HTF => 15mins, 30mins, 60mins, 120mins, 180mins, 240mins, 720mins, Day, Week, 2 Weeks, Months, 3 Months, 6 Months, 12 Months. You have option to use High/Low or Close/Open values while calculating support resistance levels. "Period for Highest/Lowest Bars" option is used as loopback period to check if it's Highest/lowest bars. smaller numbers = more sensitive result. You have option for transparency and coloring of support/resistance levels/zone => Red, Lime, Blue, White, Black, Olive, Gray An example for 15 min chart, 4hours selected as HTF You can set transparency and colors as you wish: You can choose Close/Open prices while calculating S/R levels instead of High/Low Enjoy!Pine Script®指標由LonesomeTheBlue提供已更新 103103 10.1 K
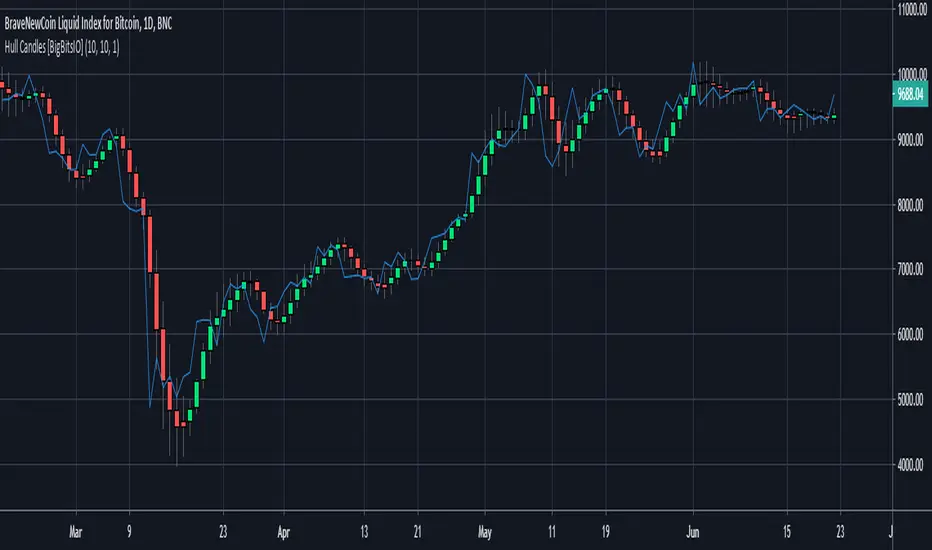
Hull Candles [BigBitsIO]This script is for custom candles based on an HMA calculation with a default period of 10 as well as an SMA of the close price, defaulted to 1 period to only show the current price. The purpose of the custom candles is to try and reduce noise from candles and help identify trends. These custom candles somewhat resemble Heikin-Ashi candles in their appearance. Explained: - Open, High, Low and Close (o, h, l, and c) are all calculated using an HMA calculation based on a user input length/period, defaulted at 10. - Candle colors are determined by using the same HMA calculation on the ohcl4 and comparing it to the previous candle. Green candles have an ohlc4 greater than the previous candle, all other candles are red. - The current price is plotted with the default blue line with an SMA calculation with 1 period to allow customization of smoothing if necessary to identify trends. DISCLAIMER: For educational and entertainment purposes only. Nothing in this content should be interpreted as financial advice or a recommendation to buy or sell any sort of security or investment including all types of crypto. DYOR, TYOB.Pine Script®指標由BigBitsIO提供已更新 3939 2.3 K
VAMA Volume Adjusted Moving Average FunctionThis indicator is a live analysis adaptation of Richard Arms' Volume Adjusted Moving Average coded as a single function. VAMA utilizes a period length that is based on volume increments rather than time. Settings are provided for using as a pair of fast and slow moving averages. • SampleN - N volume bars used as sample to calculate average volume , 0 equals all bars. • VAMA Source - Price used for volume weighted calculations. • VAMA Length - Specified number of volume ratio buckets to be reached. • VAMA VI Fct - Size of volume ratio buckets. • VAMA Strict - Must meet desired volume requirements, even if number of bars has to exceed VAMA Length to do it. Please see previous published example here for more details on VAMA's usage and inability to redraw the past on time based charts. NOTICE: This is an example script and not meant to be used as an actual strategy. By using this script or any portion thereof, you acknowledge that you have read and understood that this is for research purposes only and I am not responsible for any financial losses you may incur by using this script!Pine Script®指標由allanster提供已更新 3636 3 K
Funamental and financialsEarnings and Quarterly reporting and fundamental data at a glance. A study of the financial data available by the "financial" functions in pinescript/tradingview As far as I know, this script is unique. I found very few public examples of scripts using the fundamental data. and none that attempt to make the data available in a useful form as an indicator / chart data. The only fitting category when publishing would be "trend analysis" We are going to look at the trend of the quarterly reports. The intent is to create an indicator that instantly show the financial health of a company, and the trends in debt, cash and earnings Normal settings displays all information on a per share basis, and should be viewed on a Daily chart Percentage of market valuation can be used to compare fundamentals to current share price. And actual to show the full numbers for verification with quarterly reporting and debuggging (actual is divided by 1.000.000 to keep numbers readable) Credits to research study by Alex Orekhov (everget) for the Symbol Info Helper script without it this would still be an unpublished mess, the use of textboxes allow me to remove many squiggly plot lines of fundamental data Known problems and annoyances 1. Takes a long time to load. probably the amount of financial calls is the culprit. AFAIK not something i can to anything about in the script. 2. Textboxes crowd each other. dirty fix with hardcoded offsets. perhaps a few label offset options in the settings would do? 3. Only a faint idea of how to put text boxes on every quarter. Need time... (pun intended) Have fun, and if you make significant improvements on this, please publish, or atleast leave a comment or message so I can consider adding it to this script. © sjakk 2020-june-08Pine Script®指標由sjakk提供已更新 1919630
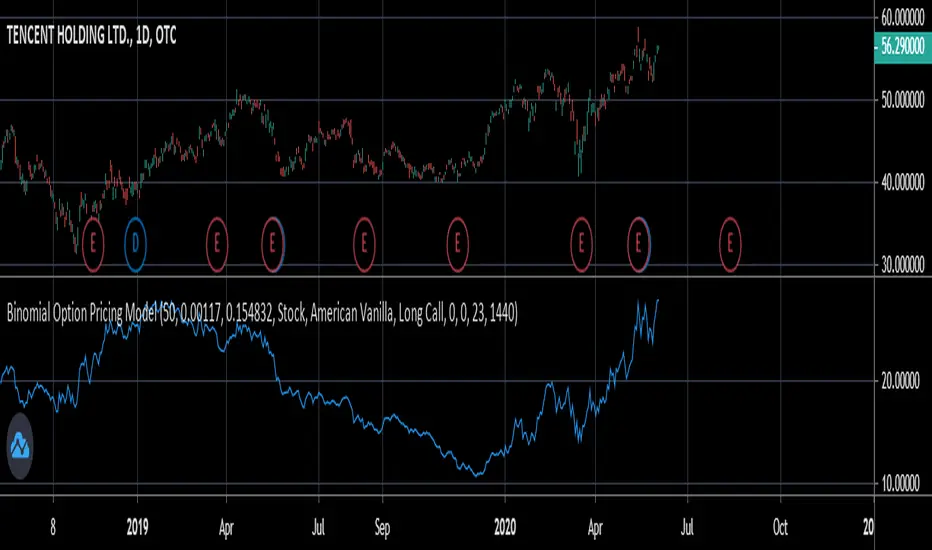
Binomial Option Pricing ModelA binomial option pricing model is an option pricing model that calculates an option's price using binomial trees. The BOPM method of calculating option prices is different from the Black-Scholes Model because it provides more flexibility in the type of options you want to price. The BOPM, unlike the BS model typically used for European style options, allows you to price options which have the ability to exercise early, such as American or Bermudan options. Although you can use the BOPM for any option style. This specific model allows you to price both American and European vanilla options. The way the BOPM calculates option prices is by: First, dividing up the time until expiry into equal parts called steps. This specific model presented only uses 2 steps. For example, say you have an option with an expiry of 60 days, and your binomial tree has only two steps. Then each step will contain 30 days. Second, the model will project the expected price of the underlying at the end of each step, called a node. The expected price is calculated by using the underlying's volatility and projecting what the price of the underlying would be if it were to rise and fall. This step is repeated until the terminal node, aka the end of the tree, is reached. Third, once the terminal node's expected underlying prices are calculated, their expected option prices must be calculated. Finally, after calculating the terminal option prices, backwards induction must be used to calculate the option prices at the previous nodes, until you reach Node 0, aka the current option price. In order to use this model: 1st. Enter your option's strike price. 2nd. Enter the risk-free-rate of the currency the option is based in. 3rd. Enter the dividend yield of the underlying if it's a stock, or the foreign risk-free-rate if it's an FX option. *For example, if you were trading an AAPL stock option, in the risk-free-rate box mentioned in step 2, you would enter the US risk-free-rate because AAPL options are traded in US dollars. In the dividend yield box mentioned in step 3, you would enter the stock's dividend yield, which for AAPL is 0.82. *If you were, for example, trading an option on the EUR/JPY currency pair, the risk-free-rate mentioned in step 2, would be the Japanese risk-free-rate. Then in the the dividend yield box from step 3, you'd input the Eurozone risk-free-rate. *If you were trading an options on futures contract, the risk-free-rate mentioned in step 2, would be the risk-free-rate for whatever currency the futures contract is denominated in. For example EUR futures are denominated in USD, so you would input the US risk-free-rate. Meanwhile, something like FTSE futures are denominated in GBP, so you would input the British risk-free-rate. As for the dividend yield box mentioned in step 3, for all options on futures, enter 0. 4th. Pick what type of underlying the option is based on: stock, FX, or futures. 5th. Pick the style of option: American or European. 6th. Pick the type of option: Long Call or Long Put. 7th. Input your time until expiry. You can express this in terms of days, hours, and minutes. 8th. Lastly, input your chart time-frame in term of minutes. For example, if you're using the 1 min time-frame enter 1, 4hr time-frame enter 480, daily time-frame enter 1440. *Disclaimer, because this particular model only uses 2 steps, it won't work on stocks with high prices (over $100). If you want to use this on stocks with prices greater than $100, you would need to add more steps to the code, shown below. The model in its current form should work for stocks below $100.Pine Script®指標由SegaRKO提供77365
Bayesian BBSMA OscillatorSometime ago (very long ago), one of my tinkering project was to do a spam or ham classification type app to filter news I'd wanna read. So I built myself a Naive Bayes Classifier to feed me my relevant articles. It worked great, I can cut through the noise. The hassle was I needed to manually train it to understand what I wanna read. I trained it using 50 articles and to my surprise, it's enough. Complexity Theory I've been reading a book called The Road to Ruin by Jim Rickards. He described how he got to his conclusion of how the stock market works by using Complexity Theory. Bill Williams would agree. Jim tells us that by using just enough data, we calculate the probability of an event to occur. We can't say for sure when but we know it's coming. This was my light bulb moment. While Jim talks much about Bayesian Inference in which a probability of an event can always be updated as more evidence comes to light, I had my eyes set on binary probabilities of when prices are going up and down. Assumptions These are my assumptions: Prices breaking up a Bollinger basis line will have fuel to go up even higher Prices will go down when prices have broken up a Bollinger upper band Scalping is the main method so we should use a lower period Moving Average (MA) When prices are above MA, it's likelier a correction to the downside is imminent When prices are below MA, it's likelier a correction to the upside is imminent Optimize parameters for 1 hour timeframe which will give us time to react while still having more opportunities to trade Building Blocks Jim Rickards started with limited data (events) while in technical trading, data are plentiful. I decided to classify 2 events which are: Next candles would be breaking up Next candles would be breaking down Key facts: We won't know for sure when prices are going to break We won't know for sure how much the prices movements are going to be Formulas Breaking up: Pr(Up|Indicator) = Pr(Indicator|Up) * Pr(Up) / Pr(Indicator|Up) * Pr(Up) + Pr(Indicator|Down) * Pr(Down) Breaking down: Pr(Down|Indicator) = Pr(Indicator|Down) * Pr(Down) / Pr(Indicator|Down) * Pr(Down) + Pr(Indicator|Up) * Pr(Up) Reading The Oscillator Green is the probability of prices breaking up Red is the probability of prices breaking down When either green or red is flatlining ceiling, immediately on the next candle when the probability decreases go short or long based on which direction you're observing - Strong Signal When either green or red is flatlining ceiling, take no action while it's ceiled Usually when either green or red is flatlining bottom, the next candle when the probability increases, immediately take a short long position based on the direction you're observing - Weak Signal When either green or red is flatlining bottom, take no action while it's bottomed Alerts Use Once per Bar option when generating alerts.Pine Script®指標由tista提供已更新 3737 1.4 K
BTC difficulty adjustmentsDraws background columns indicating BTC difficulty adjustments Green = positive adjustments Red = negative adjustments Use Threshold mode and Threshold to look for adjustments larger or equal to Threshold value Use on DAILY timeframePine Script®指標由BTC_JackSparrow提供44248
Time Range StatisticsA good amount of users requested a text box showing various price statistics, the following script returns various of these stats in a user-selected range, and include classical ones such as a central tendency measurement (mean), dispersion (normalized range) and percent change, but also include less common statistics such as average traded volume and number of gaps. The script also calculates the correlation between the closing price and another user-selected instrument. The script is currently the longest one I ever made and took some efforts, as I wasn't satisfied with the statistics to be originally included. Big thx to Gael for the enormous feedback and the idea of the normalized range, to user @Cookiecrush for the feedback ( without ya I would have posted something bad you know umu ? ), and Lulidolce for the support, friendship is magic! Selected Range The setting Start determine the bar at which the range starts, while End determine at which bar the range end. To help you select these values, the current bar number (bar index) is displayed at the right of the indicator title in blue. The setting evaluate to last bar will use a range starting at Start and ending at the last bar, as such you can use a full range by using Start = 0 and select evaluate to last bar The range is highlighted by an area on the chart. By default Start = 9000 and End = 10000, you might not have this amount of data in your chart, as such use the displayed bar index to select Start and End, then set the settings as default. Displayed Statistics The statistics panel is displayed on the right side of the last bar, the panel has 3 sections, a title section who shows the symbol ticker, timeframe, and overall trends represented by a chart emoji, the overall trends are determined by comparing the number of higher highs with the number of lower low. Below are displayed the date ranges with time format: year/month/day/hour:minute. The second section shows the general statistics. The first one is the mean, also represented by the orange line in the chart, the blue line displayed represent the highest price value in the range, while the red one represents the lowest price value. The second stat is the normalized range, and determine how spread is the price in the user-selected range, why not the standard deviation? Because the standard deviation might return results varying widely depending on the scale of the closing price, you could get measures such as 0.0156 or 16 or even 56 depending on the instrument, as such using a normalized range can be more appropriate as it lays in a range of (0,1). Lower values indicate a low degree of price variation. Note that I still want to find another measure in the future. The percentage change (or relative change) indicates at which percentage the price has increased or decreased, and is calculated by subtracting the closing at bar Start with the price at bar End , divided by the price at bar End , the result is then multiplied by 100. The average traded volume calculate the mean of the volume in the selected range, I used the same format used by the original volume indicator for clarity. Finally, the last stats of the section is the number of gaps, this stat is by default hidden. An up gap is detected when the open price is superior to the previous high, while a down gap is detected when the open price is inferior to the previous low, this allow to only retain significant gaps. The last section of the indicator panel shows the correlation between the closing price and another instrument, by default GOOG, this correlation is also calculated within the user-selected range. Positive values indicate a positive relationship, that is the two instruments tend to move in the same direction. Negative values indicate a negative relationship, both instruments tend to move in a direction opposite to each other. Values closer to 1 or -1 indicate a stronger relationship, while values closer to 0 indicate no relationship. In Summary The script shows various stats, each calculated within a user-selected range, in general one would be more interested in how these stats might evolve with time, but checking them in a custom range can be quite interesting. Thx for reading. umu Pine Script®指標由alexgrover提供已更新 1616 1.1 K
ATR Based Trendlines - JDThis script draws trendlines from the pivot points in the price chart. The angle of the trendlines is determined by (a percentage of) the atr. The angle follows the change in price, dictated by the atr at the moment where the pivot point is detected. The atr percentage determines if the trendline follows the rate of change of the atr or a fraction ( value < 100) or a multiple ( value > 100) of that JD. #NotTradingAdvice #DYOR Disclaimer. I AM NOT A FINANCIAL ADVISOR. THESE IDEAS ARE NOT ADVICE AND ARE FOR EDUCATION PURPOSES ONLY. ALWAYS DO YOUR OWN RESEARCH!Pine Script®指標由Duyck提供1818 2.6 K
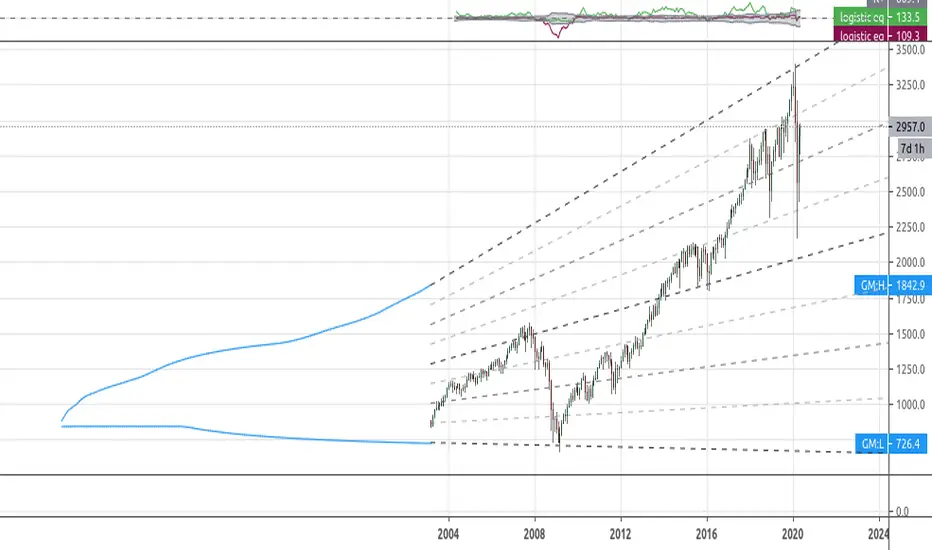
[RS]Simplistic Automatic Growth ModelsExperimental: Automatic growth model generated from history.. note: you may need to scroll back to 1st bar to load data.Pine Script®指標由RicardoSantos提供已更新 1212632