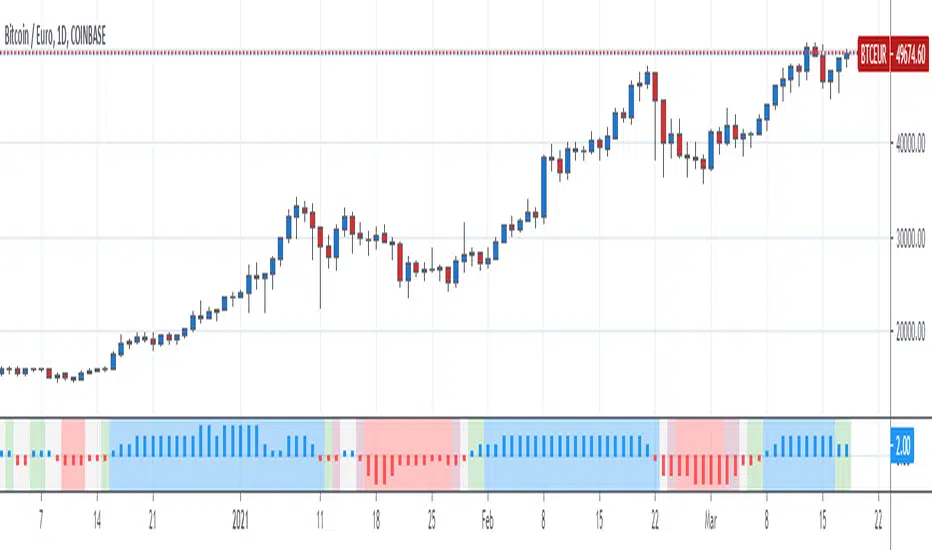
[SK] Fibonacci Auto Trend ScouterThe FATS - Fibonacci Auto Trend Scouter automatically draws active trends from 2 different timeframes along with Fibonacci Support and Resistance levels. It also has a Sights feature for each timeframe which points from it's middle towards the current price. The tool is also highly customizable for you to take this indicator over 9000. If you like the tool and it adds value to you - share the love on the like button and visit my profile to check out my other indicators and subscribe, so you'r
指標和策略
Faith IndicatorThis indicator compares buyers demand with sellers supply volumes and calculates which prevails. Therefore it only works if volume is published. Buyers demand is assumed for a period in which a higher high is reached with more volume. Sellers supply is recognized by a lower low combined with more volume.
The average of sellers supplies is subtracted from buyers demand, the result is graded because a statement like “The faith in this period was ## percent” has no meaning. We can conclude to more
Hurst ExponentMy first try to implement Full Hurst Exponent.
The Hurst exponent is used as a measure of long-term memory of time series. It relates to the autocorrelations of the time series and the rate at which these decrease as the lag between pairs of values increases
The Hurst exponent is referred to as the "index of dependence" or "index of long-range dependence". It quantifies the relative tendency of a time series either to regress strongly to the mean or to cluster in a direction.
In short, depen
P-Square - Estimation of the Nth percentile of a seriesEstimation of the Nth percentile of a series
When working with built-in functions in TradingView we have to limit our length parameters to max 4999. In case we want to use a function on the whole available series (bar 0 all the way to the current bar), we can usually not do this without manually creating these calculations in our code. For things like mean or standard deviation, this is quite trivial, but for things like percentiles, this is usually very costly. In more complex scripts, this be
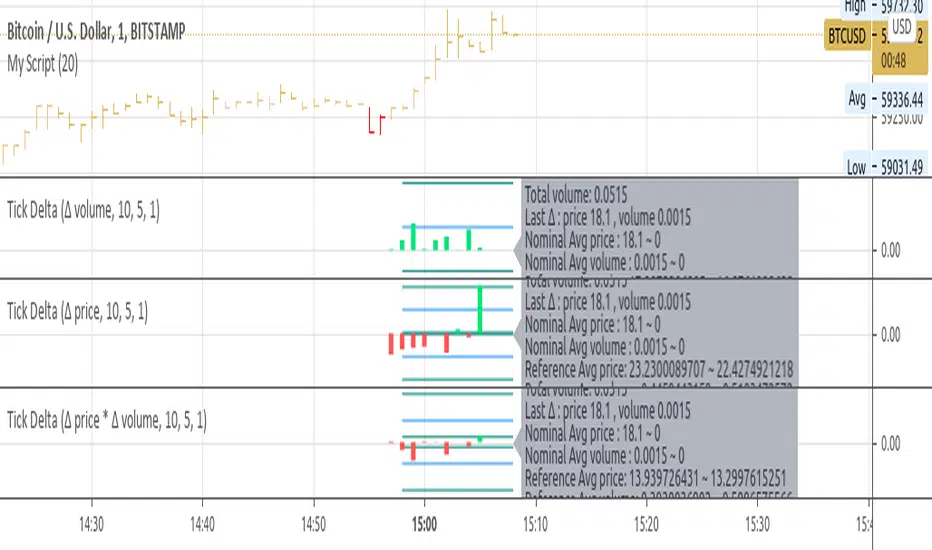
Tick Delta VolumeExperimental:
this script only works on live updating bars(market open and live), the longer it runs the more accurate it will be.
displays:
- total intrabar volume processed(may not be equal to volume).
- last delta tick change in volume.
- this bar delta avg and stdev per tick.
- a overall of all live candles processed avg and stdev of the deltas processed.
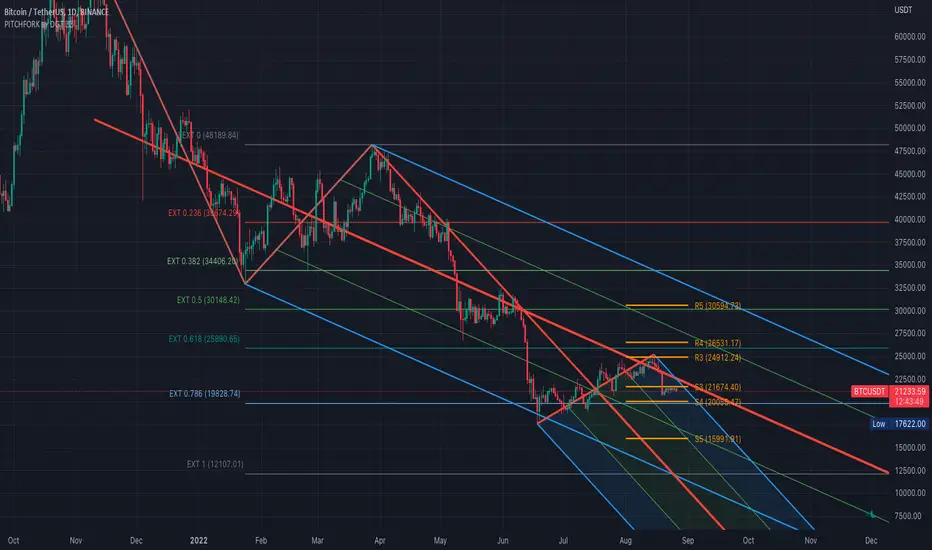
Auto Pitchfork, Fib Retracement and Zig Zag by DGTPitchfork is a technical indicator for a quick and easy way for traders to identify possible levels of support and resistance of an asset's price. It is presents and based on the idea that the market is geometric and cyclical in nature
Developed by Alan Andrews, so sometimes called Andrews’ Pitchfork
It is created by placing three points at the end of previous trends
Schiff and Modified Pitchfork is a technical analysis tool derived from Andrews' Pitchfork
In general, traders w
RedK Trader Pressure Index (TPX v1.0) Quick Summary
---------------------
The RedK Trader Pressure Index (REDK_TPX) analyzes the changes in price bars to give the trader a clear visual insight that represents the ongoing fight between the bulls (buyers) and bears (sellers) in the market - to determine who is in control of the price action, which in turn can be helpful in a trader’s decision about how the price action may be unfolding, what type of trade and positions to take (or to close) and when is the ideal time to action.
How t
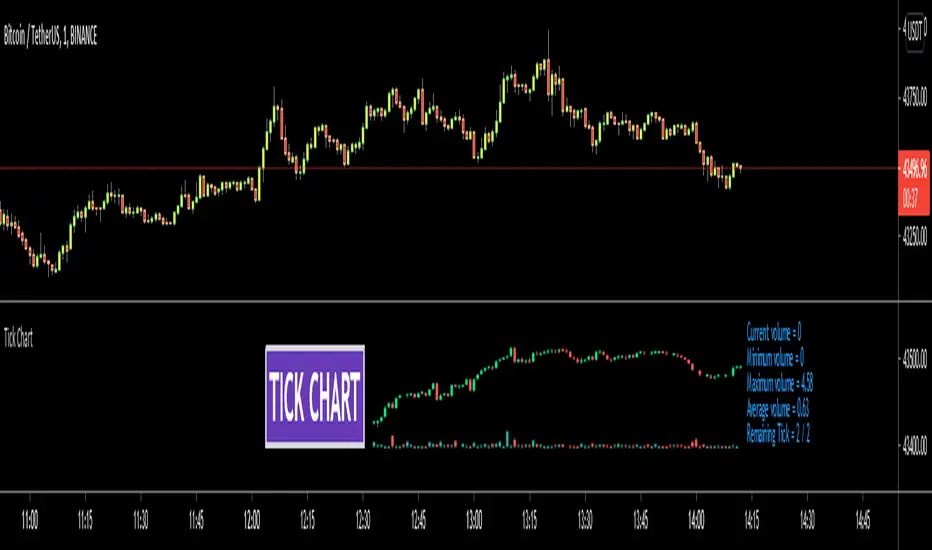
Tick ChartHello All,
Tick Chart is created using ticks and each candlestick in Tick Chart shows the price variation of X consecutive ticks ( X : Number of Ticks Per Candle ). for example if you set Number of Ticks Per Candle = 100 then each candlestick is created using 100 ticks. so, Tick Charts are NOT time-based charts (like Renko or Point & Figure Charts). Tick is the price change in minimum time interval defined in the platform. There are several advantages of Tick Charts. You can find many article
Matrix Library (Linear Algebra, incl Multiple Linear Regression)What's this all about?
Ever since 1D arrays were added to Pine Script, many wonderful new opportunities have opened up. There has been a few implementations of matrices and matrix math (most notably by TradingView-user tbiktag in his recent Moving Regression script: ). However, so far, no comprehensive libraries for matrix math and linear algebra has been developed. This script aims to change that.
I'm not math expert, but I like learning new things, so I took it upon myself to relearn linear
Monte Carlo Range Forecast [DW]This is an experimental study designed to forecast the range of price movement from a specified starting point using a Monte Carlo simulation.
Monte Carlo experiments are a broad class of computational algorithms that utilize random sampling to derive real world numerical results.
These types of algorithms have a number of applications in numerous fields of study including physics, engineering, behavioral sciences, climate forecasting, computer graphics, gaming AI, mathematics, and finance.
Alt
Monte Carlo Simulation - Random WalkHello All,
Monte Carlo Simulation is a model used to predict the probability of different outcomes when the intervention of random variables is present. it is used by professionals in such widely disparate fields as finance, project management etc. You can find many articles about Monte Carlo Simulation on the net.
In this script I tried to make Monte Carlo Simulation and "Random Walk". it calculates results over and over, each time using a different set of random values that is created usin
Multi Time Frame Candles with Volume Info / 3DHello Traders,
This is my second Multi Time Frame Candles script but with this new one, you will have some new features such volume info, remaining time to close of higher time frame candle and also developed using new features of Pine such array of lines. also I tried to make it 3D for better visualization ;) also it shows new highs/lows / breakouts.
I tried to make many things optional, so you can change almost everything using options.
What you can change using options:
- Hig
Donchian Zig-Zag [LuxAlgo]The following indicator returns a line bouncing of the extremities of a Donchian channel, with the aim of replicating a "zig-zag" indicator. The indicator can both be lagging or lagging depending on the settings user uses.
Various extended lines are displayed in order to see if the peaks and troughs made by the Donchian zig-zag can act as potential support/resistance lines.
User Settings
Length : Period of the Donchian channel indicator, higher values will return fewer changes of directi
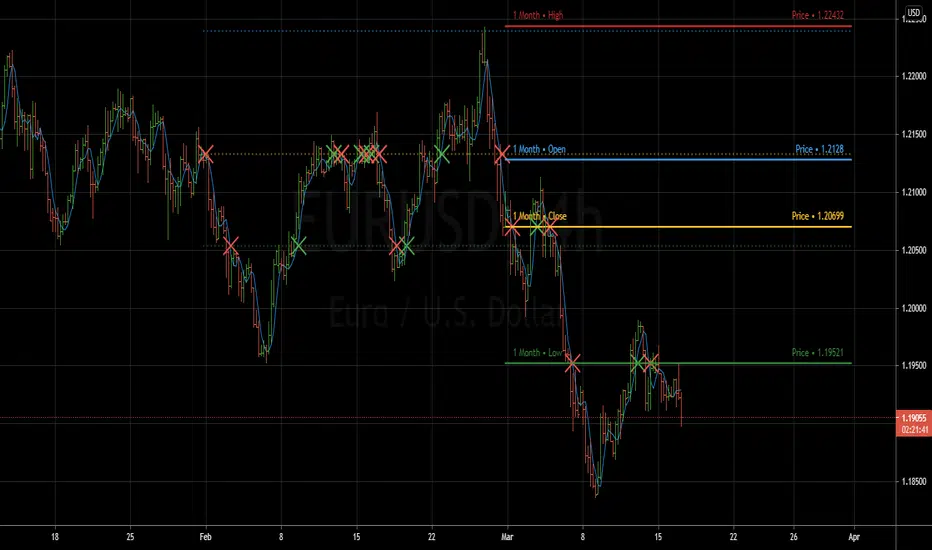
Previous Period Levels - X Alerts====== ABOUT THIS INDICATOR
- A simple but highly customisable display of previous higher time-frame
OHLC values, drawn using line.new and label.new. Nothing fancy but...
- Customised resolution input which excludes time frames lower than 1 hour
while extending the common higher reference inputs to include:
• 6, and 12 Hour
• 5 Day
• 3, and 6 Month
• 1 Year
- Alert conditions using an adjustable SMA to help reduce false positive
spam.
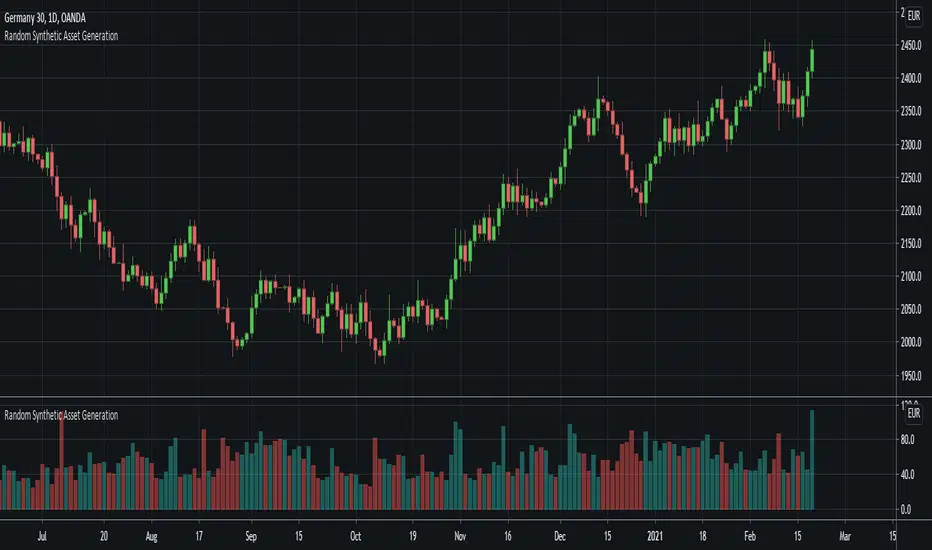
Random Synthetic Asset GenerationThis script generates pseudo-random asset data . Due to the nature of the random generator, it is impossible to use this indicator as input for other indicators because the instance of the script that the indicator is applied to will automatically be different from the instance that is plotted on the chart. Therefore, the idea is to use this script in other scripts (to make it possible to backtest on random data, for example).
The script has four main input parameters.
Random Number Gener
Oscillator Evaluator (Analysis tool)Oscillator Evaluator (Analysis tool)
The oscillator evaluator is a tool that will help you analyse and compare the oscillator of your choice to another 2 oscillators.
By selecting the strategy with which you will analyze the oscillators, you will be able to see the behaviour of the oscillators in different aspects.
First there is a moving average increase or decrease strategy, that will give you a good idea of the correlation of the oscillator with the price.
The second is a commom 2 MA cro
MTF seconds values - JDAdd MTF capabilities to "seconds" timeframes!!
This script is not intended to be used as an indicator but gives you a workaround to solve the missing seconds MTF capabilities.
The "resolution" function in Pinescript doesn't allow for seconds values to be put in MTF
So I wrote a little helper code with arrays to get MTF on seconds timeframes.
If you want to add MTF in minutes, hours,... you can always add ' resolution = "" ' to the study line of the script
With these arrays of MTF v
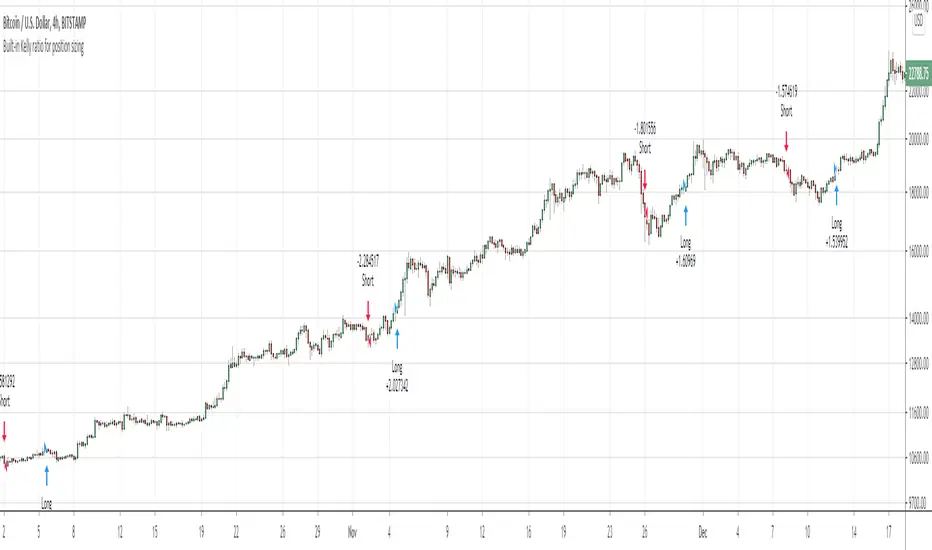
Built-in Kelly ratio for dynamic position sizingThis is the defaut keltners channel strategy with a few additions.
The main purpose is to show how we include the Kelly ratio into our scripts for dynamic position sizing based on the performance of the strategy on a per trade basis.
We've also included the usual take-profit and stop-loss parameters in the event you want to play a little :)
We hope this helps you advance your personal system.
Happy Trading!
Moving Regression Prediction BandsIntroducing the Moving Regression Prediction Bands indicator.
Here I aimed to combine the principles of traditional band indicators (such as Bollinger Bands), regression channel and outlier detection methods. Its upper and lower bands define an interval in which the current price was expected to fall with a prescribed probability, as predicted by the previous-step result of the local polynomial regression (for the original Moving Regression script, see link below).
Algorithm
1. At eve
Anti-Volume Stop LossFINALLY!
As everyone who tried to create, understand, or even find the Buff Pelz Dormeier Anti-volume stop-loss indicator knows that - it's not easy. Personally, I have partially, or perhaps completely figured out, the tips Buff had given in Investing with Volume Analysis book.
AVSL now is ready.
Please do some test and give me a feedback how it works in your trade strategy.
Anti-Volume stop loss - AVSL
from Investing with Volume Analysis book CHAPTER 20 • RISKY BUSINESS 253-256:
"It is imp
Ultimate Strategy TemplateHello Traders
As most of you know, I'm a member of the PineCoders community and I sometimes take freelance pine coding jobs for TradingView users.
Off the top of my head, users often want to:
- convert an indicator into a strategy, so as to get the backtesting statistics from TradingView
- add alerts to their indicator/strategy
- develop a generic strategy template which can be plugged into (almost) any indicator
My gift for the community today is my Ultimate Strategy Template
Step 1
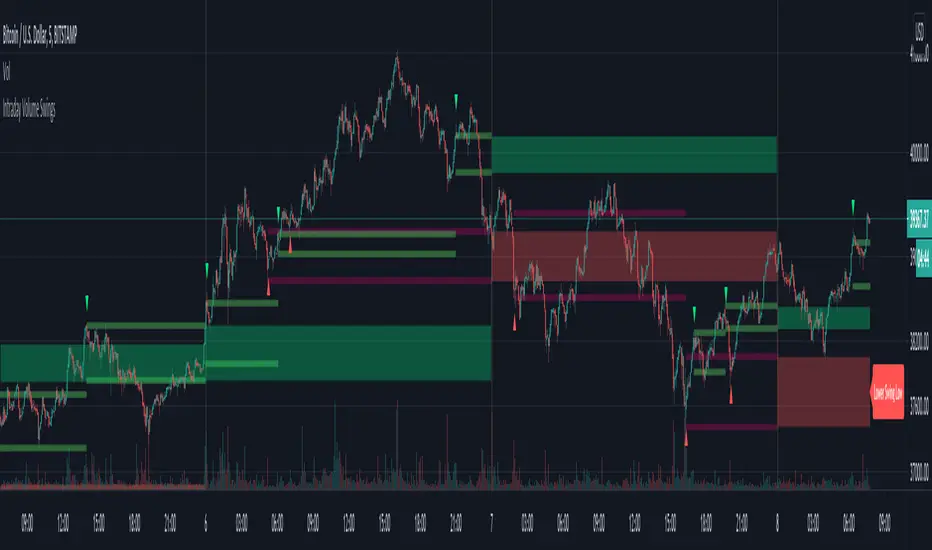
Intraday Volume SwingsVolume swings are defined as increasing volume and higher highs/lower lows over a minimum of three bars.
This script tracks volume swings over an intraday chart and stores the final lowest low swing / highest high swing over the course of the day. The final high swing and low swing are then plotted over the following day as possible retracement / support & resistance levels.
Intraday levels for the current day can also be displayed, which may or may not be the final swings for the day, but are
Max Drawdown Calculating Functions (Optimized)Maximum Drawdown and Maximum Relative Drawdown% calculating functions.
I needed a way to calculate the maxDD% of a serie of datas from an array (the different values of my balance account). I didn't find any builtin pinescript way to do it, so here it is.
There are 2 algorithms to calculate maxDD and relative maxDD%, one non optimized needs n*(n - 1)/2 comparisons for a collection of n datas, the other one only needs n-1 comparisons.
In the example we calculate the maxDDs of the last 10 close
Delta-RSI Oscillator StrategyDelta-RSI Oscillator Strategy:
This strategy illustrates the use of the recently published Delta-RSI Oscillator as a stand-alone indicator.
Delta-RSI represents a smoothed time derivative of the RSI, plotted as a histogram and serving as a momentum indicator.
There are three optional conditions to generate trading signals (set separately for Buy, Sell and Exit signals):
Zero-crossing : bullish when D-RSI crosses zero from negative to positive values (bearish otherwise)
Signal Line Crossin