Full Floating Dashboard YUJiDisplay information on top right corner. Info shown: High and Low Current Price 24 Hour Change Pine Script®指標由YUJi9613提供13
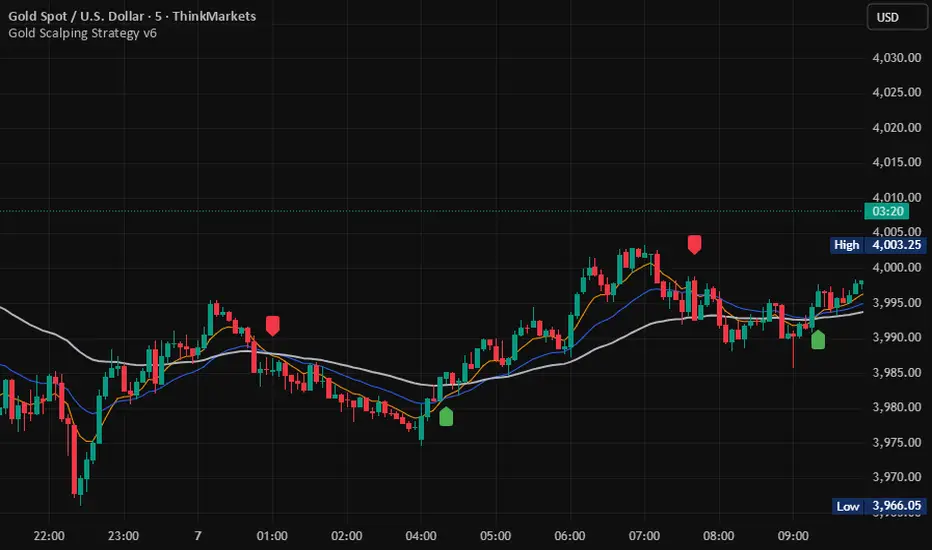
SSL Hybrid ScalperIt's a ready to trade script V5, that takes the original SSL Hybrid logic and optimizes it for XAUUSD scalping on 1min to 15min charts for buy & sell signals.Pine Script®指標由nabeel8369提供已更新 161
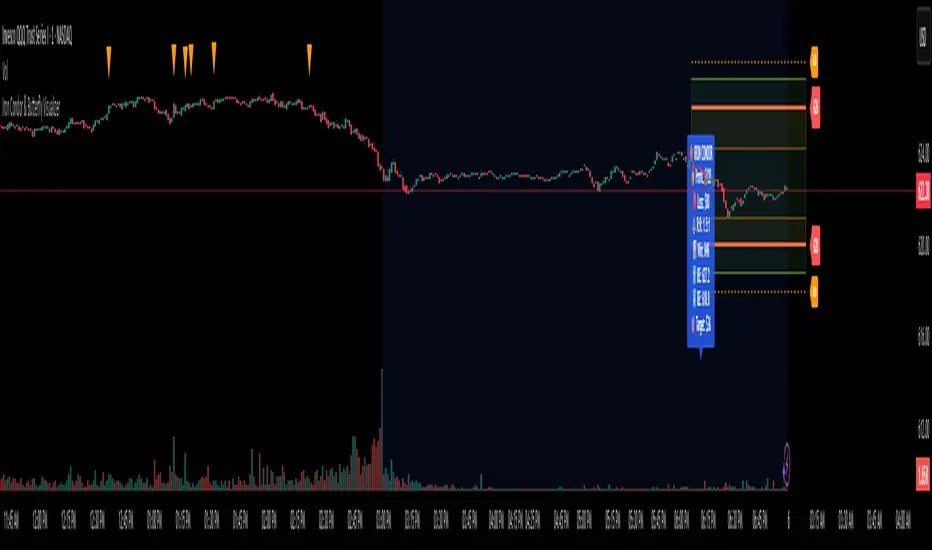
Iron Condor & Butterfly VisualizerIt helps you visualize and manage your option spread by: Plotting strike prices and breakeven lines directly on the chart. Showing profit/loss zones, adjustment zones, and alerts when price nears critical levels. Calculating risk/reward, probability of profit, theta decay, IV condition, and trade score. 🎯 2. Inputs & Configuration You input your trade details as a comma-separated string: For an Iron Condor ShortCall, LongCall, ShortPut, LongPut, Credit, Contracts, Target% Example: 626,628,620,618,1.20,1,30 For a Butterfly Spread LowerWing, Body, UpperWing, Debit, Contracts, Target% Example: 600,620,640,2.50,2,50 The indicator automatically parses this and knows which strategy type you selected. You can also control: Visuals (profit zones, breakevens, labels) Risk (stop loss %, adjustment zones) Account/risk sizing Market conditions (IV Rank, current IV, DTE) ⚙️ 3. Data Parsing & Strategy Recognition The code reads your pasted string, splits it by commas, and determines: Which strikes are short vs long (or wings/body for Butterfly) Whether the strategy is credit (Iron Condor) or debit (Butterfly) Calculates net credit/debit, contract size, and profit target 📈 4. Profit/Loss Calculations It dynamically calculates: Max Profit Iron Condor: net credit × 100 × contracts Butterfly: (wing width − debit) × 100 × contracts Max Loss Iron Condor: difference between strikes minus credit Butterfly: debit × 100 × contracts Breakeven points Iron Condor: short strikes ± net credit Butterfly: body ± debit Current P&L relative to the live price (close). ⚖️ 5. Risk & Position Sizing It checks: Stop-loss trigger (% of max loss) Adjustment alert if price nears short strikes Recommended contract size based on account size and % risk per trade Actual % of account at risk ⏱️ 6. Time Decay & IV Analysis If you input days to expiration, it shows: Theta (approx daily time decay) Decay progress bar (% of 30-day cycle) IV condition: Green: favorable (>50 IV Rank) Yellow: neutral (30–50) Red: poor (<30) 🧮 7. Trade Scoring It gives a Trade Score (0–100) based on: IV Rank (favorable market) Risk/Reward ratio Probability of profit Default 20 baseline points This helps gauge whether the setup is statistically attractive. 🧠 8. Visualizations When the indicator runs, it draws on your chart: Lines Red = short strikes Orange dashed = long strikes Yellow dotted = breakeven levels Boxes Green = profit zone Orange shaded = adjustment zones (approaching danger) Labels (optional) Strike labels (call/put prices) Info box summarizing: Profit, loss, risk/reward Breakevens, theta, target, gamma risk flag 🚨 9. Alerts The script triggers TradingView alerts when: Price nears call or put adjustment zones Profit target is hit Stop loss is hit These help you manage the trade without constant monitoring. 🧭 10. In Practice You’d: Copy the option strikes and trade details from your broker or analyzer. Paste them into 📋 PASTE YOUR TRADE DATA HERE. The indicator plots: Profit/loss region Adjustment warnings Key metrics Alerts if your trade is in danger or near target.Pine Script®指標由day_trade_mind提供35
Risk & Position DashboardRisk & Position Dashboard Overview The Risk & Position Dashboard is a comprehensive trading tool designed to help traders calculate optimal position sizes, manage risk, and visualize potential profit/loss scenarios before entering trades. This indicator provides real-time calculations for position sizing based on account size, risk percentage, and stop-loss levels, while displaying multiple take-profit targets with customizable risk-reward ratios. Key Features Position Sizing & Risk Management: Automatic position size calculation based on account size and risk percentage Support for leveraged trading with maximum leverage limits Fractional shares support for brokers that allow partial share trading Real-time fee calculation including entry, stop-loss, and take-profit fees Break-even price calculation including trading fees Multi-Target Profit Management: Support for up to 3 take-profit levels with individual portion allocations Customizable risk-reward ratios for each take-profit target Visual profit/loss zones displayed as colored boxes on the chart Individual profit calculations for each take-profit level Visual Dashboard: Clean, customizable table display showing all key metrics Configurable label positioning and styling options Real-time tracking of whether stop-loss or take-profit levels have been reached Color-coded visual zones for easy identification of risk and reward areas Advanced Configuration: Comprehensive input validation and error handling Support for different chart timeframes and symbols Customizable colors, fonts, and display options Hide/show individual data fields for personalized dashboard views How to Use Set Account Parameters: Configure your account size, maximum risk percentage per trade, and trading fees in the "Account Settings" section. Define Trade Setup: Use the "Entry" time picker to select your entry point on the chart, then input your entry price and stop-loss level. Configure Take Profits: Set your desired risk-reward ratios and portion allocations for each take-profit level. The script supports 1-3 take-profit targets. Analyze Results: The dashboard will automatically calculate and display position size, number of shares, potential profits/losses, fees, and break-even levels. Visual Confirmation: Colored boxes on the chart show profit zones (green) and loss zones (red), with lines extending to current price levels. Reset Entry and SL: You can easily reset the entry and stop-loss by clicking the "Reset points..." button from the script's "More" menu. This is useful if you want to quickly clear your current trade setup and start fresh without manually adjusting the points on the chart. Calculations The script performs sophisticated calculations including: Position size based on risk amount and price difference between entry and stop-loss Leverage requirements and position amount calculations Fee-adjusted risk-reward ratios for realistic profit expectations Break-even price including all trading costs Individual profit calculations for partial position closures Detailed Take-Profit Calculation Formula: The take-profit prices are calculated using the following mathematical formula: // Core variables: // risk_amount = account_size * (risk_percentage / 100) // total_risk_per_share = |entry_price - sl_price| + (entry_price * fee%) + (sl_price * fee%) // shares = risk_amount / total_risk_per_share // direction_factor = 1 for long positions, -1 for short positions // Take-profit calculation: net_win = total_risk_per_share * shares * RR_ratio tp_price = (net_win + (direction_factor * entry_price * shares) + (entry_price * fee% * shares)) / (direction_factor * shares - fee% * shares) Step-by-step example for a long position (based on screenshot): Account Size: 2,000 USDT, Risk: 2% = 40 USDT Entry: 102,062.9 USDT, Stop Loss: 102,178.4 USDT, Fee: 0.06% Risk per share: |102,062.9 - 102,178.4| + (102,062.9 × 0.0006) + (102,178.4 × 0.0006) = 115.5 + 61.24 + 61.31 = 238.05 USDT Shares: 40 ÷ 238.05 = 0.168 shares (rounded to 0.17 in display) Position Size: 0.17 × 102,062.9 = 17,350.69 USDT Position Amount (with 9x leverage): 17,350.69 ÷ 9 = 1,927.85 USDT For 2:1 RR: Net win = 238.05 × 0.17 × 2 = 80.94 USDT TP1 price = (80.94 + (1 × 102,062.9 × 0.17) + (102,062.9 × 0.0006 × 0.17)) ÷ (1 × 0.17 - 0.0006 × 0.17) = 101,464.7 USDT For 3:1 RR: TP2 price = 101,226.7 USDT (following same formula with RR=3) This ensures that after accounting for all fees, the actual risk-reward ratio matches the specified target ratio. Risk Management Features Maximum Trade Amount: Optional setting to limit position size regardless of account size Leverage Limits: Built-in maximum leverage protection Fee Integration: All calculations include realistic trading fees for accurate expectations Validation: Automatic checking that take-profit portions sum to 100% Historical Tracking: Visual indication when stop-loss or take-profit levels are reached (within last 5000 bars) Understanding Max Trade Amount - Multiple Simultaneous Trades: The "Max Trade Amount" feature is designed for traders who want to open multiple positions simultaneously while maintaining proper risk management. Here's how it works: Key Concept: - Risk percentage (2%) always applies to your full Account Size - Max Trade Amount limits the capital allocated per individual trade - This allows multiple trades with full risk on each trade Example from Screenshot: Account Size: 2,000 USDT Max Trade Amount: 500 USDT Risk per Trade: 2% × 2,000 = 40 USDT per trade Stop Loss Distance: 0.11% from entry Result: Position Size = 17,350.69 USDT with 35x leverage Total Risk (including fees): 40.46 USDT Multiple Trades Strategy: With this setup, you can open: Trade 1: 40 USDT risk, 495.73 USDT position amount (35x leverage) Trade 2: 40 USDT risk, 495.73 USDT position amount (35x leverage) Trade 3: 40 USDT risk, 495.73 USDT position amount (35x leverage) Trade 4: 40 USDT risk, 495.73 USDT position amount (35x leverage) Total Portfolio Exposure: - 4 simultaneous trades = 4 × 495.73 = 1,982.92 USDT position amount - Total risk exposure = 4 × 40 = 160 USDT (8% of account) Pine Script®指標由HllN提供155
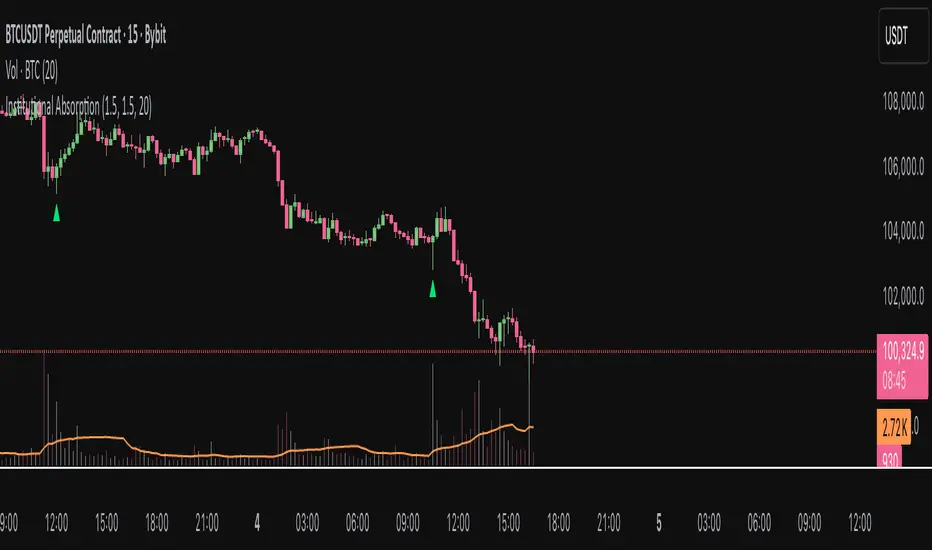
Institutional AbsorptionHighlights potential zones where institutional participants may be absorbing aggressive buying or selling pressure. It analyzes candle structure and volume to detect possible bullish and bearish absorption events, providing a visual cue for traders studying market imbalance and liquidity dynamics. The script compares each candle’s wick–body ratio and volume relative to its moving average. A bullish absorption setup occurs when strong volume appears after a sharp downward move with long lower wicks, while bearish absorption occurs after upward moves with long upper wicks, suggesting the presence of large counter-orders. + Features Detects bullish and bearish absorption candles. Customizable wick to body ratio and volume multiple thresholds. Optional filter to require candle color alignment with trend (green/red). Option to ignore tiny body (doji-like) candles. + How to Use Adjust wick–body ratio, volume multiplier, and lookback length under “Conditions (Absorption)”. Enable “Require candle color” to strengthen directional context. Use alerts to receive notifications when new absorption signals appear. + Notes This tool aims to visualize possible absorption behavior, not confirm institutional activity. Combine it with your broader market structure, volume, or order flow analysis for a more comprehensive analysis.Pine Script®指標由AGreatEscape提供已更新 29
Quantum Leap by GSK-Vizag-AP-IndiaQuantum Leap by GSK-Vizag-AP-India This indicator detects strong impulse price movements, also known as "quantum leaps," in bullish and bearish directions. Using the Average True Range (ATR) to measure market volatility, it identifies candles with body sizes significantly larger than recent average ranges, suggesting strong momentum surges. The script groups consecutive impulse candles into blocks, highlighting zones of sustained bullish or bearish strength on the chart. These visual blocks aid traders in quickly spotting powerful price moves that may indicate key market shifts or reversals. Additionally, this tool can be effectively used to identify Fair Value Gaps (FVG) in price action, making FVG detection easier and more intuitive for users. Inputs allow customization for ATR length, impulse strength threshold, and minimum consecutive candles, enabling adaptation to different markets or timeframes. Important Disclaimer: This indicator is for educational and informational purposes only. It is not financial advice and does not guarantee future results. Users should conduct their own research and seek professional guidance before making any trading decisions. Trading involves risk, including the potential loss of capital.Pine Script®指標由prowelltraders提供49
MACD Overlay v1 [JopAlgo]Meet the MACD you can trade directly from the chart. MACD Overlay v1 doesn’t just plot an oscillator somewhere below— it puts value, momentum, and participation on your candles, and it refuses to fire inside chop. When a triangle prints, it’s because energy released (expansion), not because the chart looked cute. What it is: An execution-ready MACD overlay with phase gating (Expansion-Only), participation gating (Weakness-Lite), and one-click Classic vs VW-MACD Compare—all adaptive, with minimal inputs. What’s in v1 (feature set) Overlay ribbon on price: Fast/Slow MACD value rendered as a price-level ribbon with contextual fill and optional candle tint. Dual value model: Classic MA-MACD (EMA/SMA) and VW-MACD (Rolling VWAP fast/slow). Compare mode: A/B Classic vs VW-MACD with a VW ghost ribbon. Weakness-Lite (1-bar, adaptive): Gates/fades low-participation crosses using RVOL deficit, Effort-vs-Result failure, and over-extension vs value/ATR (Strict adds wick pressure). Expansion-Only (Impulse/Squeeze): Triangles print only when a cross coincides with a true-range burst and a histogram-slope ignition out of compression. Signal hygiene: ±1-bar proximity around crosses, slope awareness, 2-bar debounce. Explainable filtering: Tiny gray dots show crosses that were intentionally filtered (weak and/or no expansion). How to use: Use defaults: Mode Classic, Gate by Weakness ON, Expansion-Only ON, Sensitivity Auto. Read signals fast: Solid triangle = cross + expansion confirmed (+ not weak if gate is ON). Faded triangle = cross + expansion but weak participation (visible only when gate is OFF). Gray dot = there was a cross, but it was filtered (no genuine expansion or weak & gated). Validate quickly: Flip Compare to check VW-MACD agreement. Classic + VW alignment usually improves confidence. Why overlay > sub-pane oscillator You see where the cross occurs: relative to value, local structure, and S/R, right on price. The ribbon exposes regime shifts; tint hints expansion vs contraction at a glance. Execution becomes more context-aware and less “signal-in-a-vacuum.” Signals & visuals Triangles (solid): MACD crossed Signal and market showed expansion out of compression; if Gate by Weakness is ON, triangle prints only with acceptable participation. Triangles (faded): Same as above but weak (shown only when you turn the gate OFF). Gray dots: Crosses that were filtered (no expansion and/or Weakness gate). Ribbon: Fast vs Slow value (Classic or VW, according to Mode). Fill and candle tint reflect expansion/contraction. Inputs Calculation Mode: Classic | VW | Compare VW uses Rolling VWAP fast/slow. Compare: Classic is primary; VW shows as a ghost ribbon for A/B checks. Gate triangles by Weakness: ON/OFF Uses RVOL, Effort-vs-Result, extension vs value/ATR (Strict adds wick-pressure). Sensitivity: Off / Auto / Strict (default Auto). Expansion-Only (Impulse/Squeeze): ON/OFF Requires compression → release: tight ribbon + flat momentum, then TR/ATR burst with hist slope flip / cross proximity. Display: Ribbon / Candle Tint / Weakness Markers. Advanced (optional): Evaluate Weakness only near signals, Channel (k × |MACD|), Style Preset. No numeric thresholds to tune—all filters self-calibrate from rolling stats. Best practices 4H crypto: Defaults are strong—Auto, Gate ON, Expansion-Only ON. Clean trends: If you feel you miss some tidy resumptions, briefly toggle Expansion-Only OFF. Choppy regimes: Set Sensitivity → Strict to cut more noise without adding lag. Confirmation: Use Compare; Classic + VW alignment typically yields better follow-through. Alerts MACD Signal Cross Up/Down — execution-grade (use Once per bar close). Weakness-Lite Flag — optional context alert to help audit filtered crosses. Attribution & License Attribution: Based on the algorithmic concept of TradingView’s built-in MACD (fast MA – slow MA, signal, histogram). No original TradingView source code is redistributed; overlay rendering, VW-MACD, Weakness-Lite, Expansion-Only, gating visuals, and UX are new work. License: MPL-2.0. Educational purposes only—not financial advice.Pine Script®指標由JopAlgo提供22732
Livelli OI-PNCOI-PNC Levels is a script that displays the open interest (OI) and net short positions (PNC) of a selection of 20 of the most significant stocks in terms of traded value on the Italian market. PNC are indicated by red dotted lines starting from the close of the last reported change date; The most significant open interest by number of contracts (Top 10 Calls and Top 10 Puts) are displayed using labels, all on a single line (Strike, CALL, PUT); A summary table can be activated. the data is hardcoded using static arrays and must be updated periodically. Data updated of 03/11/2025 ########### Italiano ############ Livelli OI-PNC è uno script che permette di visualizzare gli open interest (OI) e le Posizioni Nette Corte (PNC) di una selezione di 20 titoli tra i più significativi per controvalore movimentato del mercato italiano. Le PNC vengono indicate tramite Linee tratteggiate rosse che partono dal close della data di ultima variazione comunicata; Sono riportati tramite labels, gli Open Interest più significativi per num.Contratti (Top 10 Call e top 10 Put) tutto su una unica riga per ogni strike (Strike, CALL, PUT); E' attivabile una Tabella di riepilogo. Poiché Pine Script non può leggere direttamente file da URL esterni, i dati sono hardcorati tramite array statici e vanno aggiornati periodicamente. Dati aggiornati al 03/11/2025Pine Script®指標由Peiorg提供已更新 3365
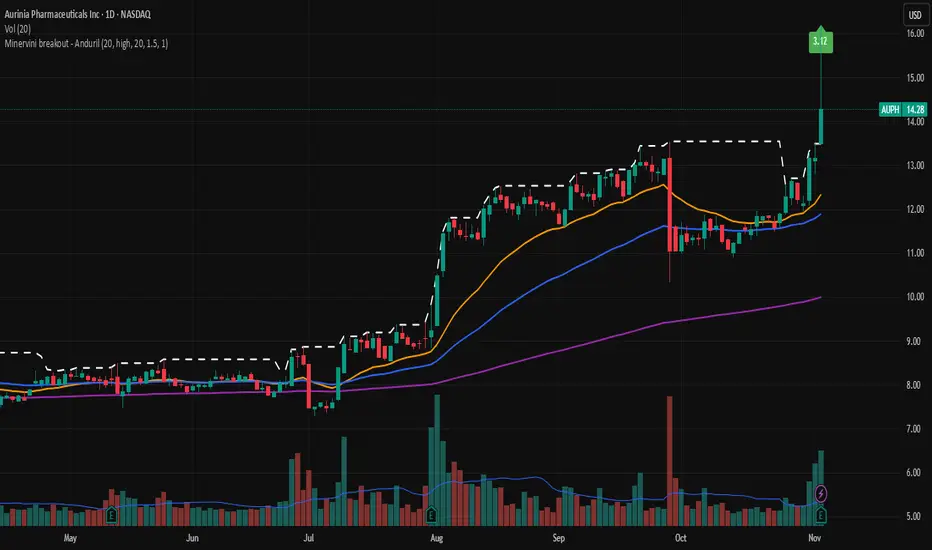
Minervini breakout - AndurilThis indicator checks the Mark Minerivini trend template as well checks consolidation areas and breakout. Checks the highest closing price of last x days (default 20 days), exluding current day and draws a white dashed line, Calculates the relative volume of the current day. Calculates EMA 21, EMA50 and EMA200 and draws on the graph to define trend. Gives a buy signal in green (writing relative strength of that day inside of green arrow) if: 1) Current price> breakout price* 0.98 2) Current price > EMA21 >EMA50>EMA200 3) Current price > 52 week high*0.75 4) Current price > 52 week low*1.3 5) EMA 200 of today > EMA 200 of 10 bar ago > EMA 200 of 20 bar ago 6) Relative volume of the day > 1.5Pine Script®指標由ozgenaltintas提供已更新 25
Breakout line - AndurilThis line shows the highest daily closing price of last 20 days default (can be adjusted from the settings). to help you to understand consolidation points and breakouts. Pine Script®指標由ozgenaltintas提供已更新 7
WIN1! • Crossing EMAs• (By Mesquita, v7)Moving average crossover strategy for intraday movements, especially in the continuous index (WIN1!) on the Brazilian stock exchange B³. The strategy is customizable for time windows, has a filter for trades only above the long-term average, whether only long, only short, or both, with or without stop loss.Pine Script®策略由DrMesquita提供15
KZ One — Scalping Training StrategyKZ One is a scalping strategy developed for M1 and M5 timeframes. It is designed to help traders study and practice short-term market behavior by using structured zones to highlight potential entry and exit areas. The strategy allows customization of Risk (USD) and Take Profit (R multiple) parameters for flexible trade management. Additional tools include ATR-based filters to skip low-volatility conditions and a Pre-Alert Lead (bars) option that notifies users ahead of possible setups. KZ One is intended for educational and analytical purposes, promoting disciplined and consistent trading practice.Pine Script®策略由Uttaya提供已更新 201
RAFEN-G - Kill Zones & Institutional Gaps🔍 What It Does Kill Zones (KZ1, KZ2, KZ3) Automatically highlights the main intraday liquidity windows such as the London open, NY AM, and NY PM sessions — customizable by time, color, and transparency. Perfect for timing setups, identifying liquidity sweeps, or backtesting session behavior. Institutional GAP Detection (NY 11:00 → 03:00) Anchored on the New York H1 clock, the script automatically draws the “institutional gap” between the 11:00 close and the 03:00 open of the next trading day. Each gap is drawn as a transparent box with a label showing its size in price units. Dynamic Cleanup & Color Updates Automatically removes old boxes beyond your chosen history limit and keeps all visuals perfectly synchronized in real-time. ⚙️ Key Features 3 fully independent and editable Kill Zones Adjustable timezone (default: America/New_York) Works on all intraday timeframes Auto-management of historical data Clean and lightweight visuals (up to 2000 boxes) Real-time color and transparency updates Alerts when each Kill Zone starts 🧠 Ideal For Traders using ICT, SMC, or institutional frameworks who want clear visual separation of market sessions and automatic tracking of session-to-session gaps for confluence or imbalance analysis. 🕐 Recommended Use Apply on 5 min / 15 min / 1 h charts, align timezone to NYC, and combine with liquidity or FVG tools for maximum insight.Pine Script®指標由RAFENTech提供28
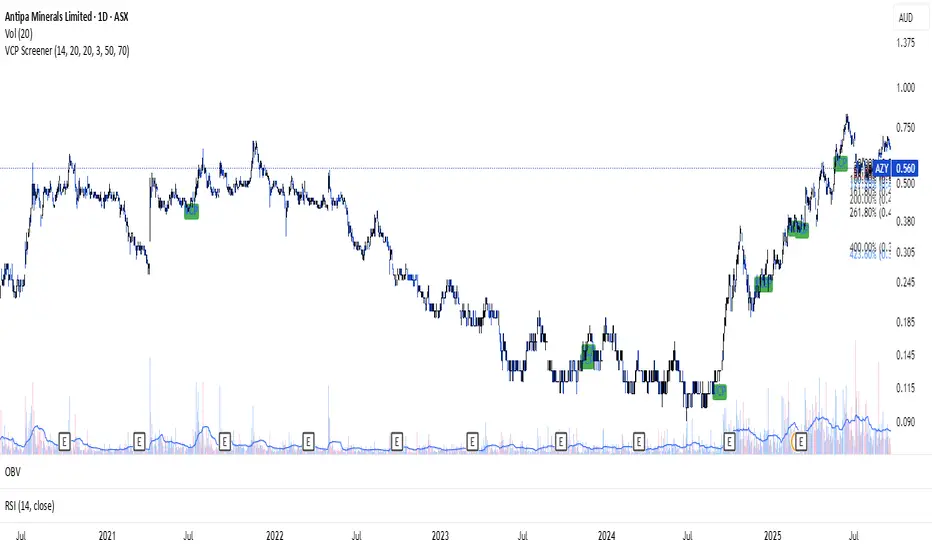
VCP ScreenerThis screener: • Detect tight price contraction using ATR • Check for volume contraction • Confirm trend strength using moving averages • Flag stocks near recent resistancePine Script®指標由ishwaren提供71
[KF] Multi-Duration Rate Expectations IndicatorAfter last fed cut in Oct then following jump in rates, I was frustrated at not having access to good rate expectations vs actual because the market usually prices in prior to fed action. This indicator was developed to make futures market rate expectations accessible and interpretable without requiring professional bond analytics systems. Summary This Pine Script indicator reveals what the futures market expects for interest rates across three key durations: Fed Funds (overnight), 2-Year, and 10-Year Treasury yields. By comparing futures-implied rates against current spot yields, it provides a clear visual signal of whether the market expects rates to rise, fall, or remain steady. Understanding Rate Futures Fed Funds futures (ZQ1!) use a simple design where the expected rate equals 100 minus the futures price. If ZQ1! trades at 96.12, the market expects a 3.88% Fed Funds rate. Treasury futures work differently - they trade as bond prices (typically 102-115) that move inversely to yields. Converting Treasury futures to implied yields requires complex bond mathematics involving duration and conversion factors. This indicator solves the Treasury futures complexity by implementing a self-calibrating sensitivity model. It observes the historical relationship between futures prices and yields, then uses this to project rate expectations. The model also compares front-month to next-month contracts to detect expected rate direction, automatically adapting as market conditions change. How to Use Add the indicator to any chart and select your desired duration in the settings. The display shows the futures-implied rate, current yield, and the difference between them. Green indicates the market expects higher rates, red means lower expectations, and gray shows expectations in line with current rates. The indicator excels at identifying divergences between market expectations and current rates, which often precede rate movements or futures repricing. Comparing expectations across different durations reveals insights about yield curve positioning and Fed policy anticipation. Technical Note While Fed Funds futures provide exact rate expectations, Treasury futures conversions are sophisticated approximations that provide reliable directional signals and reasonable magnitude estimates sufficient for most trading applications.Pine Script®指標由Kanefire提供7
💸 DCA Accumulation Strategy (USD‑Based Scaling)Buy when blue arrow appears, if the next arrow is lower than the last increase your position. This will pull your average cost down slowly over time.Pine Script®策略由germanjackson提供已更新 15
Gann Astronomical Turning PointsThis is a comprehensive Pine Script that implements W.D. Gann's astronomical theories to identify potential market turning points. Here's a detailed breakdown of the script: Overview The script identifies and displays astronomical events (sun angles, moon phases, and Mercury retrogrades) that Gann theorists believe correlate with market turning points. It also analyzes historical price performance following these events to provide statistical significance. Key Components 1. Input Parameters Date Range: Users can set the analysis period (start and end dates) Display Options: Toggle visibility of different astronomical events and tables Analysis Settings: Configure the lookback period for price change analysis (1-20 days) 2. Astronomical Calculations The script includes several functions to calculate celestial positions: getDaysSinceEpoch(t): Calculates days since January 1, 2000 (reference point) getSunLongitude(t): Computes the Sun's position in the ecliptic (0-360°) getMoonPhase(t): Determines the Moon's phase angle relative to the Sun getMercuryLongitude(t): Calculates Mercury's position in the ecliptic 3. Gann Critical Angles (Sun Events) The script identifies when the Sun reaches four critical angles that Gann considered significant: 0° Aries (Spring Equinox) 90° Cancer (Summer Solstice) 180° Libra (Fall Equinox) 270° Capricorn (Winter Solstice) These are detected by tracking when the Sun's longitude crosses these specific angles. 4. Moon Phases Four key moon phases are identified: New Moon: Moon passes between Earth and Sun First Quarter: Moon is 90° east of Sun Full Moon: Moon is opposite the Sun Last Quarter: Moon is 270° east of Sun 5. Mercury Retrograde Periods The script detects when Mercury appears to move backward in its orbit: Identifies start and end dates of retrograde motion Displays these periods as highlighted zones on the chart 6. Price Change Analysis For each astronomical event, the script: Calculates the percentage price change over a user-defined lookback period Categorizes changes as positive or negative Stores this data for statistical analysis 7. Statistical Significance The script calculates several metrics for each event type: Average Price Change: Mean percentage change following events Up/Down Ratio: Number of positive vs. negative changes Accuracy Percentage: How often the dominant direction occurred 8. Visual Elements The script includes multiple display components: Event Labels Sun Angles: Orange sun symbols displayed above price bars Moon Phases: Moon phase emojis displayed below price bars Mercury Retrograde: Red boxes highlighting the retrograde periods Information Tables Events Table: Shows upcoming and recent astronomical events Significance Analysis Table: Displays statistical performance of each event type Forecast Section: Identifies the next upcoming event and predicted direction 9. Forecasting Functionality The script predicts market direction for the next astronomical event based on: Historical average price change for that event type Statistical accuracy of previous similar events Color-coded forecast (green for bullish, red for bearish) This script offers an interesting implementation of Gann's astronomical theories, but should be used as part of a broader analysis rather than as a standalone trading system. Disclaimer: This indicator is for educational purposes only. Past performance does not guarantee future results. Always conduct your own research and risk assessment before trading. Pine Script®指標由kingshukghosh71提供33122
Trailing 12M % Gain/Lossthis script shows profit or loss for training 12 months, works only on daily time framePine Script®指標由shripadrupali提供115
Trailing 12M % Gain/LossThis script is about the trailing 12 months' profit/loss in %Pine Script®指標由shripadrupali提供8
Custom Checklist# Custom Checklist - Trading Preparation & Reminders A fully customizable checklist overlay indicator for TradingView that helps traders maintain discipline and follow their trading routine systematically. ## 🎯 Purpose This indicator serves as a visual reminder system on your charts to ensure you complete all necessary analysis steps before entering a trade. Perfect for traders who want to maintain consistency and avoid emotional or rushed trading decisions. ## ✨ Key Features - **20 Customizable Lines**: Create your own checklist items with any text you need - **Flexible Display Options**: - Show/hide title header - Toggle entire checklist on/off - Position anywhere on chart (9 positions available) - Adjustable text size (tiny to huge) - **Symbol Filtering**: Option to show checklist only on specific symbols (BTC/USD, GOLD, SPX500, USOIL) - **Customizable Appearance**: - Background color - Text color - Border color - Transparency controls - **Clean Interface**: Empty by default - add only the items you need ## 📋 Use Cases - **Morning Routine**: Daily market preparation checklist - **Trade Entry Rules**: Verify all setup conditions are met - **Risk Management**: Confirm stop-loss, position size, and exit strategy - **Multi-Timeframe Analysis**: Ensure you checked all required timeframes - **Technical Analysis**: Track which indicators and patterns you've reviewed - **News & Events**: Remember to check economic calendar and news - **Personal Rules**: Your custom trading rules and reminders ## 🎨 Customization Every aspect is customizable: - All 20 lines can be edited to your needs - Only non-empty lines are displayed - Table position adjustable to any corner or middle position - Color scheme fully customizable to match your chart theme - Text size scalable for different screen sizes ## 💡 How to Use 1. Add indicator to your chart 2. Open Settings > Checklist Items 3. Fill in your checklist items (Line 1, Line 2, etc.) 4. Customize colors and position in Display Settings 5. Optional: Enable "Show Only on Specific Symbols" to show on select instruments ## 🔧 Display Settings - **Checklist Title**: Custom header for your checklist - **Show Title Header**: Toggle title display - **Show Checklist**: Master on/off switch - **Symbol Filter**: Restrict display to specific trading instruments - **Position**: 9 placement options (corners and middle positions) - **Text Size**: 5 size options (tiny, small, normal, large, huge) - **Colors**: Background, text, and border fully customizable ## 📝 Example Checklist Ideas **Swing Trading:** - Support/Resistance levels identified - Trend direction confirmed - Volume analysis completed - RSI/MACD signals checked - Risk/Reward ratio calculated **Day Trading:** - Pre-market review done - Key levels marked - Economic calendar checked - Trading plan written - Position size calculated **Technical Analysis:** - Multiple timeframe alignment - Chart patterns identified - Moving averages reviewed - Fibonacci levels drawn - Volume profile analyzed ## ⚙️ Technical Details - Pine Script v6 - Overlay indicator (displays on main chart) - Lightweight - no complex calculations - No repainting - Works on all timeframes and instruments ## 🎓 Perfect For - Beginner traders learning systematic analysis - Experienced traders maintaining discipline - Anyone who wants visual trading reminders - Traders following multi-step strategies - Those prone to FOMO or emotional trading --- **Note**: This is a visual tool only. It does not generate trading signals or perform analysis. It serves as a reminder checklist to help you follow your own trading process consistently.Pine Script®指標由cfircoo提供9
Fibonacci Auto Retracement & HTF candles ReferenceAdvanced Higher Timeframe (HTF) Candle & Fibonacci Viewer Overview: The Advanced HTF Candle & Fibonacci Viewer is a professional Trading View indicator designed to help traders overlay higher timeframe price structures onto lower timeframe charts. By combining daily candle analysis with precise Fibonacci retracement levels, this tool allows traders to identify critical support and resistance zones, potential breakouts, and retracement opportunities without switching charts. Special Thanks: This script includes a small part of coding inspired by Zeiierman, whose work on HTF analysis provided the foundation for visualizing higher timeframe structures. Full credit to Zeiierman for their invaluable contribution to the Trading View community. Key Features: 1. Multi-Day HTF Range Display Automatically displays high and low of 1–7 previous days. Highlights candle bodies and wicks for clear structure visualization. Ideal for spotting daily ranges and breakout levels. 2. Dynamic Fibonacci Levels Standard levels: 0%, 11.8%, 23.6%, 38.2%, 50%, 61.8%, 76.4%, 88.2%, 100%. Optional mid-level lines for intraday support/resistance identification. Levels adjust automatically to reflect price action direction. 3. Customizable Labels & Colors Adjustable text size, color, transparency, and offset. Fully customizable candle and Fibonacci colors. Mid-level lines can be shown or hidden for a cleaner look. 4. Persistent Levels Levels remain until the next trading session or breakout, helping track trends and retracements consistently. 5. Multi-Timeframe Optimization Works on any chart timeframe, from 1-minute to weekly charts. Provides higher timeframe insight while trading on lower timeframes. Why Traders Love This Indicator: View higher timeframe action without switching charts. Identify high-probability entry and exit zones. Combine with other indicators for complete market analysis. Useful for swing traders, day traders, and scalpers alike. Customization Options: Number of previous days (1–7) Show/hide mid-level lines Show/hide labels Customize label size, color, and offset Customize Fibonacci and candle colors Ideal Use Cases: Swing Trading: Identify daily key levels for entry, exit, and stop-loss. Day Trading: Use HTF ranges on intraday charts to spot breakouts and reversals. Fibonacci Analysis: Locate retracement zones efficiently. Trend Confirmation: Validate trades with higher timeframe structure. Summary: The Advanced HTF Candle & Fibonacci Viewer is a powerful tool for traders seeking clarity, structure, and precision. With higher timeframe insight overlaid on active charts and proper credit to Zeiierman for their HTF coding contribution, this indicator helps traders make informed, confident decisions in any market.Pine Script®指標由Chandannk提供已更新 154
ATR + EMA + Sessions ProATR + EMA + Sessions Pro By Saeed Fadi to save indicator space, it,s for atr, emas, sessions etc.Pine Script®指標由rockk45提供11
3D Institutional Battlefield [SurgeGuru]Professional Presentation: 3D Institutional Flow Terrain Indicator Overview The 3D Institutional Flow Terrain is an advanced trading visualization tool that transforms complex market structure into an intuitive 3D landscape. This indicator synthesizes multiple institutional data points—volume profiles, order blocks, liquidity zones, and voids—into a single comprehensive view, helping you identify high-probability trading opportunities. Key Features 🎥 Camera & Projection Controls Yaw & Pitch: Adjust viewing angles (0-90°) for optimal perspective Scale Controls: Fine-tune X (width), Y (depth), and Z (height) dimensions Pro Tip: Increase Z-scale to amplify terrain features for better visibility 🌐 Grid & Surface Configuration Resolution: Adjust X (16-64) and Y (12-48) grid density Visual Elements: Toggle surface fill, wireframe, and node markers Optimization: Higher resolution provides more detail but requires more processing power 📊 Data Integration Lookback Period: 50-500 bars of historical analysis Multi-Source Data: Combine volume profile, order blocks, liquidity zones, and voids Weighted Analysis: Each data source contributes proportionally to the terrain height How to Use the Frontend 💛 Price Line Tracking (Your Primary Focus) The yellow price line is your most important guide: Monitor Price Movement: Track how the yellow line interacts with the 3D terrain Identify Key Levels: Watch for these critical interactions: Order Blocks (Green/Red Zones): When yellow price line enters green zones = Bullish order block When yellow price line enters red zones = Bearish order block These represent institutional accumulation/distribution areas Liquidity Voids (Yellow Zones): When yellow price line enters yellow void areas = Potential acceleration zones Voids indicate price gaps where minimal trading occurred Price often moves rapidly through voids toward next liquidity pool Terrain Reading: High Terrain Peaks: High volume/interest areas (support/resistance) Low Terrain Valleys: Low volume areas (potential breakout zones) Color Coding: Green terrain = Bullish volume dominance Red terrain = Bearish volume dominance Purple = Neutral/transition areas 📈 Volume Profile Integration POC (Point of Control): Automatically marks highest volume level Volume Bins: Adjust granularity (10-50 bins) Height Weight: Control how much volume affects terrain elevation 🏛️ Order Block Detection Detection Length: 5-50 bar lookback for block identification Strength Weighting: Recent blocks have greater impact on terrain Candle Body Option: Use full candles or body-only for block definition 💧 Liquidity Zone Tracking Multiple Levels: Track 3-10 key liquidity zones Buy/Sell Side: Different colors for bid/ask liquidity Strength Decay: Older zones have diminishing terrain impact 🌊 Liquidity Void Identification Threshold Multiplier: Adjust sensitivity (0.5-2.0) Height Amplification: Voids create significant terrain depressions Acceleration Zones: Price typically moves quickly through void areas Practical Trading Application Bullish Scenario: Yellow price line approaches green order block terrain Price finds support in elevated bullish volume areas Terrain shows consistent elevation through key levels Bearish Scenario: Yellow price line struggles at red order block resistance Price falls through liquidity voids toward lower terrain Bearish volume peaks dominate the landscape Breakout Setup: Yellow price line consolidates in flat terrain Minimal resistance (low terrain) in projected direction Clear path toward distant liquidity zones Pro Tips Start Simple: Begin with default settings, then gradually customize Focus on Yellow Line: Your primary indicator of current price position Combine Timeframes: Use the same terrain across multiple timeframes for confluence Volume Confirmation: Ensure terrain peaks align with actual volume spikes Void Anticipation: When price enters voids, prepare for potential rapid movement Order Blocks & Voids Architecture Order Blocks Calculation Trigger: Price breaks fractal swing points Bullish OB: When close > swing high → find lowest low in lookback period Bearish OB: When close < swing low → find highest high in lookback period Strength: Based on price distance from block extremes Storage: Global array maintains last 50 blocks with FIFO management Liquidity Voids Detection Trigger: Price gaps exceeding ATR threshold Bull Void: Low - high > (ATR200 × multiplier) Bear Void: Low - high > (ATR200 × multiplier) Validation: Close confirms gap direction Storage: Global array maintains last 30 voids Key Design Features Real-time Updates: Calculated every bar, not just on last bar Global Persistence: Arrays maintain state across executions FIFO Management: Automatic cleanup of oldest entries Configurable Sensitivity: Adjustable lookback periods and thresholds Scientific Testing Framework Hypothesis Testing Primary Hypothesis: 3D terrain visualization improves detection of institutional order flow vs traditional 2D charts Testable Metrics: Prediction Accuracy: Does terrain structure predict future support/resistance? Reaction Time: Faster identification of key levels vs conventional methods False Positive Reduction: Lower rate of failed breakouts/breakdowns Control Variables Market Regime: Trending vs ranging conditions Asset Classes: Forex, equities, cryptocurrencies Timeframes: M5 to H4 for intraday, D1 for swing Volume Conditions: High vs low volume environments Data Collection Protocol Terrain Features to Quantify: Slope gradient changes at price inflection points Volume peak clustering density Order block terrain elevation vs subsequent price action Void depth correlation with momentum acceleration Control Group: Traditional support/resistance + volume profile Experimental Group: 3D Institutional Flow Terrain Statistical Measures Signal-to-Noise Ratio: Terrain features vs random price movements Lead Time: Terrain formation ahead of price confirmation Effect Size: Performance difference between groups (Cohen's d) Statistical Power: Sample size requirements for significance Validation Methodology Blind Testing: Remove price labels from terrain screenshots Have traders identify key levels from terrain alone Measure accuracy vs actual price action Backtesting Framework: Automated terrain feature extraction Correlation with future price reversals/breakouts Monte Carlo simulation for significance testing Expected Outcomes If hypothesis valid: Significant improvement in level prediction accuracy (p < 0.05) Reduced latency in institutional level identification Higher risk-reward ratios on terrain-confirmed trades Research Questions: Does terrain elevation reliably indicate institutional interest zones? Are liquidity voids statistically significant momentum predictors? Does multi-timeframe terrain analysis improve signal quality? How does terrain persistence correlate with level strength? LuxAlgo BigBeluga hapharmonicPine Script®指標由SurgeGuru提供2241