[LunaOwl] Center of Gravity作品: 艾勒斯重心點 (Center of Gravity, CG)
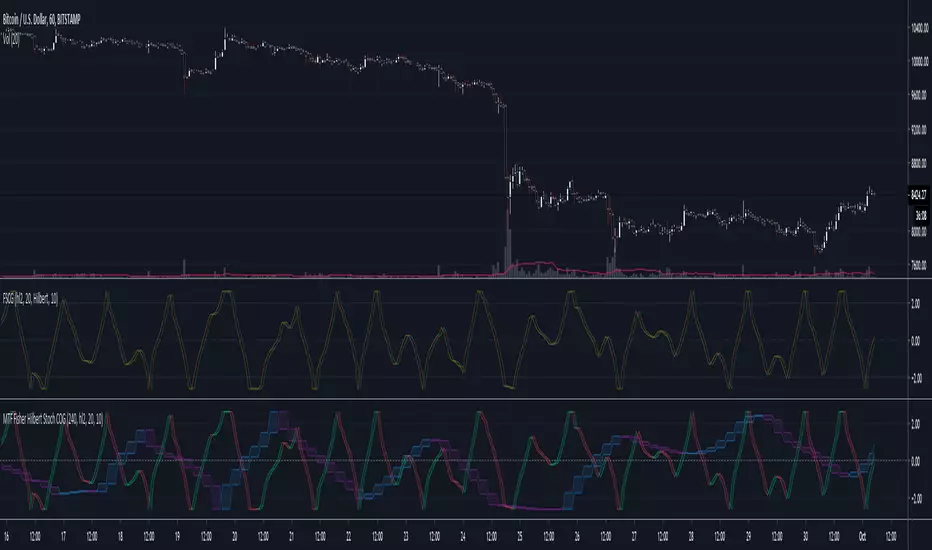
Center of Gravity was developed by John Ehlers in 2002. The main purpose of the Center of Gravity indicator is to find possible reversal points as early as possible. Indicator has two series, the first is the CoG series, and the second is the signal line calculated by the five-period smoothed moving average. Cross representative indication of the direction. I coded this indicator according to the description of MT4, a little work.
重心點(Center of Gravity)是由約翰.艾勒斯在2002年開發的,這個指標的主要用途是儘早發現可能的反轉點。它有兩個部份,一個是重心點指標線,另一個是經過五期平滑移動平均線平滑過的信號線,它們的交叉結果代表方向。我按照MT4的說明編寫了這個小作品。
Pine Script®指標