Smoothed Source Weighted EMAThe Smoothed Source EMA is a tool designed to help traders identify potential buying and selling opportunities in the market. It combines two key elements: price smoothing (using standard deviation) and an Exponential Moving Average (EMA). The purpose is to filter out the day-to-day price fluctuations and create clearer buy and sell signals.
Key Concepts Behind the Indicator:
Price Smoothing (Standard Deviation):
To make the price action easier to follow, the indicator first "smooths" the price. This is done by looking at how much the price tends to move up and down (known as standard deviation).
It then creates two "bands" around the current price—one above and one below. These bands represent a smoothed version of the price and help filter out the noise caused by small, random price movements.
Exponential Moving Average (EMA):
The indicator also uses an Exponential Moving Average (EMA), which is a line that represents the average price over a certain period of time (but gives more weight to recent prices). The EMA helps capture the general trend of the price.
The indicator uses this EMA to compare the current price with the overall trend.
How Does the Indicator Work?
Once the indicator calculates the smoothed price bands and the EMA, it looks for specific conditions to trigger a buy or sell signal:
Long (Buy) Signal:
A buy signal happens when the smoothed price (the lower band) is above the EMA. In simple terms, the price is moving up, and the indicator is telling you it's a good time to buy.
The more "weight" or influence you give to the EMA, the slower this buy signal will appear, meaning it’ll only trigger when there’s a strong enough upward movement.
Short (Sell) Signal:
A sell signal occurs when the smoothed price (the upper band) is below the EMA. This suggests the price is moving down, and the indicator signals that it might be time to sell.
Again, the more "weight" you put on the EMA, the slower the sell signal will appear, as the indicator waits for a clearer downtrend.
Why is this Useful for Traders?
Smoothing the Price: Many traders struggle with the noise of price fluctuations, where the price moves up and down quickly without a clear trend. By smoothing the price, this indicator helps traders focus on the bigger picture and avoid reacting to every small movement.
Clear Buy and Sell Signals: The indicator generates easy-to-understand buy and sell signals based on the relationship between the smoothed price and the EMA. If the price is above the smoothed level and EMA, it’s a signal to buy. If it’s below, it’s a signal to sell.
Customizable Sensitivity: The indicator lets traders adjust how sensitive the buy and sell signals are. By changing certain settings, such as the smoothing length and the weight of the EMA, traders can make the indicator react faster or slower depending on how quickly they want to catch changes in the market.
How the Indicator Appears on the Chart:
EMA Line: A line that represents the trend of the price.
Upper and Lower Smoothed Bands: Two bands above and below the price that help identify when the price is moving up or down relative to the trend.
Buy and Sell Arrows: Small arrows on the chart show where the indicator suggests buying or selling.
Colored Bars: The bars on the chart may change color to visually indicate whether the indicator suggests a buy (green) or a sell (red).
In Summary:
The Smoothed Source EMA helps you identify trends by smoothing out price movements using standard deviation, then comparing these smoothed prices with the Exponential Moving Average (EMA).
When the smoothed price moves above or below the EMA, it gives you a signal: a buy when the smoothed price is above the EMA, and a sell when it’s below.
You can adjust how quickly or slowly these signals appear by modifying the settings, giving you control over how sensitive the indicator is to changes in the market.
This indicator is useful for traders who want to reduce noise and focus on the overall trend, using clear, visually simple signals to guide their trading decisions.
指數移動平均線(EMA)

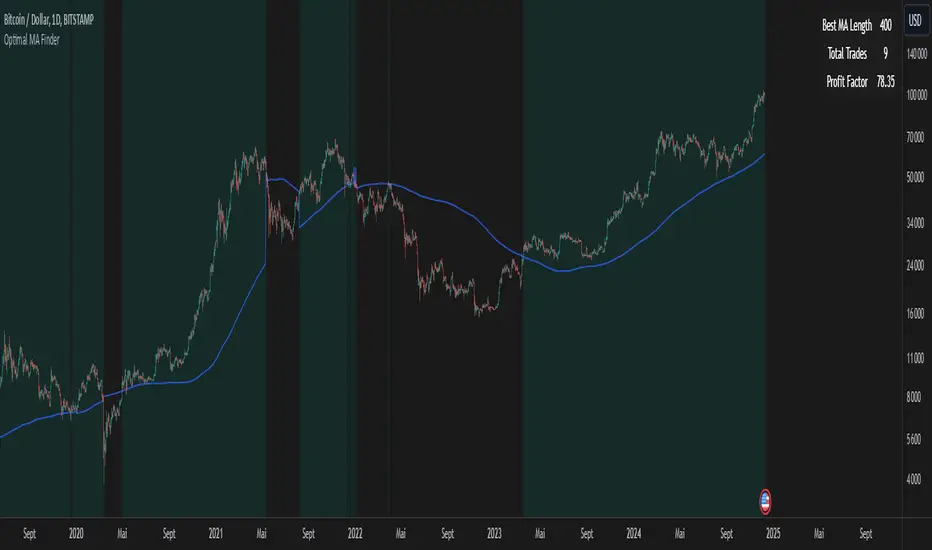
Optimal MA FinderIntroduction to the "Optimal MA Finder" Indicator
The "Optimal MA Finder" is a powerful and versatile tool designed to help traders optimize their moving average strategies. This script combines flexibility, precision, and automation to identify the most effective moving average (MA) length for your trading approach. Whether you're aiming to improve your long-only strategy or implement a buy-and-sell methodology, the "Optimal MA Finder" is your go-to solution for enhanced decision-making.
What Does It Do?
The script evaluates a wide range of moving average lengths, from 10 to 500, to determine which one produces the best results based on historical data. By calculating critical metrics such as the total number of trades and the profit factor for each MA length, it identifies the one that maximizes profitability. It supports both simple moving averages (SMA) and exponential moving averages (EMA), allowing you to tailor the analysis to your preferred method.
The logic works by backtesting each MA length against the price data and assessing the performance under two strategies:
Buy & Sell: Includes both long and short trades.
Long Only: Focuses solely on long positions for more conservative strategies.
Once the optimal MA length is identified, the script overlays it on the chart, highlighting periods when the price crosses over or under the optimal MA, helping traders identify potential entry and exit points.
Why Is It Useful?
This indicator stands out for its ability to automate a task that is often labor-intensive and subjective: finding the best MA length. By providing a clear, data-driven answer, it saves traders countless hours of manual testing while significantly enhancing the accuracy of their strategies. For example, instead of guessing whether a 50-period EMA is more effective than a 200-period SMA, the "Optimal MA Finder" will pinpoint the exact length and type of MA that has historically yielded the best results for your chosen strategy.
Key Benefits:
Precision: Identifies the MA length with the highest profit factor for maximum profitability.
Automation: Conducts thorough backtesting without manual effort.
Flexibility: Adapts to your preferred MA type (SMA or EMA) and trading strategy (Buy & Sell or Long Only).
Real-Time Feedback: Provides actionable insights by plotting the optimal MA directly on your chart and highlighting relevant trading periods.
Example of Use: Imagine you're trading a volatile stock and want to optimize your long-only strategy. By applying the "Optimal MA Finder," you discover that a 120-period EMA results in the highest profit factor. The indicator plots this EMA on your chart, showing you when to consider entering or exiting positions based on price movements relative to the EMA.
In short, the "Optimal MA Finder" empowers traders by delivering data-driven insights and improving the effectiveness of trading strategies. Its clear logic, combined with robust automation, makes it an invaluable tool for both novice and experienced traders seeking consistent results.
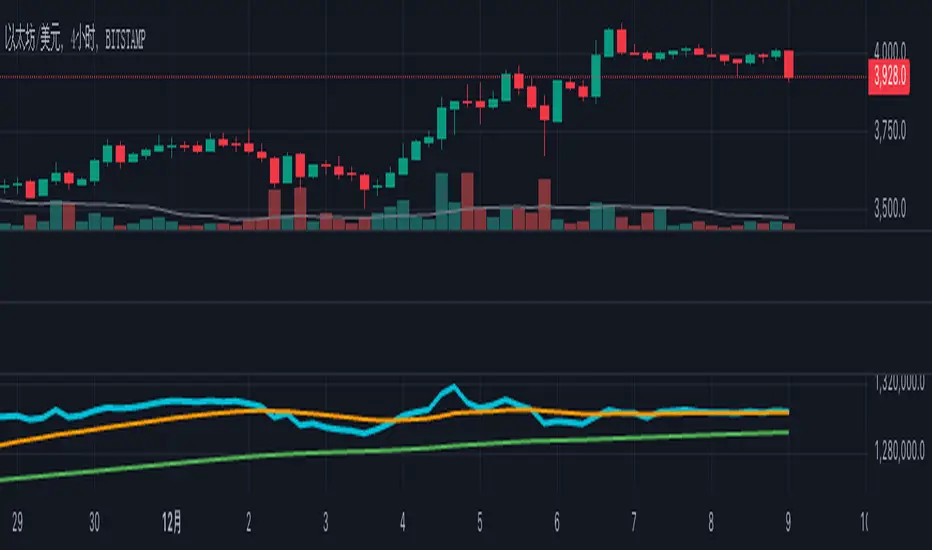
OBV + Custom MA StrategyFor a long time, the use of the OBV indicator has been relatively monotonous, with its expression and content lacking diversity. Therefore, I'm considering trying new ways of representation.
This "OBV + Custom MA Strategy" indicator combines the On-Balance Volume (OBV) with customizable moving averages (SMA, EMA, or WMA) to provide advanced insights into market trends. The indicator calculates OBV manually and overlays two moving averages: a short-term and a long-term MA. Key features include:
OBV plotted alongside short-term and long-term moving averages for better trend visualization.
Signals generated when OBV crosses the short-term MA or when the short-term MA crosses the long-term MA.
Alerts for bullish and bearish crossovers to help identify potential buy or sell opportunities.
This indicator is suitable for traders looking to incorporate volume dynamics into their strategy while customizing their moving average type and periods.
中文说明
此“OBV + 自定义均线策略”指标结合了成交量指标OBV与可定制的移动均线(SMA、EMA或WMA),为市场趋势分析提供了更多的视角。该指标手动计算OBV,并叠加短期与长期均线,主要特点包括:
绘制OBV以及短期和长期均线,以更清晰地观察趋势。
当OBV上穿/下穿短期均线或短期均线上穿/下穿长期均线时,生成买卖信号。
提供多种看涨和看跌信号的警报,帮助识别潜在的买入或卖出机会。
此指标适合希望将成交量动态纳入策略的交易者,并支持自定义均线类型和周期以满足个性化需求。
Boltzmann Weighted Moving average ( BWMA )Overview:
Introducing the Boltzmann Weighted Moving Average (BWMA) – a novel approach that draws inspiration from statistical mechanics to emphasize recent market data more than older data. By applying an exponential decay governed by a “temperature” parameter, BWMA provides a unique perspective on price trends and enhances noise filtering. An EMA-based smoothing is then applied for an even cleaner, more stable signal.
Key Features:
Boltzmann Weighting: The BWMA assigns weights to each data point based on a Boltzmann-like formula, giving more influence to recent bars and reducing the impact of older ones. This creates a dynamic, adaptive moving average that can quickly respond to market changes.
Adaptive Temperature Control: Users can adjust the “Temperature” (T) parameter. A lower T puts a stronger emphasis on the most recent data, while a higher T makes the weight distribution more uniform across the chosen period.
EMA Smoothing: After computing the weighted average, an EMA is applied to smooth out short-term noise, resulting in a cleaner trend indication.
Color-Coded Trend Indicator: The BWMA line changes color depending on its slope, allowing traders to quickly identify bullish (green) or bearish (red) conditions at a glance.
Parameters:
Period: Defines the lookback window over which the Boltzmann weights are calculated.
Temperature (T): Controls the steepness of the weight decay. Lower T emphasizes recency, while higher T spreads weights more evenly.
Alpha (Energy Scale): Adjusts how quickly “Energy” (and thus weight decay) increases with older data points.
Smoothing Period: Determines the EMA length for reducing noise after weighting, providing a more stable signal.
How It Works:
The BWMA calculates a weighted average of recent prices, where the weight for each data point i is given by:
weight = math.exp(-energy / (k_B * T))
Energy_i: Increases as the data point is further back in time.
k_B: A scaling constant, set to 1 for simplicity.
T: "Temperature" parameter that controls how quickly the weights decay. A lower T emphasizes more recent data strongly, while a higher T spreads out the emphasis more evenly.
Visuals:
BWMA Line: Plotted as a smooth line that changes color based on trend direction.
Green: BWMA is rising (bullish trend).
Red: BWMA is falling (bearish trend).
Usage:
The BWMA can be used similarly to traditional moving averages but offers greater flexibility and adaptability:
Adjust T and Alpha: Fine-tune the weighting profile to match your trading style, whether you prefer rapid response to recent changes or a more balanced view.
Trend Confirmation: Use color changes to confirm bullish or bearish momentum.
Filtering Noise: The combination of Boltzmann weighting and EMA smoothing can help reduce the impact of sudden price spikes and yield clearer trend signals.
By blending the concepts of statistical mechanics with classic technical analysis techniques, the Boltzmann Weighted Moving Average provides traders with an innovative tool for revealing underlying market trends.

Stage Market V4This script provides a comprehensive tool for identifying market stages based on exponential moving averages (EMAs), market performance metrics, and additional price statistics. Below is a summary of its functionality and instructions on how to use it:
1. Inputs and Configuration
Fast and Slow EMA:
Fast EMA Length: Determines the period for the fast EMA.
Slow EMA Length: Determines the period for the slow EMA.
Additional EMAs:
Enable or disable three additional EMAs (EMA 1, EMA 2, and EMA 3) with customizable lengths.
52-Week High Display:
Optionally display the percentage distance from the 52-week high.
2. Market Stages
The indicator identifies six market stages based on the relationship between the price, fast EMA, and slow EMA:
Recovery: Price is above the fast EMA, and the slow EMA is above both the price and the fast EMA.
Accumulation: Price is above both the fast EMA and slow EMA, but the slow EMA is still above the fast EMA.
Bull Market: Price, fast EMA, and slow EMA are all aligned in a rising trend.
Warning: Price is below the fast EMA, but still above the slow EMA, signaling potential weakness.
Distribution: Price is below both EMAs, but the slow EMA remains below the fast EMA.
Bear Market: Price, fast EMA, and slow EMA are all aligned in a falling trend.
The current stage is displayed in a table along with the number of bars spent in that stage.
3. Performance Metrics
The script calculates additional metrics to gauge the stock's performance:
30-Day Change: The percentage price change over the last 30 days.
90-Day Change: The percentage price change over the last 90 days.
Year-to-Date (YTD) Change: The percentage change from the year's first closing price.
Distance from 52-Week High (if enabled): The percentage difference between the current price and the highest price over the past 52 weeks.
These values are color-coded:
Green for positive changes.
Red for negative changes.
4. Table Display
The indicator uses a table in the bottom-right corner of the chart to show:
Current market stage and bars spent in the stage.
30-day, 90-day, and YTD changes.
Distance from the 52-week high (if enabled).
5. EMA Plotting
The script plots the following EMAs on the chart:
Fast EMA (default: 50-period) in yellow.
Slow EMA (default: 200-period) in orange.
Optional EMAs (EMA 1, EMA 2, and EMA 3) in blue, green, and purple, respectively.
6. Using the Indicator
Add the indicator to your chart via the Pine Editor in TradingView.
Customize the input parameters to fit your trading style or the asset's characteristics.
Use the table to quickly assess the current market stage and key performance metrics.
Observe the plotted EMAs to understand trend alignments and potential crossovers.
This script is particularly useful for identifying market trends, understanding price momentum, and aligning trading decisions with broader market conditions.

EMA Volatility Channel [QuantAlgo]EMA Volatility Channel 🌊📈
The EMA Volatility Channel by QuantAlgo is an advanced technical indicator designed to capture price volatility and trend dynamics through adaptive channels based on exponential moving averages. This sophisticated system combines EMA-based trend analysis with dynamic volatility-adjusted bands to help traders and investors identify trend direction, potential reversals, and market volatility conditions. By evaluating both price momentum and volatility together, this tool enables users to make informed trading decisions while adapting to changing market conditions.
💫 Dynamic Channel Architecture
The EMA Volatility Channel provides a unique framework for assessing market trends through a blend of exponential moving averages and volatility-based channel calculations. Unlike traditional channel indicators that use fixed-width bands, this system incorporates dynamic volatility measurements to adjust channel width automatically, helping users determine whether price movements are significant relative to current market conditions. By combining smooth EMA trends with adaptive volatility bands, it evaluates both directional movement and market volatility, while the smoothing parameters ensure stable yet responsive channel adjustments. This adaptive approach allows users to identify trending conditions while remaining aware of volatility expansions and contractions, enhancing both trend-following and reversal strategies.
📊 Indicator Components & Mechanics
The EMA Volatility Channel is composed of several technical components that create a dynamic channel system:
EMA Midline: Calculates a smoothed exponential moving average that serves as the channel's centerline, providing a clear reference for trend direction.
Volatility Measurement: Computes average price movement to determine dynamic channel width, adapting to changing market conditions automatically.
Smooth Band Calculation: Applies additional smoothing to the channel bands, reducing noise while maintaining responsiveness to significant price movements.
📈 Key Indicators and Features
The EMA Volatility Channel combines various technical tools to deliver a comprehensive analysis of market conditions.
The indicator utilizes exponential moving averages with customizable length and smoothing parameters to adapt to different trading styles. Volatility calculations are applied to determine channel width, providing context-aware boundaries for price movement. The trend detection component evaluates price action relative to the channel bands, helping validate trends and identify potential reversals.
The indicator incorporates multi-layered visualization with color-coded channels and bars to signal both trend direction and market position. These adaptive visual cues, combined with programmable alerts for channel breakouts, help traders and investors track both trend changes and volatility conditions, supporting both trend-following and mean-reversion strategies.
⚡️ Practical Applications and Examples
✅ Add the Indicator: Add the indicator to your TradingView chart by clicking on the star icon to add it to your favorites ⭐️
👀 Monitor Channel Position: Watch the price position relative to the channel bands to identify trend direction and potential reversals. When price moves outside the channel, consider potential trend changes or extreme conditions.
🔔 Set Alerts: Configure alerts for channel breakouts and trend changes, ensuring you can act on significant technical developments promptly.
🌟 Summary and Tips
The EMA Volatility Channel by QuantAlgo is a versatile technical tool, designed to support both trend following and volatility analysis across different market environments. By combining smooth EMA trends with dynamic volatility-based channels, it helps traders and investors identify significant price movements while measuring market volatility, providing reliable technical signals. The tool's adaptability across timeframes makes it suitable for both trend-following and reversal strategies, allowing users to capture opportunities while maintaining awareness of changing market conditions.

EMAs MTF (Miu)This indicator plots multiple EMA (Exponential Moving Average) on chart.
You can set up to 3 different EMA for the current timeframe and you can add up to 3 more different EMA with a different timeframe. So you can have up to 6 EMAs on your chart.
This way you can easily see multiple EMA lines with a single indicator to setup.
Indicator will automaticaly plot labels with symbol's price, timeframe and which EMA is set for easy identification.
You can also set an alert that will trigger anytime current price crosses any active EMA.
Alerts will provide detailed information such as:
1) Symbol
2) Which EMA and timeframe that has been crossed
3) Current symbol price
Feel free to give feedbacks on comments section below. Suggestions are welcome.
Enjoy!

UVR Crypto TrendINDICATOR OVERVIEW: UVR CRYPTO TREND
The UVR Crypto Trend indicator is a custom-built tool designed specifically for cryptocurrency markets, utilizing advanced volatility, momentum, and trend-following techniques. It aims to identify trend reversals and provide buy and sell signals by analyzing multiple factors, such as price volatility(UVR), RSI (Relative Strength Index), CMF (Chaikin Money Flow), and EMA (Exponential Moving Average). The indicator is optimized for CRYPTO MARKETS only.
KEY FEATURES AND HOW IT WORKS
Volatility Analysis with UVR
The UVR (Ultimate Volatility Rate) is a proprietary calculation that measures market volatility by comparing significant price extremes and smoothing the data over time.
Purpose: UVR aims to reduce noise in low-volatility environments and highlight significant movements during higher-volatility periods. While it strives to improve filtering in low-volatility conditions, it does not guarantee perfect performance, making it a balanced and adaptable tool for dynamic markets like cryptocurrency.
HOW UVR (ULTIMATE VOLATILITY RATE) IS CALCULATED
UVR is calculated using a method that ensures precise measurement of market volatility by comparing price extremes across consecutive candles:
Volatility Components:
Two values are calculated to represent potential price fluctuations:
The absolute difference between the current candle's high and the previous candle's low:
Volatility Component 1=∣High−Low ∣
The absolute difference between the previous candle's high and the current candle's low:
Volatility Component 2=∣High −Low∣
Volatility Ratio:
The larger of the two components is selected as the Volatility Ratio, ensuring UVR captures the most significant movement:
Volatility Ratio=max(Volatility Component 1,Volatility Component 2)
Smoothing with SMMA:
To stabilize the volatility calculation, the Volatility Ratio is smoothed using a Smoothed Moving Average (SMMA) over a user-defined period (e.g., 14 candles):
UVR=(UVR(Previous)×(Period−1)+Volatility Ratio)/Period
This calculation ensures UVR adapts dynamically to market conditions, focusing on significant price movements while filtering out noise.
RSI FOR MOMENTUM DETECTION
RSI (Relative Strength Index) identifies overbought and oversold conditions.
Trend Confirmation at the 50 Level
RSI values crossing above 50 signal the potential start of an upward trend.
RSI values crossing below 50 indicate the potential start of a downward trend.
Key Reversals at Extreme Levels
RSI detects trend reversals at overbought (>70) and oversold (<30) levels.
For example:
Overbought Trend Reversal: RSI >70 followed by bearish price action signals a potential downtrend.
Oversold Trend Reversal: RSI <30 with bullish confirmation signals a potential uptrend.
Rare Extreme RSI Readings
Extreme levels, such as RSI <12 (oversold) or RSI >88 (overbought), are used to identify rare yet powerful reversals.
---HOW IT DIFFERS FROM OTHER INDICATORS---
Using UVR High and Low Values
The Ultimate Volatility Rate (UVR) focuses on analyzing the high and low price ranges of the market to measure volatility.
Unlike traditional trend indicators that rely primarily on momentum or moving average crossovers, UVR leverages price extremes to better identify trend reversals.
This approach ensures fewer false signals during low-volatility phases and more accurate trend detection during high-volatility conditions.
UVR as the Core Component
The indicator is fundamentally built around UVR as the primary filter, while supporting tools like RSI (momentum detection), CMF (volume confirmation), and EMA (trend validation) complement its functionality.
By integrating these additional components, the indicator provides a multidimensional analysis rather than relying solely on a single approach.
Dynamic Adaptation to Volatility
UVR dynamically adjusts to market conditions, striving to improve filtering in low-volatility phases. While not flawless, this approach minimizes false signals and adapts more effectively to varying levels of market activity.
Trend Clouds for Visual Guidance
UVR-based dynamic clouds visually mark high and low price areas, highlighting potential consolidation or retracement zones.
These clouds serve as guides for setting stop-loss or take-profit levels, offering clear risk management strategies.
BUY AND SELL SIGNAL LOGIC
BUY CONDITIONS
Momentum-Based Buy-Entry
RSI >50, CMF >0, and the close price is above EMA50.
The price difference between open and close exceeds a threshold based on UVR.
Oversold Reversal
RSI <30 and CMF >0 with a strong bullish candle (close > open and UVR-based sensitivity filter).
Breakout Confirmation
The price breaks above a previously identified resistance, with conditions for RSI and CMF supporting the breakout.
Reversal from Oversold RSI Extreme
RSI <12 on the previous candle with a strong rebound on the current candle with UVR confirmation filter.
SELL CONDITIONS
Momentum-Based Sell-Entry
RSI <50, CMF <0, and the close price is below EMA50.
The price difference between open and close exceeds the UVR threshold.
Overbought Reversal
RSI >70 with bearish price action (open > close and UVR-based sensitivity filter).
Breakdown Confirmation
The price breaks below a previously identified support, with RSI and CMF supporting the breakdown.
Reversal from Overbought RSI Extreme
RSI >88 on the previous candle with a bearish confirmation on the current candle with UVR confirmation filter.
BUY AND SELL SIGNALS VISUALIZATION
The UVR Crypto Trend Indicator visually represents buy and sell conditions using dynamic plots, making it easier for traders to interpret and act on the signals. Below is an explanation of the visual representation:
Buy Signals and Visualization
Signal Trigger:
A buy signal is generated when one of the defined Buy Conditions is met (e.g., RSI >50, CMF >0, price above EMA50).
Visual Representation:
A blue upward arrow appears at the candle where the buy condition is triggered.
A blue cloud forms above the price candles, representing the strength of the bullish trend. The cloud dynamically adapts to market volatility, using the UVR calculation to mark support zones or consolidation levels.
Purpose of the Blue Cloud:
It acts as a visual guide for price movements and stay horizontal when the trend is not moving up
Sell Signals and Visualization
Signal Trigger:
A sell signal is generated when one of the defined Sell Conditions is met (e.g., RSI <50, CMF <0, price below EMA50).
Visual Representation:
A red downward arrow appears at the candle where the sell condition is triggered.
A red cloud forms below the price candles, representing the strength of the bearish trend. Like the blue cloud, it uses the UVR calculation to dynamically mark resistance zones or potential retracement levels.
Purpose of the Red Cloud:
It acts as a visual guide for price movements and stay horizontal when the trend is not moving down.
CONCLUSION
The UVR Crypto Trend indicator provides a powerful tool for trend reversal detection by combining volatility analysis, momentum confirmation, and trend-following techniques. Its unique use of the Ultimate Volatility Rate (UVR) as a core element, supported by proven indicators like RSI, CMF, and EMA, ensures reliable and actionable signals tailored for the crypto market's dynamic nature. By leveraging UVR’s high and low price range analysis, it achieves a level of precision that traditional indicators lack, making it a high-performing system for cryptocurrency traders.

Turtle Trade Channels Indicator with EMATurtle Trade Channels Indicator with EMA (TuTCI + EMA)
This custom indicator combines the classic Turtle Trading Channel strategy with an Exponential Moving Average (EMA) filter to provide clear entry and exit signals, as well as trend direction guidance.
Features:
Turtle Channels: The indicator calculates the upper and lower Turtle Trading Channels based on the highest and lowest values over a user-defined period ( Entry Length for the channel).
Entry/Exit Signals: Alerts you to potential buy and sell opportunities with visual signals on the chart.
Long Entry: When the price crosses above the upper channel.
Short Entry: When the price crosses below the lower channel.
Long Exit: When the price breaks below the exit line.
Short Exit: When the price breaks above the exit line.
EMA Filter: A 50-period Exponential Moving Average (EMA) is included to identify the overall trend. The background color turns green when the price is above the EMA (bullish trend) and red when the price is below the EMA (bearish trend).
Highlighter: Optional background highlighting for the most relevant signals, such as when the price crosses the upper or lower Turtle Channel. This feature helps to easily identify key market movements.
Visual Customization: Customize the EMA length, Entry/Exit lengths, and toggle signals and highlighting to suit your preferences.
How It Works:
The Turtle Trade Channels are designed to capture breakouts by identifying key price levels (highest high and lowest low) over a specified period. By combining this strategy with an EMA, the indicator ensures trades are aligned with the broader trend, increasing the probability of successful trades.
Uptrend: When the price is above the EMA, the indicator considers the trend to be bullish, and it highlights long entry signals.
Downtrend: When the price is below the EMA, the trend is considered bearish, and short entries are emphasized.
Customization:
Entry Length: Adjusts the period for calculating the Turtle Channel's entry levels.
Exit Length: Defines the period for calculating the exit levels.
EMA Length: The period for the Exponential Moving Average (default is set to 50).
Show Entry/Exit Signals: Toggle the visibility of entry/exit signals on the chart.
Highlighter On/Off: Toggle background highlighting for key signals.
This indicator is suitable for traders who follow trend-following strategies, particularly those influenced by the Turtle Trading methodology, and wish to use an EMA filter for better trend confirmation.
Use Cases:
Trend-following traders looking for clear entry/exit signals.
Breakout traders using the Turtle Trading concept to identify price breakouts.
Swing traders who want to incorporate trend analysis with price levels.

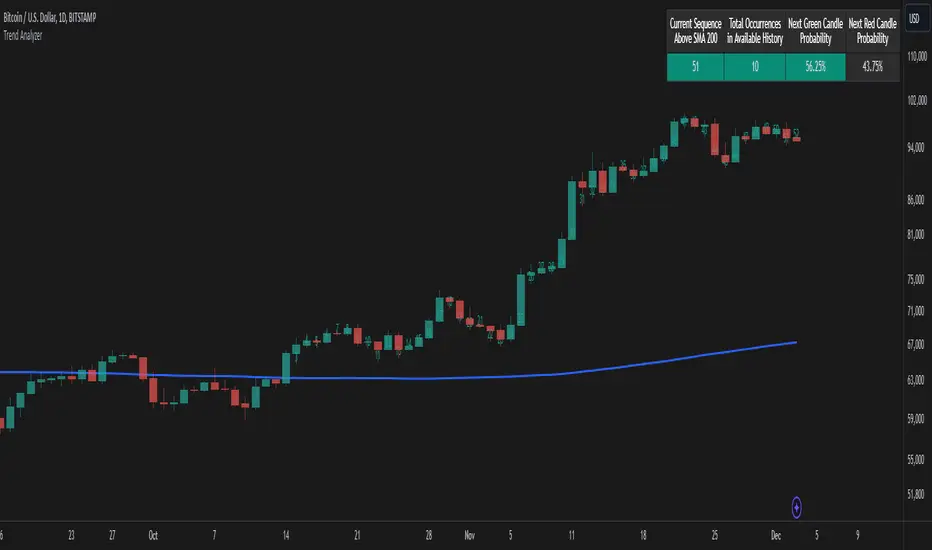
Trend AnalyzerThe Trend Analyzer is designed to help traders identify and analyze market trends. Here's a simple explanation of its logic:
Main Features
Customizable Moving Average: The indicator plots a moving average on the chart. Users can choose from various types (SMA, EMA, WMA, VWMA, HMA, SMMA, TMA) and set the period. This flexibility allows traders to adapt the indicator to different trading styles and timeframes.
Trend Detection: It determines whether the current price is above or below the moving average, providing a clear visual representation of the current trend direction.
Sequence Counter: The indicator counts consecutive candles above or below the moving average. This feature helps traders identify trend strength and persistence, which can be crucial for timing entries and exits.
Statistical Analysis: It calculates probabilities for the next candle's direction based on historical data. This unique feature gives traders a statistical edge in predicting short-term price movements.
Visual Candle Counter: An optional feature that displays the number of consecutive candles above or below the moving average directly on the chart, enhancing visual analysis.
How It Works
The indicator continuously tracks the position of price relative to the chosen moving average.
It maintains a count of how many candles in a row have been above or below the moving average.
For each sequence length, it records historical data on how often the trend continued or reversed in the past.
This historical data is used to calculate probabilities for the next candle's direction, providing a statistical insight into potential price movements.
The indicator displays this information directly on the chart, allowing for quick and easy interpretation.
Practical Applications
Trend Confirmation: Use the indicator to confirm the strength and direction of current trends.
Entry and Exit Signals: The sequence counter and probability calculations can help in timing trades more effectively.
Risk Management: Understanding the statistical likelihood of trend continuation can aid in setting appropriate stop-loss and take-profit levels.
Market Analysis: The indicator provides valuable insights into market behavior and can be used for both short-term and long-term analysis.
While the Trend Analyzer provides valuable insights based on historical data and statistical analysis, it's important to remember that past performance does not guarantee future results. The financial markets are complex and influenced by numerous factors. This indicator should be used as part of a comprehensive trading strategy and not as a sole decision-making tool. Always practice proper risk management and consider seeking advice from financial professionals before making investment decisions.
UVR ChannelsUVR CHANNELS: A VOLATILITY-BASED TREND ANALYSIS TOOL
PURPOSE
UVR Channels are designed to dynamically measure market volatility and identify key price levels for potential trend reversals. The channels are calculated using a unique volatility formula(UVR) combined with an EMA as the central reference point. This approach provides traders with a tool for evaluating trends, reversals, and market conditions such as breakouts or consolidations.
CALCULATION MECHANISM
1. Ultimate Volatility Rate (UVR) Calculation:
The UVR is a custom measure of volatility that highlights significant price movements by comparing the extremes of current and previous candles.
Volatility Components:
Two values are calculated to represent potential price fluctuations:
The absolute difference between the current candle's high and the previous candle's low:
Volatility Component 1=∣high−low ∣
The absolute difference between the previous candle's high and the current candle's low:
Volatility Component 2=∣high −low∣
Volatility Ratio:
The larger of the two components is selected as the Volatility Ratio, ensuring the UVR captures the most significant movement:
Volatility Ratio=max(Volatility Component 1,Volatility Component 2)
Smoothing with SMMA:
To stabilize the volatility calculation, the Volatility Ratio is smoothed using a Smoothed Moving Average (SMMA) over a user-defined period (e.g., 14 candles):
UVR= (UVR(Previous) × (Period−1))+Volatility Ratio)/Period
2. Band Construction:
The UVR is integrated into the band calculations by using the Exponential Moving Average (EMA) as the central line:
Central Line (EMA):
The EMA is calculated based on closing prices over a user-defined period (e.g., 20 candles).
Upper Band:
The upper band represents a dynamic resistance level, calculated as:
Upper Band=EMA+(UVR × Multiplier)
Lower Band:
The lower band serves as a dynamic support level, calculated as:
Lower Band=EMA−(UVR × Multiplier)
3. Role of the Multiplier:
The Multiplier adjusts the width of the bands based on trader preferences:
Higher Multiplier: Wider bands to capture larger price swings.
Lower Multiplier: Narrower bands for tighter market analysis.
FEATURES AND USAGE
Dynamic Volatility Analysis:
The UVR Channels expand and contract based on real-time market volatility, offering a dynamic framework for identifying potential price trends.
Expanding Bands: High market volatility.
Contracting Bands: Low volatility or consolidation.
Trend Identification:
Price consistently near the upper band indicates a strong bullish trend.
Price near the lower band signals a bearish trend.
Trend Reversal Signals:
Price reaching the upper band may signal overbought conditions, while price touching the lower band may signal oversold conditions.
Breakout Potential:
Narrow bands often precede significant price breakouts, making UVR Channels a useful tool for spotting early breakout conditions.
DIFFERENCES FROM BOLLINGER BANDS
Unlike Bollinger Bands, which rely on standard deviation to measure volatility, the UVR Channels use a custom volatility formula based on price extremes (highs and lows). This approach adapts to market behaviour in a unique way, providing traders with an alternative and accurate view of volatility and trends.
INPUT PARAMETERS
Volatility Period:
Determines the number of periods used to smooth the volatility ratio. A higher value results in smoother bands but may lag behind sudden market changes.
EMA Period:
Controls the calculation of the central reference line.
Multiplier:
Adjusts the width of the bands. Increasing the multiplier widens the bands, capturing larger price movements, while decreasing it narrows the bands for tighter analysis.
VISUALIZATION
Purple Line: The EMA (central line).
Red Line: Upper band (dynamic resistance).
Green Line: Lower band (dynamic support).
Shaded Area: Fills the space between the upper and lower bands, visually highlighting the channel.

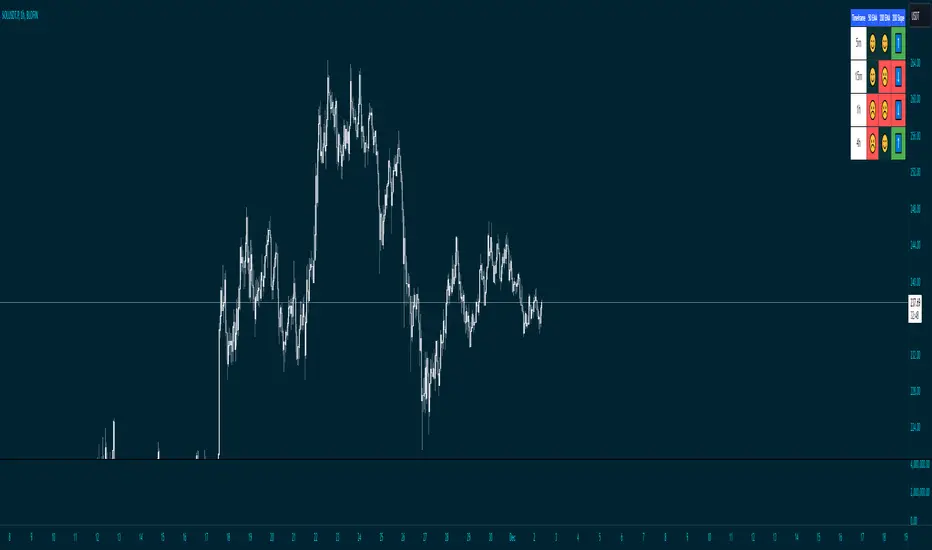
Price Above 50 and 200 EMA with Smiley faces and 200 ema slope
Overview
This advanced indicator provides a comprehensive multi-timeframe analysis of price positioning relative to 50 and 200 Exponential Moving Averages (EMAs), offering traders a quick and intuitive view of market trends across different timeframes.
Key Features
Multi-Timeframe Analysis: Simultaneously evaluates price behavior across 5m, 15m, and other selected timeframes
EMA Trend Visualization: Instantly shows whether price is above or below 50 and 200 EMAs
Slope Direction Indicator: Tracks the directional momentum of the 200 EMA
Customizable Distance Metrics: Option to display distances as absolute values or percentages
Emoji-Based Indicators: Quick visual representation of price positioning
Functionality
The indicator uses color-coded and emoji-based signals to represent:
😊 (Blue): Price is above the EMA
☹️ (Red): Price is below the EMA
⬆️ (Blue): EMA slope is positive
⬇️ (Red): EMA slope is negative
Customization Options
Adjustable EMA periods
Togglable distance display
Distance representation (percentage or absolute value)
Best Used For
Trend identification
Multi-timeframe analysis
Quick market sentiment assessment
Supplementing other technical analysis tools
Recommended Timeframes
Intraday trading
Swing trading
Trend following strategies
Risk Disclaimer
This indicator is a tool for analysis and should not be used in isolation for trading decisions. Always combine with other technical and fundamental analysis, and proper risk management.
Daily Moving Averages on Intraday ChartsThis moving average script displays the chosen 5 daily moving averages on intraday (minute) charts. It automatically adjusts the intervals to show the proper moving averages.
In a day there are 375 trading minutes from 9:15 AM to 3:30PM in Indian market. In 5 days there are 1875 minutes. For other markets adjust this data accordingly.
If 5DMA is chosen on a five minute chart the moving average will use 375 interval values (1875/5 = 375) of 5minute chart to calculate moving average. Same 5DMA on 25minute chart will use 75 interval values (1875/25 = 75).
On a 1minute chart the 5DMA plot will use 1875 interval values to arrive at the moving average.
Since tradingview only allows 5000 intervals to lookback, if a particular daily moving average on intraday chart needs more than 5000 candle data it won't be shown. E.g 200DMA on 5minute chart needs 15000 candles data to plot a correct 200DMA line. Anything less than that would give incorrect moving average and hence it won't be shown on the chart.
MA crossover for the first two MAs is provided. If you want to use that option, make sure you give the moving averages in the correct order.
You can enhance this script and use it in any way you please as long as you make it opensource on TradingView. Feedback and improvement suggestions are welcome.
Special thanks to @JohnMuchow for his moving averages script for all timeframes.

TMA Bands TMA (Triangular Moving Average):
Üçgen hareketli ortalamalar, fiyat verilerini yumuşatarak trendi daha net göstermek için kullanılır.
"Centered Asymmetric Bands" terimi, bu indikatörün merkezlenmiş bir yapıda çalıştığını ve farklı genişliklerde bantlar içerdiğini gösteriyor.

Stock_Cloud-EMA,VWAP,ST Indicator_V1Stock_Cloud V1 - EMA, VWAP, SuperTrend Strategy Indicator
This indicator combines three powerful technical indicators (EMA, VWAP, and SuperTrend) to create a comprehensive trading system that helps identify high-probability trading setups when all components align.
Strategy Components & Logic:
• EMA (Exponential Moving Average): Acts as a dynamic support/resistance and trend direction indicator
• VWAP (Volume Weighted Average Price): Provides important institutional price levels and volume-based trend strength
• SuperTrend: Offers trend direction and potential reversal points
Why These Components Work Together:
1. EMA filters out market noise while maintaining responsiveness to price changes
2. VWAP adds volume-based price validation, especially useful for intraday trading
3. SuperTrend confirms trend direction and potential reversal points
4. When all three indicators align, it creates a high-probability setup
Signal Generation:
• Bullish Signal: Generated when price crosses above all three indicators (EMA, VWAP, and SuperTrend turns bullish)
• Bearish Signal: Generated when price crosses below all three indicators (EMA, VWAP, and SuperTrend turns bearish)
• Background color changes help visualize the current market condition
Settings:
- EMA Length: 20 (default, adjustable)
- SuperTrend Period: 10 (default, adjustable)
- SuperTrend Multiplier: 3.0 (default, adjustable)
How to Use:
1. Look for potential entries when all three indicators align
2. Small triangles mark key entry points when alignment occurs
3. Use background color as additional confirmation
4. Monitor price action relative to all three indicators for exit signals
Best Timeframes:
Works well on all timeframes, but particularly effective on 5-minute to daily charts for stocks and indices.
Note: This indicator combines traditional technical analysis tools in a unique way to provide clear, actionable signals. Always use proper risk management and consider other factors like market conditions and support/resistance levels.
Created by Stock_Cloud
Version 2.0

Correlation Confluence Trend IndicatorCorrelation Confluence Trend Indicator
Overview
The Correlation Confluence Trend Indicator combines exponential moving averages (EMAs) and statistical correlation measures to identify high-confidence trend alignments between an asset and a benchmark. By filtering signals through correlation strength, this indicator highlights opportunities when the asset and benchmark move together. In other words, it defines a trend and then uses correlation strength and the trend of a second asset to identify high-confidence trends.
Key Features
Dual EMA Trend Analysis :
Calculates fast and slow EMAs for both the asset and the selected benchmark (e.g., SPY) to identify bullish and bearish trends.
Correlation Strength Filtering :
Evaluates correlation between the asset and benchmark, identifying stronger-than-average relationships based on the mean and standard deviation.
Background Color Coding :
- Green : Strong correlation, both asset and benchmark bullish.
- Aqua : Weak correlation, both asset and benchmark bullish.
- Red : Strong correlation, both asset and benchmark bearish.
- Fuchsia : Weak correlation, both asset and benchmark bearish.
- Orange : Strong correlation, benchmark bullish, asset bearish.
- Yellow : Weak correlation, benchmark bullish, asset bearish.
- Purple : Strong correlation, benchmark bearish, asset bullish.
- Lime : Weak correlation, benchmark bearish, asset bullish.
Visual Trend Indicators :
Plots fast and slow EMAs for the asset, dynamically colored based on aggregate trend signals. The color of this corresponds to the main trend signal.
Inputs
Benchmark Symbol : Symbol of the benchmark asset to compare against.
Fast EMA Length : Period for the fast EMA calculation.
Slow EMA Length : Period for the slow EMA calculation.
Correlation Length : Number of bars for correlation calculation.
Correlation Mean Length : Number of bars for mean and standard deviation calculation.
Std Dev Multiplier : Multiplier for standard deviation to define correlation strength. When the correlation is Std Dev Multiplier standard deviations above the mean, it counts as a strong correlation.
Set Background Color : Toggle background coloring on or off.
Notes
This indicator is primarily designed for trend-following strategies. By combining trend analysis and correlation filtering, it ensures that signals occur during aligned market conditions, reducing false signals.
Before incorporating this indicator into your trading strategy:
Always backtest on historical data to evaluate its performance before committing capital.
Use proper risk management to control position sizes and mitigate potential losses.
Remember that no indicator guarantees success. I'm quite proud of this one, but it's not the holy grail.

Previous Day and Current Day High/LowKey Features:
Previous Day High and Low Lines:
Displays the high (PDH) and low (PDL) levels of the previous trading day.
Allows customization of line colors, styles (solid, dashed, or dotted), and widths.
Extends these lines by a specified number of candles into the current day for better visualization.
Current Day High and Low Lines:
Displays the high (CDH) and low (CDL) levels during the current day's regular trading hours.
Customizable line attributes, including color, style, width, and extension length.
Customizable Input Options:
User-configurable settings for both the previous and current day high/low lines, grouped under respective sections for clarity.
Regular trading hours can be defined manually (default is 9:30 AM to 4:00 PM).
Ability to toggle the visibility of the lines for both the previous and current days.
Automatic Reset at the Start of a New Day:
Captures the high and low values of the completed day and resets for the new day.
Deletes old lines and labels to ensure clarity and avoid overlap.
Dynamic Updates:
Updates the current day's high and low lines and labels as new data comes in.
Adjusts previous day lines dynamically based on the user-defined number of candles to extend.
Session-Based Filtering:
Ensures the calculations and updates are restricted to the defined regular trading hours.
Code Logic:
Input Groups: The script uses grouped inputs to allow users to configure settings for previous and current day levels separately.
Line and Label Management: It creates and deletes lines and labels dynamically to prevent clutter and keep the chart organized.
Session Check: Uses the session input to determine if a bar falls within regular trading hours.
High/Low Calculation: Tracks the high and low for both the previous and current days during regular trading hours.
New Day Detection: Identifies the start of a new trading day to update previous day values and reset current day variables.
Applications:
Intraday Trading: Helps traders identify critical support and resistance levels from the previous and current days.
Trend Analysis: Provides visual cues for price movement trends across consecutive days.
Custom Visualization: With extensive customization options, traders can adapt the indicator to suit their trading style and chart aesthetics.
This script is highly configurable, making it versatile for a wide range of trading strategies and styles.

Adaptive Moving AveragesThe Adaptive Moving Averages indicator stands out with several unique features that set it apart from traditional moving average indicators. Its most remarkable characteristic is the ability to automatically adjust the length of moving averages based on the chosen timeframe. This ensures consistency in analysis regardless of the time scale used, eliminating the need for manual recalculation of appropriate periods for each timeframe. It allows for a more fluid and accurate multi-temporal analysis.
Another innovative aspect is the indicator's consideration of different market types (stocks, forex, crypto). This approach recognizes the fundamental differences between these markets in terms of trading hours, allowing for more precise and representative calculations for each asset class. It offers increased flexibility for traders operating across various markets.
The method for calculating periods for different moving averages (week, month, quarter, semester, year) is particularly sophisticated. It takes into account the specifics of each market, such as trading days and opening hours, automatically adapting to timeframe changes. This ensures a more accurate representation of actual trading periods rather than arbitrary approximations.
The indicator offers a wide choice of moving average types, allowing traders to use their preferred method or compare different approaches. This flexibility adapts to various trading styles and technical analysis strategies, offering the possibility to experiment and find the most effective combination for each market or asset.
In conclusion, this indicator distinguishes itself through its ability to intelligently adapt to different trading contexts, offering a versatile and sophisticated solution for technical analysis. Its flexibility and adaptive approach make it a particularly interesting tool for traders seeking consistent analysis across different markets and time scales.

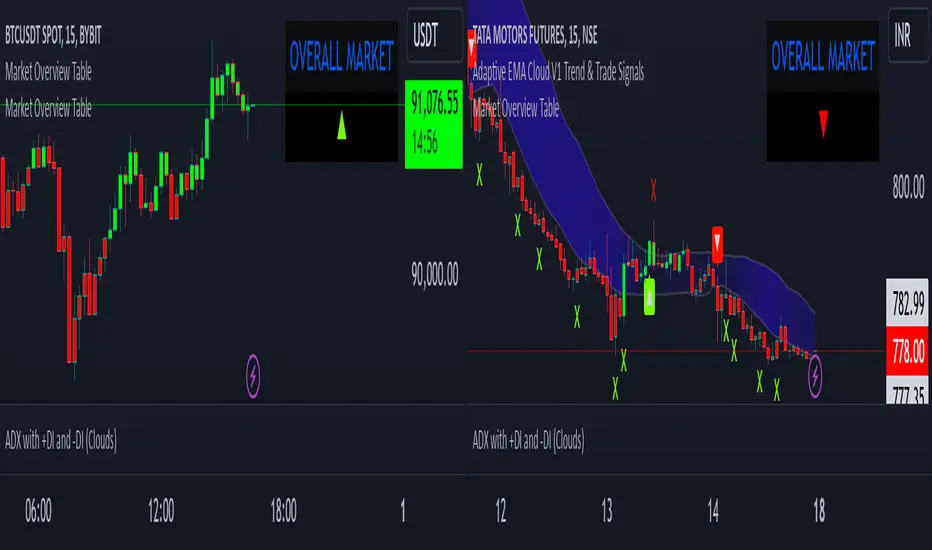
Market Overview TableThis script creates a market overview table that aggregates the signals from seven technical indicators into a single overall market trend. The goal of the table is to provide a quick summary of the market condition based on the combined behavior of multiple popular indicators. Instead of displaying each individual indicator's trend separately, it summarizes them into one overall market signal, displayed as a triangle (either up or down). This simplifies the decision-making process by focusing on an easy-to-read visual cue.
how it works
The table pulls in signals from seven indicators:
rsi (relative strength index): Measures if the asset is overbought (above 70) or oversold (below 30). In this case, the condition checks if the rsi is above 50, indicating a bullish trend.
ema (exponential moving average): A trend-following indicator that gives more weight to recent prices. It checks if the current price is above the ema value, which suggests an upward market trend.
sma (simple moving average): Similar to ema, it calculates the average price over a set period. When the price is above the sma, it indicates a bullish trend.
vwma (volume-weighted moving average): This average takes volume into account. It checks if the price is above the vwma, indicating higher trading activity in the direction of the trend.
bb (bollinger bands): The script compares the price to the upper bollinger band. If the price is above the upper band, it suggests that the price is in an overbought condition, signaling a bullish market.
williams fractals: A pattern recognition indicator that detects market turning points. In this case, it checks if the price is above the fractal high, indicating a bullish breakout.
momentum: Measures the rate of change in price over a set period. If the momentum is positive (price is rising), it indicates a bullish trend.
overall market calculation
The overall market condition is determined by the sum of bullish conditions across all seven indicators. For each indicator, if it shows a bullish signal (e.g., price above the moving average, rsi above 50), it is counted as a bullish indicator. The total number of bullish indicators is then tallied up:
If 4 or more indicators are bullish, the market is considered bullish overall.
If less than 4 indicators are bullish, the market is considered bearish overall.
This method aggregates the data from all seven indicators into a single market trend signal, represented by a triangle.
the triangle
The triangle (▲ or ▼) is used as the visual signal for the overall market trend. If the market is determined to be bullish (4 or more bullish indicators), the triangle will point up (▲), indicating a positive or upward trend. If the market is bearish (fewer than 4 bullish indicators), the triangle will point down (▼), signaling a negative or downward trend.
difference from individual indicators
The main difference between this approach and traditional indicator-based methods is the aggregation of multiple indicators into one simple signal. Instead of displaying seven separate signals for each indicator, which can be overwhelming and difficult to interpret quickly, this table combines them into one clear visual cue for the overall market condition. This makes it easier for traders to make quick decisions without having to analyze each individual indicator in detail.
Here’s what makes this approach unique:
Simplicity: Rather than plotting individual indicator signals on the chart, which can clutter the screen, the table condenses the market’s trend into a single up or down triangle, which is easier to interpret at a glance.
Comprehensive view: By aggregating seven indicators, the table considers multiple aspects of the market (e.g., momentum, trend, volume) to give a more comprehensive view of the market’s behavior, rather than relying on just one or two indicators.
Dynamic nature: As market conditions change and indicators fluctuate, the overall market trend dynamically updates, providing real-time feedback on the market’s direction.
table structure
The table is structured with two columns:
The first column contains the "OVERALL MARKET" label.
The second column displays the triangle (▲ or ▼) indicating the market trend based on the combined signal from all seven indicators.
By keeping it simple and focusing only on the overall market trend, this table allows traders to quickly grasp the market’s condition without having to sift through individual indicator data.
conclusion
This table simplifies the complexity of analyzing multiple indicators by summarizing their signals into a single, easy-to-read visual indicator. It is ideal for traders who want a quick, comprehensive view of market conditions without diving deep into the details of each individual indicator. The approach of aggregating multiple indicators into one overall market trend provides a clearer picture and saves time while maintaining the reliability of a multi-indicator analysis.
Adaptive Range Breakout (ARB) IndicatorTitle: Adaptive Range Breakout (ARB) Indicator – Enhanced Mean Reversion with Dynamic Support/Resistance
Overview: The Adaptive Range Breakout (ARB) Indicator is designed to help traders identify potential mean reversion and breakout opportunities by leveraging a dynamic range based on recent price action and volatility. This script combines key elements such as Volume Profile analysis, ATR-based volatility adjustments, and an EMA trend filter to create a robust and adaptive trading tool. It aims to capture both trend continuations and reversals while filtering out noise in choppy markets.
Justification for Combining Components:
HVN (High Volume Node):
The core of this indicator is built around a custom VWAP calculation over a defined lookback period, which serves as the HVN line (High Volume Node). The HVN represents a volume-weighted average price, highlighting key levels where significant trading activity has occurred. These levels often act as areas of support or resistance, providing a reliable reference point for traders.
ATR-Based Dynamic Support and Resistance:
The Average True Range (ATR) is used to adjust the adaptive support and resistance levels around the HVN line. This ensures that the levels dynamically respond to changes in market volatility. The use of ATR helps filter out insignificant price movements and focuses on significant shifts in momentum, making the indicator adaptive to different market conditions.
EMA Trend Filter:
An Exponential Moving Average (EMA) is applied as a trend filter to distinguish between trending and range-bound market conditions. This filter helps in identifying whether the price movement is in line with the overall trend or if a potential reversal is more likely. By using the EMA crossover signals, the indicator can provide additional confirmation before generating buy or sell signals.
Adaptive Breakout and Mean Reversion Signals:
The indicator generates buy and sell signals based on the interaction between the price and the adaptive support/resistance levels. It incorporates a volatility filter to ensure that signals are only triggered when the market is sufficiently volatile, reducing the likelihood of false signals during low-volatility periods. Additionally, a cooldown period is implemented to prevent consecutive signals in quick succession, enhancing signal reliability.
Key Features:
Dynamic Range Levels: The adaptive support and resistance levels adjust based on recent price action and volatility, providing reliable areas for potential reversals or breakouts.
Volume-Weighted Analysis: The HVN line, derived from a custom VWAP calculation, highlights key price levels with significant trading activity, helping identify zones of support/resistance.
Trend Confirmation: The EMA trend filter helps differentiate between trend-following and mean-reversion signals, providing context for the generated buy and sell signals.
Volatility Filtering: The indicator uses ATR to gauge market volatility, ensuring signals are only generated during active market conditions.
Signal Cooldown: A customizable cooldown period reduces noise by spacing out signals, especially in choppy market environments.
Use Case:
The Adaptive Range Breakout (ARB) Indicator is suitable for traders looking to capitalize on both breakouts and mean-reversion opportunities. It is particularly useful in:
Range-Bound Markets: The adaptive support and resistance levels help capture reversals in range-bound conditions.
Trending Markets: The trend filter and breakout logic allow traders to follow momentum when the price breaks through key adaptive levels.
Intraday and Swing Trading: The dynamic nature of the indicator makes it applicable across different timeframes, catering to both intraday and swing traders.
Important Considerations:
This indicator does not guarantee future performance or provide an infallible prediction of price movements. It is a tool intended to support traders in their decision-making process based on historical price action and market conditions.
The effectiveness of the signals may vary depending on the asset, market conditions, and timeframe used. It is recommended to backtest the indicator and use it alongside other analysis techniques.
Always exercise caution and use appropriate risk management strategies when trading based on signals generated by this indicator.
Alerts: The indicator includes built-in alerts for:
Buy Signal Alert: Triggered when the price crosses above the adaptive support level, suggesting a potential reversal or continuation in an uptrend.
Sell Signal Alert: Triggered when the price crosses below the adaptive resistance level, indicating a potential reversal or continuation in a downtrend.
EMA Crossover Alerts: Alerts for EMA crossover signals, providing additional trend confirmation.
This script is a comprehensive tool designed to adapt to market conditions dynamically, combining multiple techniques to create a well-rounded approach to identifying trading opportunities. We encourage users to integrate it into their broader trading strategy and apply it with caution, understanding its strengths and limitations.

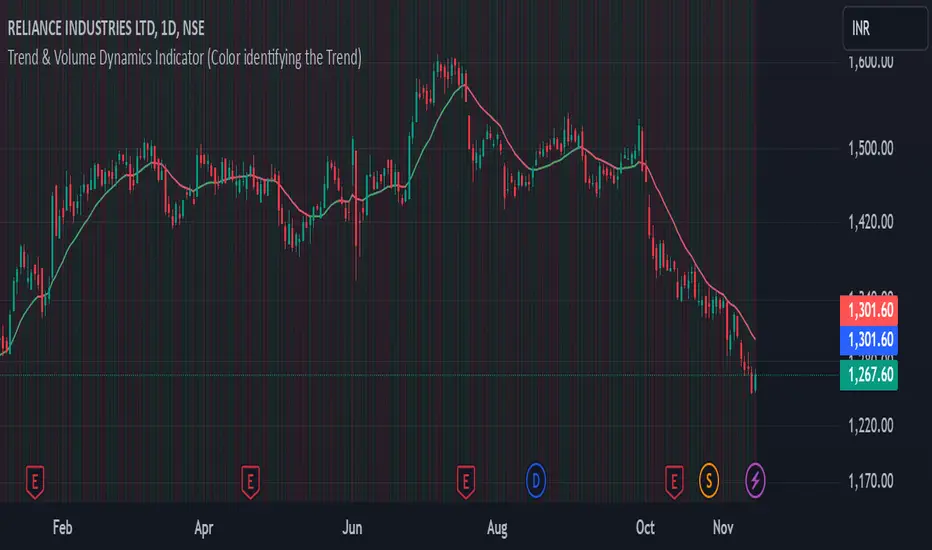
Trend & Volume Dynamics Indicator (Color identifying the Trend)Benefits
1. Trend Identification:
o The script calculates a 20-period Weighted Moving Average (WMA) of the closing prices. This helps in smoothing out price data to identify the underlying trend.
o The color of the WMA line changes based on the price position relative to the WMA:
Green: When the current price is above the WMA, indicating a potential uptrend.
Red: When the current price is below the WMA, indicating a potential downtrend.
Blue: When the price is exactly at the WMA, indicating no clear trend.
2. Volume Dynamics:
o The script also plots the volume with a color-coding mechanism:
Green: When the current volume is higher than the previous period's volume, indicating increasing trading activity.
Red: When the current volume is lower than the previous period's volume, indicating decreasing trading activity.
o The volume bars are plotted with 90% transparency, making them less visually dominant but still informative.
Usage
• Overlay: The indicator is set to overlay=true, meaning it will be plotted directly on the price chart, allowing users to see the WMA and volume dynamics in the context of the price movements.
• WMA Length: The length of the WMA is set to 20 periods, which is a common setting for short to medium-term trend analysis.
• Visual Cues: The color changes in both the WMA and volume bars provide immediate visual cues about the trend and volume dynamics, helping traders make quicker decisions.
Detailed Explanation of the Script
1. Indicator Declaration:
o Declares the indicator with a descriptive name and specifies that it should be overlaid on the price chart.
2. WMA Calculation:
o Defines the length of the WMA and calculates it using the closing prices.
3. Plotting the WMA:
o Plots the WMA with full brightness (0 transparency).
4. Color-Coding the WMA:
o Changes the color of the WMA line based on the price's position relative to the WMA.
5. Volume Indicator:
o Plots the volume bars with color-coding based on the volume change from the previous period and with 90% transparency.
Conclusion
One of the most best combinations of Volume and Moving average and works on any given timeframe and charts
Scalp System# Scalp System
A premium scalping system designed specifically for 2-minute charts, combining multiple timeframe analysis with trend-based trading decisions. This indicator helps identify high-probability scalping opportunities through color-coded moving averages and their crossovers.
## Strategy Overview
### Entry Signals
- ONLY trade LONG when price is above RED line
- ONLY trade SHORT when price is below RED line
- Primary entry: BLUE/GREEN crosses
- Strong trend confirmation: YELLOW/PURPLE crosses
### Best Practices
1. Trade with the trend (follow RED line direction)
2. Wait for price pullbacks of faster lines
3. Combine crosses with support/resistance levels
4. Use smaller targets
5. Quick exits on failed breakouts
6. Monitor volume for confirmation
### Color Guide
- YELLOW: Fast trend identifier
- BLUE: Very short-term momentum (1min)
- GREEN: Short-term momentum (3min)
- RED: Trend filter
- PURPLE: Strong trend baseline
### Risk Management
- Place stops beyond the RED line
- Scale out at key levels
- Use 1:1.5 minimum risk/reward
- Avoid trading during major news
- Reduce position size in choppy markets
### Best Trading Hours
- Most effective during first 2 hours after market open
- Good opportunities during power hour (last hour)
- Avoid lunch hour chop (11:30-1:30 EST)
## Tips
- Less is more - wait for clean setups
- Respect the RED line as your trend filter
- Multiple timeframe confirmation increases success rate
- Use crosses as triggers, not absolute signals
- Practice in simulator before live trading

Unique Trend Meter
this unique trend meter indicator is designed to provide a comprehensive view of market trends based on the interaction of multiple moving averages and the linear regression line. unlike other indicators that only focus on a single type of trend-following line, this strategy combines four different lines: the exponential moving average (ema), simple moving average (sma), volume-weighted moving average (vwma), and linear regression (linreg). by normalizing their values to a consistent scale of 0-5000, the indicator ensures that these lines are comparable, allowing for better trend analysis and decision-making.
key features and differences:
multiple trend lines: the indicator uses four different types of moving averages, offering a broader and more nuanced view of the market. while other indicators might only use one type, this strategy combines ema, sma, vwma, and linreg to capture various market behaviors.
normalization to 0-5000 scale: each of the moving averages is normalized to a 0-5000 scale. this allows for consistent comparisons across different lines and ensures that each trend line can be analyzed on a uniform range, making it easier to detect significant changes.
zone identification: this indicator doesn't directly generate buy or sell signals; instead, it focuses on identifying zones. when the linreg line crosses above all the other moving averages, it signals a potential bull zone, and when it crosses below, it indicates a bear zone. these zones represent areas where market conditions are favorable for either buying or selling, but they are not definitive trade signals.
background color: the background color changes dynamically based on the positions of the lines. when all the lines are above 1000, the background turns green, indicating a bullish environment. when they fall below 4000, the background turns red, signaling a bearish environment. this visual cue helps traders quickly identify the prevailing market sentiment.
crossover detection: the indicator also detects when the linreg line crosses above or below the other lines, indicating potential shifts in market direction. these crossovers can serve as a signal for traders to pay closer attention to the current trend, even though they are not directly tradable signals.
no tables or unnecessary clutter: unlike some other indicators that include tables or complex elements, this one is designed to be as simple and clean as possible, focusing on the trend lines and background color for easy interpretation.
main purpose of the indicator: this unique trend meter is primarily focused on identifying zones (bull and bear zones) based on the behavior of four key moving averages. it’s not intended to provide direct buy or sell signals but instead helps traders understand when the market is in a bullish or bearish environment based on the interaction of multiple trend lines. traders can use these zones to make more informed decisions, aligning their trades with the overall market trend.
in summary, this indicator offers a holistic view of market trends, giving traders a clearer understanding of when to anticipate a potential shift in market conditions. its emphasis on zones, combined with the use of multiple trend lines, makes it stand out from other simpler indicators that only rely on one type of moving average or trend-following line.
