Multifactor Buy/Sell Strategy V2 | RSI, MACD, ATR, EMA, Boll.BITGET:1INCHUSDT
This Pine Script code for TradingView is a multifactor Buy/Sell indicator that combines several technical factors to generate trading signals based on trend, volatility, and volume conditions. Here’s a breakdown of the main components and functionality:
Indicator Name
- Multifactor Buy/Sell Strategy V2 — an overlay indicator applied directly on the price chart.
### Input Parameters
The script includes multiple customizable parameters:
- RSI, EMA, MACD parameters — for setting periods and signals of MACD and RSI.
- ATR and Bollinger Bands — used for volatility analysis and level determination.
- Minimum Volatility Threshold — sets a minimum Bollinger Band width threshold for determining high volatility.
Core Indicators
1. RSI — calculated to identify oversold (below 30) and overbought (above 70) conditions.
2. EMA and MACD — calculates exponential moving averages and MACD histogram to determine trend direction.
3. ATR and Bollinger Bands — used to assess current volatility and establish dynamic upper and lower bands.
Volatility and Volume Analysis
- Determines the current ATR level and Bollinger Band width to evaluate high volatility.
- Calculates the volume moving average to track periods of increased volume during high volatility.
Trend Analysis
The script uses the difference between fast and slow EMAs to define strong trends:
- Uptrend — when the fast EMA is above the slow EMA, the price is above the fast EMA, and the trend is strong.
- Downtrend — when the fast EMA is below the slow EMA, the price is below the fast EMA, and the trend is strong.
Momentum Filter
- Based on the price change over the last three bars and compared against the minimum volatility threshold to identify strong momentum.
Buy and Sell Signal Generation
- Buy Signal: Uptrend with RSI oversold, positive MACD histogram, high volatility and volume, strong momentum, and sufficient Bollinger Band width.
- Sell Signal: Downtrend with RSI overbought, negative MACD histogram, high volatility and volume, strong momentum, and sufficient Bollinger Band width.
Visualization
- Buy and sell signals are displayed as green and red triangles on the chart.
- Plots for fast and slow EMAs, upper and lower bands, and Bollinger Bands.
Alerts
The script includes alert conditions for buy and sell signals, allowing notifications to be sent via email or mobile app.
Information Panel
A small table on the chart displays current volatility dataThis Pine Script code for TradingView is a multifactor Buy/Sell indicator that combines several technical factors to generate trading signals based on trend, volatility, and volume conditions. Here’s a breakdown of the main components and functionality:
Indicator Name
- Multifactor Buy/Sell Strategy V2 — an overlay indicator applied directly on the price chart.
Input Parameters
The script includes multiple customizable parameters:
- **RSI, EMA, MACD parameters** — for setting periods and signals of MACD and RSI.
- **ATR and Bollinger Bands** — used for volatility analysis and level determination.
- **Minimum Volatility Threshold** — sets a minimum Bollinger Band width threshold for determining high volatility.
Core Indicators
1. RSI — calculated to identify oversold (below 30) and overbought (above 70) conditions.
2. EMA and MACD — calculates exponential moving averages and MACD histogram to determine trend direction.
3. ATR and Bollinger Bands — used to assess current volatility and establish dynamic upper and lower bands.
Volatility and Volume Analysis
- Determines the current ATR level and Bollinger Band width to evaluate high volatility.
- Calculates the volume moving average to track periods of increased volume during high volatility.
Trend Analysis
The script uses the difference between fast and slow EMAs to define strong trends:
- Uptrend — when the fast EMA is above the slow EMA, the price is above the fast EMA, and the trend is strong.
- Downtrend — when the fast EMA is below the slow EMA, the price is below the fast EMA, and the trend is strong.
Momentum Filter
- Based on the price change over the last three bars and compared against the minimum volatility threshold to identify strong momentum.
Buy and Sell Signal Generation
- Buy Signal: Uptrend with RSI oversold, positive MACD histogram, high volatility and volume, strong momentum, and sufficient Bollinger Band width.
- Sell Signal: Downtrend with RSI overbought, negative MACD histogram, high volatility and volume, strong momentum, and sufficient Bollinger Band width.
Visualization
- Buy and sell signals are displayed as green and red triangles on the chart.
- Plots for fast and slow EMAs, upper and lower bands, and Bollinger Bands.
Alerts
The script includes alert conditions for buy and sell signals, allowing notifications to be sent via email or mobile app.
Information Panel
A small table on the chart displays current volatility
- Volatility Status — indicates high or low volatility.
- Bollinger Band Width — current width as a percentage.
- ATR Ratio — ratio of current ATR to long-term average ATR.
This script is suitable for trading in high-volatility conditions, combining multiple filters and factors to generate precise buy and sell signals.
指數移動平均線(EMA)

MERCURY by DrAbhiramSivprasad"MERCURY by DrAbhiramSivprasad"
Developed from over 10 years of personal trading experience, the Mercury Indicator is a strategic tool designed to enhance accuracy in trading decisions. Think of it as a guiding light—a supportive tool that helps traders refine and build more robust strategies by integrating multiple powerful elements into a single indicator. I’ll be sharing some examples to illustrate how I use this indicator in my own trading journey, highlighting its potential to improve strategy accuracy.
Reason behind the combination of emas , cpr and vwap is it provides very good support and resistance in my trading carrier so now i brought them together in one plate
How It Works:
Mercury combines three essential elements—EMA, VWAP, and CPR—each of which plays a vital role in detecting support and resistance:
Exponential Moving Averages (EMAs): Known for their strength in providing dynamic support and resistance levels, EMAs help in identifying trends and shifts in momentum. This indicator includes a dashboard with up to nine customizable EMAs, showing whether each is acting as support or resistance based on real-time price movement.
Volume Weighted Average Price (VWAP): VWAP also provides valuable support and resistance, often regarded as a fair price level by institutional traders. Paired with EMAs, it forms a dual-layered support/resistance system, adding an additional level of confirmation.
Central Pivot Range (CPR): By combining CPR with EMAs and VWAP, Mercury highlights “traffic blocks” in your target journey. This means it identifies zones where price is likely to stall or reverse, providing additional guidance for navigating entries and exits.
Why This Combination Matters:
Using these three tools together gives you a more complete view of the market. VWAP and EMAs offer dynamic trend direction and support/resistance, while CPR pinpoints critical price zones. This combination helps you find high-probability trades, adding clarity to complex market situations and enabling stronger confirmation on trend or reversal decisions.
How to Use:
Trend Confirmation: Check if all EMAs are aligned (green for uptrend, red for downtrend), which is visible in the EMA dashboard. An alignment across VWAP, CPR, and EMAs signifies high confidence in trend direction.
Breakouts & Breakdowns: Mercury has an alert system to signal when a price breakout or breakdown occurs across VWAP, EMA1, and EMA2. This can help in spotting strong directional moves.
Example Application: In my trading, I use Mercury to identify support/resistance zones, confirming trends with EMA/VWAP alignment and using CPR as a checkpoint. I find this especially useful for day trading and swing setups.
Recommended Timeframes:
Day Trading: 5 to 15-minute charts for swift, actionable insights.
Swing Trading: 1-hour or 4-hour charts for broader trend analysis.
Note:
The Mercury Indicator should be used as a supportive tool rather than a standalone strategy, guiding you toward informed decisions in line with your trading style and goals.
EXAMPLE OF TRADE
you can see the cart of XAUUSD on 11th nov 2024
1.SHORT POSITION - TIME FRAME 15 MIN
So here for a short position you need to wait for a breakdown candle which will print in orange post the candle you need to check ema dashboard is completly red that indicates no traffic blocks in your journey to destiny target from ema's and you can take the target from nearest cpr support line
TAKEN IN XAUUSD you can see in chart of XAUUSD on 7th nov
2.LONG POSITION - TIME FRAME 15 MIN -
So here for long position you need to wait for a breakout candle from indicator thats here is blue and check all ema boxes are green and candle body should close above all the 3 lines here it is the both ema 1 and 2 and the vwap line then you can take and entry and your target will be the nearest resistance from the daily cpr
3. STOP LOSS CRITERIA
After the entry any candle close below any of the last line from entry for example we have 3 lines vwap and ema 1 and 2 lines and u have made an entry and the last line before the entry is vwap then if any candle closes below vwap can be considered as stoploss like wise in any lines
The MERCURY indicator is a comprehensive trading tool designed to enhance traders' ability to identify trends, breakouts, and reversals effectively. Created by Dr. Abhiram Sivprasad, this indicator integrates several technical elements, including Central Pivot Range (CPR), EMA crossovers, VWAP levels, and a table-based EMA dashboard, to offer a holistic trading view.
Core Components and Functionality:
Central Pivot Range (CPR):
The CPR in MERCURY provides a central pivot level along with Below Central (BC) and Top Central (TC) pivots. These levels act as potential support and resistance, useful for identifying reversal points and zones where price may consolidate.
Exponential Moving Averages (EMAs):
MERCURY includes up to nine EMAs, with a customizable EMA crossover alert system. This feature enables traders to see shifts in trend direction, especially when shorter EMAs cross longer ones.
VWAP (Volume-Weighted Average Price):
VWAP is incorporated as a dynamic support/resistance level and, combined with EMA crossovers, helps refine entry and exit points for higher probability trades.
Breakout and Breakdown Alerts:
MERCURY monitors conditions for upside and downside breakouts. For an upside breakout, all EMAs turn green and a candle closes above VWAP, EMA1, and EMA2. Similarly, all EMAs turning red, combined with a close below VWAP and EMA1/EMA2, signals a downside breakdown. Continuous alerts are available until the trend shifts.
Real-Time EMA Dashboard:
A table displays each EMA’s relative position (Above or Below), helping traders quickly gauge trend direction. Colors in the table adjust to long/short conditions based on EMA alignment.
Usage Recommendations:
Trend Confirmation:
Use the CPR, EMA alignments, and VWAP to confirm uptrends and downtrends. The table highlights trends, making it easy to spot long or short setups at a glance.
Breakout and Breakdown Alerts:
The alert system is customizable for continuous notifications on critical price levels. When all EMAs align in one direction (green for long, red for short) and the close is above or below VWAP and key EMAs, the indicator confirms a breakout/breakdown.
Adaptable for Different Styles:
Day Trading: Traders can set shorter EMAs for quick insights.
Swing Trading: Longer EMAs combined with CPR offer insights into sustained trends.
Recommended Settings:
Timeframes: MERCURY is suitable for timeframes as low as 5 minutes for intraday traders, up to daily charts for trend analysis.
Symbols: Works across forex, stocks, and crypto. Adjust EMA lengths for asset volatility.
Example Strategy:
Long Entry: When the price crosses above CPR and closes above both EMA1 and EMA2.
Short Entry: When the price falls below CPR with a close below both EMA1 and EMA2.

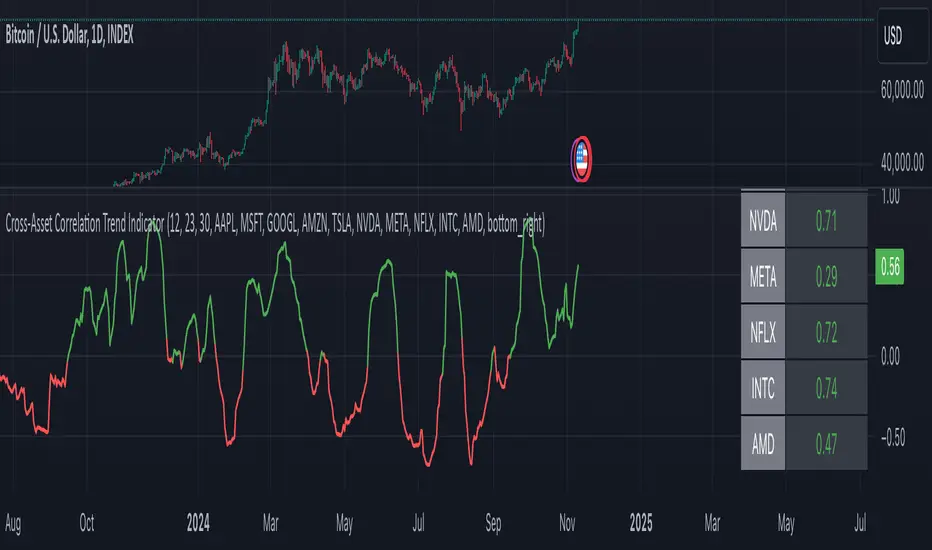
Cross-Asset Correlation Trend IndicatorCross-Asset Correlation Trend Indicator
This indicator uses correlations between the charted asset and ten others to calculate an overall trend prediction. Each ticker is configurable, and by analyzing the trend of each asset, the indicator predicts an average trend for the main asset on the chart. The strength of each asset's trend is weighted by its correlation to the charted asset, resulting in a single average trend signal. This can be a rather robust and effective signal, though it is often slow.
Functionality Overview :
The Cross-Asset Correlation Trend Indicator calculates the average trend of a charted asset based on the correlation and trend of up to ten other assets. Each asset is assigned a trend signal using a simple EMA crossover method (two customizable EMAs). If the shorter EMA crosses above the longer one, the asset trend is marked as positive; if it crosses below, the trend is negative. Each trend is then weighted by the correlation coefficient between that asset’s closing price and the charted asset’s closing price. The final output is an average weighted trend signal, which combines each trend with its respective correlation weight.
Input Parameters :
EMA 1 Length : Sets the period of the shorter EMA used to determine trends.
EMA 2 Length : Sets the period of the longer EMA used to determine trends.
Correlation Length : Defines the lookback period used for calculating the correlation between the charted asset and each of the other selected assets.
Asset Tickers : Each of the ten tickers is configurable, allowing you to set specific assets to analyze correlations with the charted asset.
Show Trend Table : Toggle to show or hide a table with each asset’s weighted trend. The table displays green, red, or white text for each weighted trend, indicating positive, negative, or neutral trends, respectively.
Table Position : Choose the position of the trend table on the chart.
Recommended Use :
As always, it’s essential to backtest the indicator thoroughly on your chosen asset and timeframe to ensure it aligns with your strategy. Feel free to modify the input parameters as needed—while the defaults work well for me, they may need adjustment to better suit your assets, timeframes, and trading style.
As always, I wish you the best of luck and immense fortune as you develop your systems. May this indicator help you make well-informed, profitable decisions!
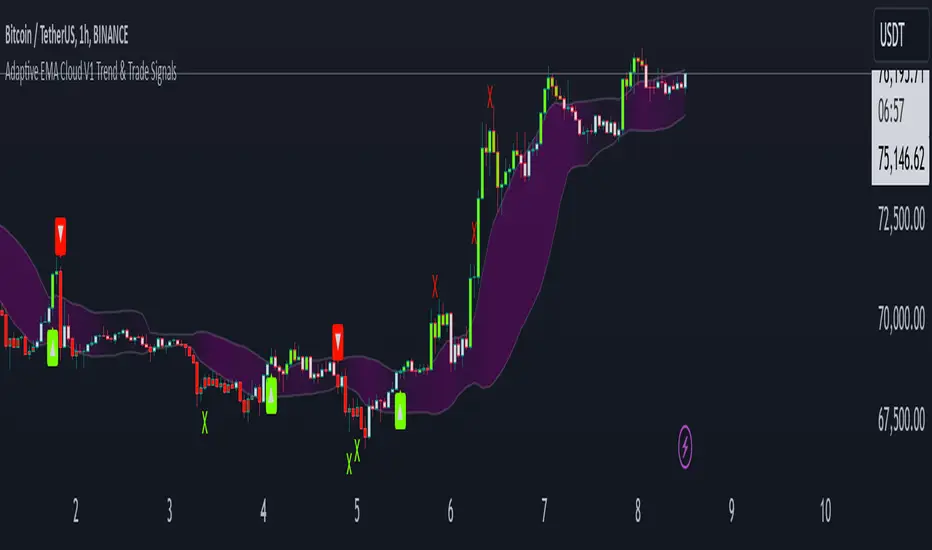
Adaptive ema Cloud v1 Trend & Trade Signals"adaptive ema cloud v1 trend & trade signals" is a comprehensive technical indicator aimed at assisting traders in identifying market trends, trade entry points, and potential take profit (tp) and stop-loss (sl) levels. this indicator combines adaptive exponential moving average (ema) clouds with standard deviation bands to create a visual trend and signal system, enabling users to better analyze price action.
key features:
adaptive ema cloud: calculates a dynamic ema-based cloud using a simple moving average (sma) line, with upper and lower deviation bands based on standard deviations. users can adjust the standard deviation multiplier to modify the cloud's width.
trend direction detection: the indicator determines trend direction by comparing the close price to the ema cloud and signals bullish or bearish trends when the price crosses key levels.
take profit (tp) and stop-loss (sl) points: adaptive tp and sl levels are calculated based on the deviation bands, providing users with suggested exit points when a trade is triggered.
peak and valley detection: detects peaks and valleys in price, aiding traders in spotting potential support and resistance areas.
gradient-based cloud fill: dynamically fills the cloud with a gradient color based on trend strength, helping users visually gauge trend intensity.
trade tracking: tracks recent trades and records them in an internal memory, allowing users to view the last 20 trade outcomes, including whether tp or sl was hit.
how to use:
trend signals: look for green arrows (bullish trend) or red arrows (bearish trend) to identify potential entries based on trend crossovers.
tp/sl management: tp and sl levels are automatically calculated and displayed, with alerts available to notify users when these levels are reached.
adjustable settings: customize period length, standard deviation multiplier, and color preferences to match trading preferences and chart style.
inputs-
period: defines the look-back period for ema calculations.
standard deviation multiplier: adjusts cloud thickness by setting the multiplier for tp and sl bands.
gauge size: scales the gradient intensity for trend cloud visualization.
up/down colors: allows users to set custom colors for bullish and bearish bars.
alert conditions: this script has built-in alerts for trend changes, tp, and sl levels, providing users with automated notifications of important trading signals.
Dynamic Linear CandlesDynamic Linear Candles is a unique and versatile indicator that reimagines traditional candlestick patterns by integrating customizable moving averages directly into candle structures. This dynamic approach smooths the appearance of candlesticks to better highlight trends and suppress minor market noise, allowing traders to focus on essential price movements.
Key Features:
1. Dynamic Candle Smoothing: Choose between popular smoothing types (SMA, EMA, WMA, HMA) to apply directly to each candle’s Open, High, Low, and Close values. This adaptive smoothing reveals hidden trends by refining price action into simplified, flowing candles, ideal for spotting subtle changes in market sentiment.
2. Signal Line Overlay: The signal line provides an additional layer of trend confirmation. Select from SMA, EMA, WMA, or HMA smoothing to match your trading style. The line dynamically changes color based on the price’s relative position, helping traders quickly identify bullish or bearish shifts.
3. Enhanced Candle Visualization: Candles adjust in color and opacity based on bullish or bearish trends, providing immediate visual cues about market momentum. The customized color and opacity settings allow for clearer distinction, especially in noisy markets.
Why This Combination?
This script is more than just an aesthetic adjustment; it’s a purposeful combination of moving averages and candle smoothing designed to enhance readability and actionable insights. Traditional candles often suffer from excessive noise in volatile markets, and this mashup addresses that by creating a smooth, flowing chart that adapts to the underlying trend. The Signal Line adds confirmation, acting as a filter for potential entries and exits. Together, these elements serve as a concise toolset for traders aiming to capture trend-based opportunities with clarity and precision.

Moving AveragesWhile this "Moving Averages" indicator may not revolutionize technical analysis, it certainly offers a valuable and efficient solution for traders seeking to streamline their chart analysis process. This all-in-one tool addresses a common frustration among traders: the need to constantly search for and compare different types and lengths of moving averages.
Key Features
The indicator allows for the configuration of up to 5 moving averages simultaneously, providing a comprehensive view of price trends. Users can choose from 7 types of moving averages for each line, including SMA, EMA, WMA, VWMA, HMA, SMMA, and TMA. This variety ensures that traders can apply their preferred moving average types without the need for multiple indicators.
Each moving average can be fully customized in terms of length, color, line style, and thickness, allowing for clear visual differentiation. However, what sets this indicator apart is its "Smart Opacity" feature. When activated, this option dynamically adjusts the transparency of the moving average lines based on their direction, with ascending lines appearing more opaque and descending lines more transparent. This subtle yet effective visual cue aids in quickly identifying trend changes and potential trading signals.
Advantages
The primary benefit of this indicator lies in its convenience. By consolidating multiple moving averages into a single, customizable tool, it saves traders valuable time and reduces chart clutter. The Smart Opacity feature, while not groundbreaking, does offer an intuitive way to visualize trend strength and direction at a glance.
Moreover, the indicator's flexibility makes it suitable for various trading styles and experience levels. Whether you're a novice trader learning to interpret basic trend signals or an experienced analyst fine-tuning a complex strategy, this tool can adapt to your needs.
In conclusion, while this "Moving Averages" indicator may not be a game-changer in the world of technical analysis, it represents a thoughtful refinement of a fundamental trading tool. By focusing on user convenience and visual clarity, it offers a practical solution for traders looking to optimize their chart analysis process and make more informed trading decisions.

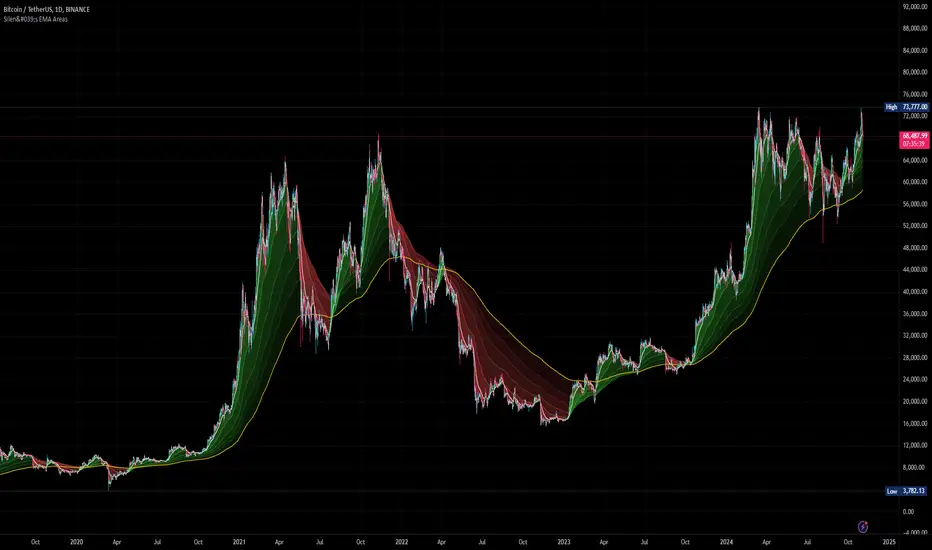
Silen's EMA AreasAre you tired of reading candles? 🧨 Do you want to bring more meaning to your chart? 🧹
Then this is the script for you!
This script does:
- Add several meaningfully pre-configured EMA lines to your chart - up to EMA 300
- Colors the areas between EMA lines in 3d colors - green and red
- The Smaller the EMA, the firmer the color
- Highlights the EMA 300 in a golden color
What is the meaning of this?
Let me introduce a new word to you: EMA FOLDING .
Yes, you heard right. With this indicator you can see in 3D how EMA lines are folding above and below each other, indicating severe mood swings in the chart.
This helps you keep track of what your instrument is actually doing while it enables you to cancel out the noise and messyness of ordinary candles which can be quite random and hard to read.
Once an EMA is fully positive or negatively folded (all ema lines are green and above each other from largest EMA to smallest EMA and vice versa for negatively folded) you can be sure that you are in a Trend or certain mood (for higher timeframes, from 15mins on).
I don't ever want to read any chart without having this indicator on. Whenever I present charts to anybody I use this indicator - and the feedback is insanely positive. People tend to read and understand charts much better with this indicator than just staring at candles.
Why is this indicator different to other EMA indicators and should thereby not be deleted by the TradingView Team due to redundance with other EMA indicators?
- This is not a simple indicator for EMAs
- Rather, this is an indicator to better and easier read the whole chart
- You can detect mood swings very easily which is very hard to do with a normal EMA indicator
- I haven't found any EMA indicator on TradingView that does this job so i sincerely believe it is extremely unique
- I sincerely believe it can help people get a much better understanding of charts without actualy getting into details of EMA's or even needing to know what an EMA is.
This indicator isn't intended for trading purposes, rather it is intended to give you a better and easier understanding of the chart. Of course - you can also use it for your trading but like I said, that is not the primary intended purpose.
This indicator comes pre-configured with quite optimal values (in my opinion) but of course can be fully customized. 🧮
Test it for yourself!
J Lines EMA + VWAPThe EMA + VWAP indicator combines the power of Exponential Moving Averages (EMA) with the Volume Weighted Average Price (VWAP) to help traders spot trends, identify potential entries/exits, and understand market momentum with ease. This dual-purpose tool is designed to give both beginner and experienced traders a clear view of price direction and volume influence, whether for day trading or swing trading.
Key Features:
Dynamic EMA Lines:
Six customizable moving averages (EMA by default) adapt to your selected timeframe. EMAs help track trend direction and strength, with various colors and opacity settings that visually separate them for clarity.
VWAP Tracking: A standalone VWAP line (blue) shows the average trading price adjusted for volume, making it ideal for pinpointing significant price levels where institutional interest often lies.
EMA Ribbons for Trend Confirmation: Soft-colored ribbons are placed between EMA pairs to make the trend strength visually apparent, with different color fills between lines. This makes it easy to gauge bullish or bearish conditions at a glance.
Flexible MA Options: Besides EMA, you can choose from SMA, WMA, HMA, and RMA, allowing you to adapt the indicator to various trading strategies.
This tool simplifies trend-following and volume-based analysis by giving you insight into both price momentum and market participation levels. EMAs adapt to volatility and changing market conditions, while the VWAP keeps you aware of critical price zones based on trading volume. Together, these help you stay on the right side of the market, avoid false breakouts, and make informed decisions on when to enter or exit trades.
Ideal for beginners due to its visual clarity and flexible enough for seasoned traders, EMA + VWAP is your go-to indicator for a structured approach to market trends.

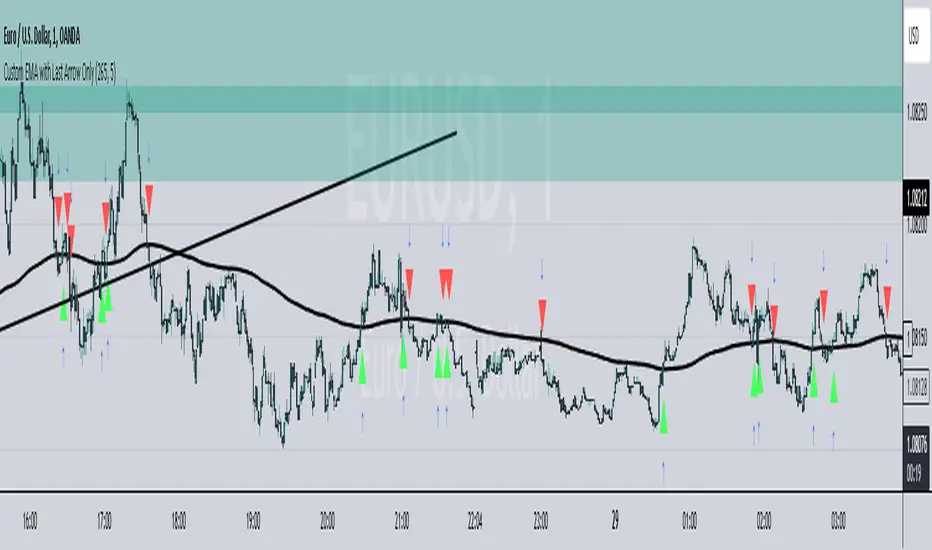
EMA LavtiThis TradingView Pine Script indicator displays a smoothed Exponential Moving Average (EMA) line along with a single arrow to indicate the last confirmed crossing event. The indicator highlights either a "Buy" or "Sell" signal based on price action relative to the smoothed EMA.
How It Works:
The script tracks the index and direction (up or down) of the last crossover event.
When no new crossing event occurs, the script resets to avoid plotting multiple arrows.
The smoothed EMA line is plotted on the chart to give context for the crossover signals.
Hull Moving Averages 10, 20, 50, 100, 200This script generates multiple Hull Moving Averages (HMAs) on a trading chart, allowing for comprehensive trend analysis across different timeframes. Five HMAs with lengths of 10, 20, 50, 100, and 200 periods are plotted on the chart, providing insights into short, medium, and long-term market trends.
Each HMA can be customized with individual colors to easily distinguish between the different timeframes, helping traders visually track momentum changes and trend strength across these intervals. The Hull Moving Average is known for reducing lag compared to other moving averages, which makes it particularly useful for identifying turning points more accurately.
With this script:
You can adjust the colors of each HMA line individually, ensuring optimal visual differentiation.
You can analyze short-term trends with HMA 10 and HMA 20, medium-term trends with HMA 50, and long-term trends with HMA 100 and HMA 200.
The chart provides an at-a-glance view of multi-timeframe trends, making it useful for trading strategies that rely on crossovers or divergence patterns.
This tool is ideal for traders who want to identify trend direction, strength, and possible reversal points with minimal lag.
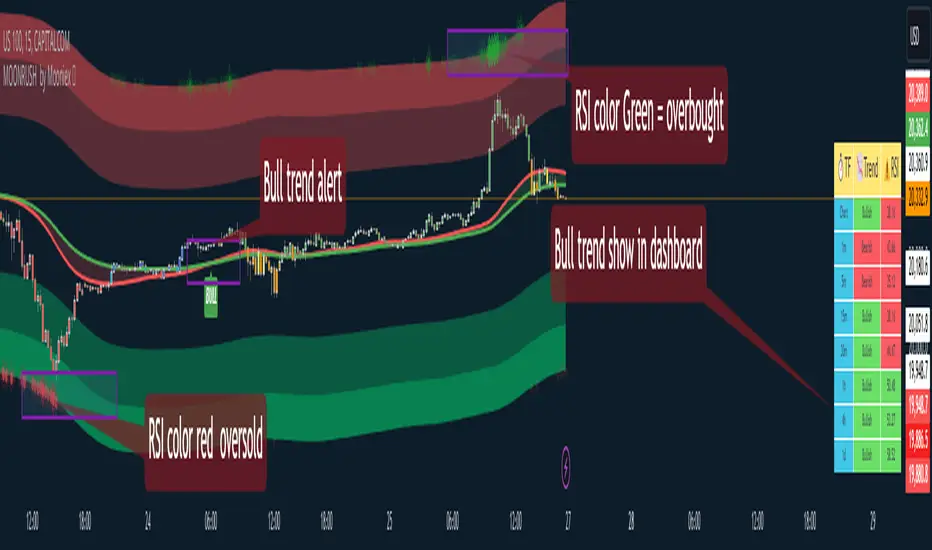
MoonrushCAPITALCOM:US100
Moonrush Indicator - Multi-Timeframe Trend Analysis Tool
Moonrush is a trend analysis tool that helps traders see market trends and identify potential entry or exit points using a combination of Exponential Moving Averages (EMAs) and overbought/oversold signals. The tool has the ability to display data in an easy-to-read dashboard, eliminating the need for users to frequently change charts to get an overview of trends across multiple timeframes.
Key Features and Methods
Multi-Timeframe Trend Analysis:
Moonrush analyzes trends on 1-minute, 5-minute, 15-minute, 30-minute, 1-hour, 4-hour, and 1-day timeframes. It calculates the trend by comparing two user-defined EMA values (EMAfast and EMAslow). If the EMAfast crosses above the EMAslow, it indicates an uptrend (shown in green), while if it crosses below, it indicates a downtrend (shown in red). This allows traders to see the consistency of trends across multiple timeframes.
Customizable Dashboard:
Moonrush provides a dashboard that shows the trend and RSI index for each timeframe, with a table that allows traders to quickly assess market conditions. By displaying the RSI level, it can indicate overbought or oversold conditions. Green is used to indicate overbought conditions, while red is used for oversold conditions.
Overbought/Oversold Color Display:
The dashboard highlights overbought and oversold zones on the support EMA and resistance EMA lines, making it easier for users to identify reversal opportunities.
Key Parameters for Flexibility
EMA Adjustment and Toggle Switch:
Users can adjust the EMAfast and EMAslow parameters to suit their preferences, including turning the EMA display on or off as needed.
Dashboard Customization:
Traders can adjust the size and position of the dashboard to enhance usability, ensuring a clear display without cluttering the chart.
Focus on Risk Management:
Although Moonrush helps in trend detection, users should use this analysis in conjunction with appropriate risk management techniques. It is important to understand how Moonrush works, as the intersection of the EMA and RSI can help identify reversal and continuation patterns. However, users should consider the limitations of this indicator and examine the signals within a broader trading strategy.
How to Use Moonrush
Trend Confirmation:
Check the dashboard to see if trends across multiple timeframes are consistent, to create opportunities to follow or counter the trend.
Identifying Reversals:
Use the overbought and oversold color representations on the EMA support/resistance lines as reversal signals.
Customization:
Adjust the EMA values to your trading style and turn the display on or off as needed.
Moonrush, which combines EMA crossovers and RSI indicators, offers a versatile approach to trend analysis across multiple timeframes. However, traders should note that no single indicator can guarantee success. Users should conduct thorough backtesting and use it in accordance with their personal trading goals and risk tolerance.
##Please note that the tool (Moonrush) is not a guarantee of future market performance and should be used in conjunction with appropriate risk management. Users should ensure that they fully understand the methodology and limitations of the indicator before making any investment decisions. In addition, past performance is not an indication of future results.
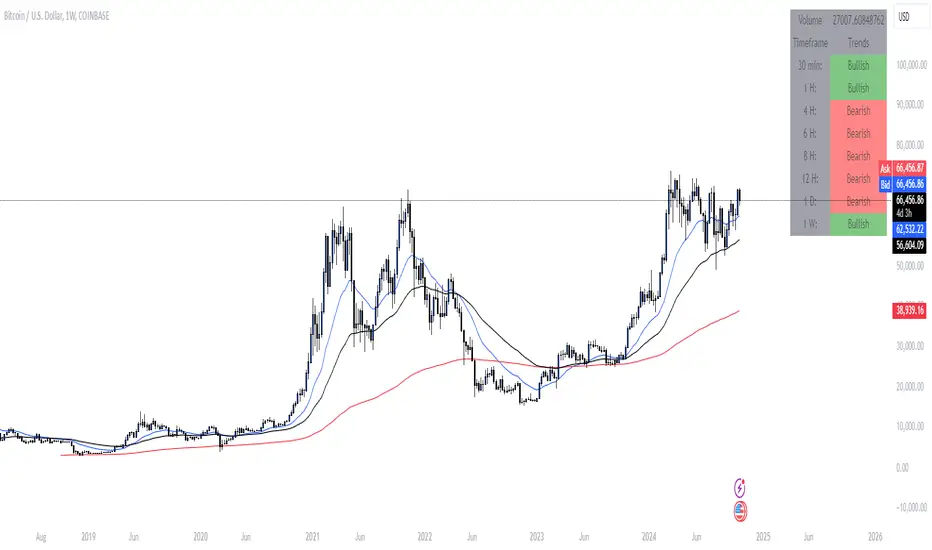
Market Bias IndicatorOverview
This Pine Script™ code generates a "Market Sentiment Dashboard" on TradingView, providing a visual summary of market sentiment across multiple timeframes. This tool aids traders in making informed decisions by displaying real-time sentiment analysis based on Exponential Moving Averages (EMA).
Key Features
Panel Positioning:
Custom Placement: Traders can position the dashboard at the top, middle, or bottom of the chart and align it to the left, centre, or right, ensuring optimal integration with other chart elements.
Customizable Colours:
Sentiment Colours: Users can define colours for bullish, bearish, and neutral market conditions, enhancing the dashboard's readability.
Text Colour: Customizable text colour ensures clarity against various background colours.
Label Size:
Scalable Labels: Adjustable label sizes (from very small to very large) ensure readability across different screen sizes and resolutions.
Market Sentiment Calculation:
EMA-Based Sentiment: The dashboard calculates sentiment using a 9-period EMA. If the EMA is higher than two bars ago, the sentiment is bullish; if lower, it's bearish; otherwise, it's neutral.
Multiple Timeframes: Sentiment is calculated for several timeframes: 30 minute, 1 hour, 4 hour, 6 hour, 8 hour, 12 hour, 1 day, and 1 week. This broad analysis provides a comprehensive view of market conditions.
Dynamic Table:
Structured Display: The dashboard uses a table to organize and display sentiment data clearly.
Real-Time Updates: The table updates in real-time, providing traders with up-to-date market information.
How It Works
EMA Calculation: The script requests EMA(9) values for each specified timeframe and compares the current EMA with the EMA from two bars ago to determine market sentiment.
Colour Coding: Depending on the sentiment (Bullish, Bearish, or Neutral), the corresponding cell in the table is color-coded using predefined colours.
Table Display: The table displays the timeframe and corresponding sentiment, allowing traders to quickly assess market trends.
Benefits to Traders
Quick Assessment: Traders can quickly evaluate market sentiment across multiple timeframes without switching charts or manually calculating indicators.
Enhanced Visualization: The color-coded sentiment display makes it easy to identify trends at a glance.
Multi-Timeframe Analysis: Provides a broad view of short-term and long-term market trends, helping traders confirm trends and avoid false signals.
This dashboard enhances the overall trading experience by providing a comprehensive, customizable, and easy-to-read summary of market sentiment.
Usage Instructions
Add the Script to Your Chart: Apply the "Market Sentiment Dashboard" indicator to your TradingView chart.
Customize Settings: Adjust the panel position, colours, and label sizes to fit your preferences.
Interpret Sentiment: Use the color-coded table to quickly understand the market sentiment across different timeframes and make informed trading decisions.
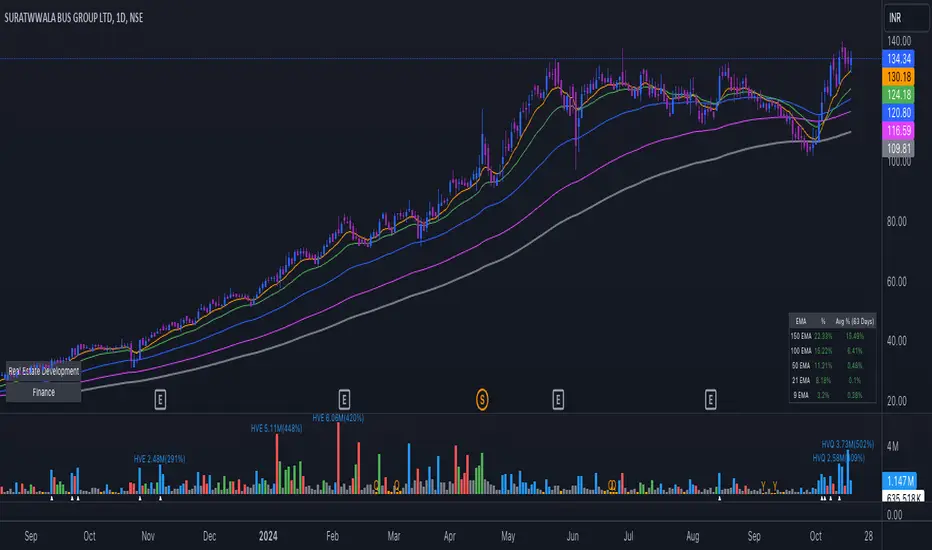
EMA Distance & Sector InfoThis indicator provides insights into price trends relative to Exponential Moving Averages (EMAs) and displays sector/industry information about the asset. Below is a detailed explanation of its purpose and what it is designed to achieve:
Purpose of the Code
The indicator offers two key functionalities:
1. Analyzing Price Distance from Multiple EMAs:
• Helps traders understand how far the current price is from key EMAs, expressed as a percentage.
• Calculates average percentage distances over a specified period (default: 63 days) to spot consistent trends or mean reversion opportunities.
• Useful for trend-following strategies, allowing the trader to see when the price is above or below important EMAs (e.g., 9, 21, 50, 100, and 150-period EMAs).
2. Displaying Asset Sector and Industry Information:
• Displays the sector and industry of the asset being analyzed (e.g., Technology, Consumer Goods).
• Provides additional context when evaluating performance across a specific sector or comparing an asset to its peers.
Who Would Use This Indicator?
This indicator is particularly helpful for:
1. Swing Traders and Positional Traders:
• They can use it to track whether the price is trading significantly above or below critical EMAs, which often signals overbought/oversold conditions or trend strength.
• The average percentage distances help to identify momentum shifts or pullback opportunities.
2. Sector/Industry-Focused Investors:
• Understanding an asset’s sector and industry helps investors gauge how the asset fits into the broader market context.
• This is valuable for sector rotation strategies, where investors shift funds between sectors based on performance trends.
How It Helps in Trading Decisions
1. Entry and Exit Points:
• If the price is far above an EMA (e.g., 21 EMA), it might indicate an overbought condition or a strong trend, while a negative percentage could signal a pullback or reversal opportunity.
• The average percentage distances smooth the fluctuations and reveal longer-term trends.
2. Contextual Information:
• Knowing the sector and industry is useful when analyzing trends. For example, if Technology stocks are doing well, and this asset belongs to that sector, it could indicate sector-wide momentum.
Summary of the Indicator’s Purpose
This code provides:
• EMA trend monitoring: Visualizes the price position relative to multiple EMAs and averages those distances for smoother insights.
• Sector and industry information: Adds valuable context for asset performance analysis.
• Decision-making support: Helps traders identify overbought/oversold levels and assess the asset within the broader market landscape.
In essence, this indicator is a multi-purpose tool that combines technical analysis (through EMA distances) with fundamental context (via sector/industry info), making it valuable for traders and investors aiming to time entries/exits or understand market behavior better.
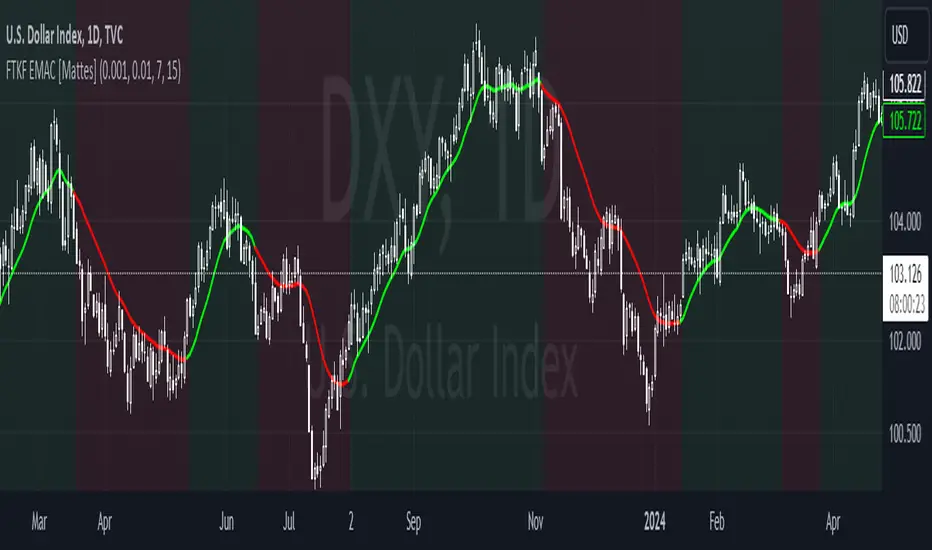
Fourier Transformed & Kalman Filtered EMA Crossover [Mattes]The Fourier Transformed & Kalman Filtered EMA Crossover (FTKF EMAC) is a trend-following indicator that leverages Fourier Transform approximation, Kalman Filtration, and two Exponential Moving Averages (EMAs) of different lengths to provide accurate and smooth market trend signals. By combining these three components, it captures the underlying market cycles, reduces noise, and produces actionable insights, making it suitable for detecting both emerging trends and confirming existing ones.
TECHNICALITIES:
>>> The Fourier Transform approximation is designed to identify dominant cyclical patterns in price action by focusing on key frequencies, while filtering out noise and less significant movements. It emphasizes the most meaningful price cycles, enabling the indicator to isolate important trends while ignoring minor fluctuations. This cyclical awareness adds an extra layer of depth to trend detection, allowing the EMAs to work with a cleaner and more reliable data set.
>>> The Kalman Filter adds dynamic noise reduction, adjusting its predictions of future price trends based on past and current data. As new price data comes in, the filter recalibrates itself to ensure that the price action remains smooth and devoid of erratic movements. This real-time adjustment is key to minimizing lag while avoiding false signals, which ensures that the EMAs react to more accurate and stable market data. The Kalman Filter’s ability to smooth price data without losing sensitivity to trend changes complements the Fourier approximation, ensuring a high level of precision in volatile and stable market environments.
>>> The EMA Crossover involves using two EMAs: a shorter EMA that reacts quickly to price movements and a longer EMA that responds more slowly. The shorter EMA is responsible for capturing immediate market shifts, detecting potential bullish or bearish trends. The longer EMA smooths out price fluctuations and provides trend confirmation, working with the shorter EMA to ensure the signals are reliable. When the shorter EMA crosses above the longer EMA, it indicates a bullish trend, likewise when it goes below the longer EMA, it signals a bearish trend. This setup provides a clear way to track market direction, with color-coded signals (green for bullish, red for bearish) for visual clarity. The flexibility of adjusting the EMA periods allows traders to fine-tune the indicator to their preferred timeframe and strategy, making it adaptable to different market conditions.
|-> A key technical aspect is that the first EMA should always be shorter than the second one. If the first EMA is longer than the second, the tool’s effectiveness is compromised because the faster EMA is designed to signal long conditions, while the longer one is made for signaling a bearish trend. Reversing their roles would lead to delayed or confused signals, reducing the indicator’s ability to detect trend shifts early and making it less efficient in volatile markets. This is the only key weakness of the indicator, failure to submit to this rule will result in confusion.
>>> These components work together like a clock to create a comprehensive and effective trend-following system. The Fourier approximation highlights key cyclical movements, the Kalman Filter refines these movements by removing noise, and the EMAs interpret the filtered data to generate actionable trend signals. Each component enhances the next, ensuring that the final output is both responsive and reliable, with minimal false signals or lag. creating an indicator using widespread concepts which haven't been combined before.
Summary
This indicator combines Fourier Transform approximation, Kalman Filtration, and two EMAs of different lengths to deliver accurate and timely trend-following signals. The Fourier approximation identifies dominant market cycles, while the Kalman Filter dynamically removes noise and refines the price data in real time. The two EMAs then use this filtered data to generate buy and sell signals based on their crossovers. The shorter EMA reacts quickly to price changes, while the longer EMA provides smoother trend confirmation. The components work in synergy to capture trends with minimal false signals or lag, ensuring traders can act promptly on market shifts. Customizable EMA periods make the tool adaptable to different market conditions, enhancing its versatility for various trading strategies.
To use the indicator, traders should adjust the EMA lengths based on their timeframe and strategy, ensuring that the shorter EMA remains shorter than the longer EMA to preserve the tool’s responsiveness. The color-coded signals offer visual clarity, making it easy to identify potential entry and exit points. This confluence of Fourier, Kalman, and EMA methodologies provides a smooth, highly effective trend-following tool that excels in both trending and ranging markets.
[AA]-TrendFlow EMAs - TrendFlow EMAs: A Multi-Dimensional Trend Analysis Tool
The TrendFlow EMAs indicator is designed to help traders identify and act on trends, momentum shifts, and reversals across various timeframes. This tool combines multiple Exponential Moving Averages (EMAs), daily open levels, and PVSRA-based volume analysis to provide unique insights into market dynamics. By layering these components, the indicator offers a well-rounded view of both intraday and longer-term trends, making it suitable for traders of all styles, from scalpers to swing traders.
Key Features and Components:
EMA Trend Cloud with Bias Coloring:
The indicator plots an EMA cloud using two customizable EMAs (default 5 and 13) to highlight the trend's direction and strength.
Bias Coloring on the 50 EMA Cloud: The area between the 50 EMA and its upper/lower limits changes color based on trend bias.
When the 50 EMA rises, the cloud turns light green (bullish bias).
When the 50 EMA falls, the cloud shifts to light red (bearish bias).
This bias coloring helps traders quickly identify the dominant trend and momentum shifts at a glance.
Additional long-term EMAs (100, 200, and 800) provide context for market direction and align signals across different timeframes.
Daily Open Levels for Intraday Context:
This feature marks the daily open price, a key reference point for tracking intraday price action.
Use it to identify whether the market is trending away from or converging towards the daily open, allowing for better intraday entry and exit points.
PVSRA-Based Volume Candle Coloring:
The indicator colors candles using PVSRA (Price, Volume, Spread Analysis) logic to reveal high-volume price moves and fakeouts.
Green and red candles highlight strong bullish or bearish moves. Violet and blue candles indicate potential false moves, cautioning traders to avoid traps.
This volume-weighted candle analysis improves trend validation by helping traders avoid low-confidence setups.
Deviation Table for EMA Overextensions:
A table shows the percentage deviation of price from selected EMAs, helping traders identify overbought or oversold conditions.
Use this data to determine when the market is likely to revert back to mean levels or continue trending.
How to Use the Indicator Effectively:
Trend Confirmation: Use the EMA cloud and bias coloring to confirm trend direction. Enter trades in the direction of the trend when both the short-term and long-term EMAs align.
Intraday Trading: Pay attention to the daily open level—when the price stays above the open, the bias is bullish, and vice versa.
Volume Confirmation: Monitor the PVSRA candle colors to validate or question market moves.
For example, a transparent candle signals a possible fake bearish move, while a green candle indicates a high-confidence bullish push.
EMA Deviations: Consult the deviation table to see if price is extended beyond normal levels, potentially signaling a reversal or retracement.
Default Settings and Customization:
Fast EMA: 5
Slow EMA: 13
Trend Bias EMAs: 12 and 21 (for additional trend filtering)
Long-Term EMAs: 50, 100, 200, and 800
Bias Cloud on 50 EMA: Dynamic coloring to reflect bullish and bearish bias.
Color Modes: Supports dark and light modes for visual customization.
Volume Candles: The PVSRA-based volume coloring offers a clearer view of potential trend traps or momentum surges.
Why This Indicator Stands Out:
The TrendFlow EMAs indicator combines the strengths of multiple strategies—trend-following EMAs, intraday reference levels, and PVSRA-based volume analysis—into a single tool. This mashup creates more reliable signals and helps traders avoid common pitfalls like false breakouts or low-volume traps. The bias coloring on the 50 EMA cloud offers an additional edge, giving traders a quick visual indication of momentum changes. With its clear visual cues, customizable settings, and multi-dimensional insights, TrendFlow EMAs offers a complete solution for traders looking to trade trends confidently and accurately.
Best Practices:
Combine with other tools (like RSI or MACD) to further enhance trade entries and exits.
Adjust the EMA lengths to suit your trading style or the volatility of the asset you are analyzing.

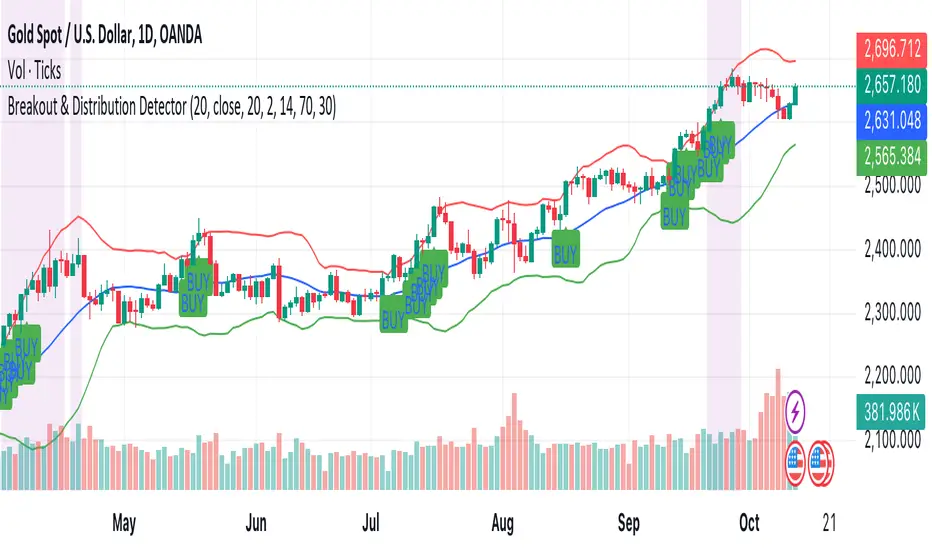
Breakout & Distribution DetectorHow the Script Works:
1. Bollinger Bands:
• The upper and lower Bollinger Bands are used to detect volatility and potential breakouts. When the price closes above the upper band, it’s considered a bullish breakout. When the price closes below the lower band, it’s a bearish breakout.
2. RSI (Relative Strength Index):
• The RSI is used for momentum confirmation. A bullish breakout is confirmed if the RSI is above 50, and a bearish breakout is confirmed if the RSI is below 50.
• If the RSI enters overbought (above 70) or oversold (below 30) levels, it signals a distribution phase, indicating the market may be ready to reverse or consolidate.
3. Moving Average:
• A simple moving average (SMA) of 20 periods is used to ensure we’re trading in the direction of the trend. Breakouts above the upper Bollinger Band are valid if the price is above the SMA, while breakouts below the lower Bollinger Band are valid if the price is below the SMA.
4. Signals and Alerts:
• BUY Signal: A green “BUY” label appears below the candle if a bullish breakout is detected.
• SELL Signal: A red “SELL” label appears above the candle if a bearish breakout is detected.
• Distribution Phase: The background turns purple if the market enters a distribution phase (RSI in overbought or oversold territory).
• Alerts: You can set alerts based on these conditions to get notifications for breakouts or when the market enters a distribution phase.
EMA Distance Scanner with Multi-TimeframesThis indicator was created for personal use because I wanted to see, within the five-minute time frame, what is happening with the 15-minute, 1 hour, and 4 hour EMA9 and EMA200.
When the number is green, we are above the EMA value, and when it is red, we are below it. This also helps to get a clearer picture of the short- and long-term trends. When the number is close, within 0.00-0.01%, it turns blue, indicating a potential support level. You can also change the EMA values to your preference in the settings.
Hopefully, this will be helpful for you as well.

Trademania - PVSRA IndicatorTrademania - PVSRA Indicator
The Trademania - PVSRA Indicator is based on a proven MT4 indicator suite that has been in use since 2013. Over time, it has been expanded with additional features and tools. Originally developed for the Forex market, it also works well for cryptocurrencies, stocks, and other assets. The goal of this indicator is to combine classic chart analysis with PVSRA analysis, allowing for a clean mixed chart analysis. Traders gain access to a wide range of important information and can use it to form their trading assumptions. The indicator is designed to make it as simple as possible: identifying price levels at the breakout of key support/resistance, for confirmations above/below an imbalance, or recognizing and validating standard structures.
Important: This indicator is designed to be used across all timeframes. It works equally well for scalping on lower timeframes and for larger timeframes, such as spot trading on the 4H or daily chart.
The following core features are available:
- PVSRA Candles
- Dynamic Zones for PVSRA Candles (Imbalance)
- Market sessions with high/low points
- Integrated EMAs (daily, weekly, higher time frames)
- Fully customizable EMAs
- Pivot points with mid/50% level
- Price ranges from yesterday and last week
- Average daily range (also available for weekly and monthly)
- Psychological levels (for Forex)
- Daily open
- High/Low Point of Control (POC) indicators for wicks and candle bodies
- WIL (Weekly Interest Level) - High/Low of the Asian session
- On-chart labels for nearly all elements
Key Features:
- PVSRA, integrated POC levels, and WIL levels distinguish this indicator.
- Integrated EMAs and the daily, weekly, high time frame EMAs can be supplemented or replaced by custom EMAs for maximum flexibility.
Special Feature:
- Lite Mode for better visibility and simplified chart analysis.
Instructions and Notes
PVSRA Candles
Display volume or tick volume on the chart.
- Candles with more than 200% average volume of the last 10 candles, where the product of candle spread and volume is greater than the last 10 candles/timeframes, are shown in green (bullish) and red (bearish).
- Blue and purple candles show the same with 150% average volume of the last 10 candles.
**Note:** To obtain valid information, the trading volume should be as large as possible. If you're viewing the chart of an exchange with low trading volume, you can use the PVSRA override to display the volume from another exchange. For example, you can view the Phemex chart but display the tick/volume of the Binance chart as PVSRA/Vector candles.
Dynamic Zones for PVSRA Candles (Imbalance)
Zones that match the color of the respective vector candle display imbalance on the chart.
- In PVSRA analysis, it is assumed that such imbalances will be revisited and corrected. It can be customized whether this should happen with candle wicks or just the candle bodies.
Market Sessions with High/Low Points (DST)
Relevant market sessions: Sydney/NZX, Tokyo, Hong Kong, EU, New York, as well as the Brinks sessions pre EU/NY, are marked with high/low points and labeled on the chart.
- In PVSRA/Mixed analysis, these represent important liquidity zones of the individual trading sessions, often serving as key support/resistance levels.
WIL (Weekly Interest Level) - High/Low of the Asian Session
The new WIL levels represent the market open/Asian session of the new trading week: Sydney open to Hong Kong close.
- This forms an important price range for the trading week and is always a key breakout zone or rejection area in mixed analysis. Additional liquidity is needed to break through these levels.
- Higher effort against the start of the week – an imbalance (above/below).
High/Low Point of Control (POC) Indicators for Wicks and Candle Bodies
Additionally, the indicator includes pivot-based POC markers at key highs/lows on the chart.
- A POC is generated from the candle footprint (1000 resolution) and displayed on the chart.
- **Note:** If the POC is in a wick, it is shown as a line; if the POC is only in the candle body, it is displayed in small text.
- In mixed analysis, POCs in volume-heavy wicks are always a key indication of price levels that will be revisited and a potential enhancer for a wick-fill upwards or downwards.
EMA/Pivot Points/Psychological Levels Classic/Average Ranges:
Daily/ADR - Weekly/AWR / High/Low values for day/week, as well as the daily open of the current trading day, form the foundation of the indicator.
- Base structures that account for imbalance must break certain price levels to confirm or invalidate a previous movement (bullish or bearish).
- 13/50/200/800 EMA retrace: Breaking these in either direction without addressing an imbalance on the opposite side requires confirmation after the break.
- Pivot-level trading operates on the same principle.
- **Note:** Pivot levels in this indicator have additional M-levels, which represent 50% markers to provide better insights into potential retraces or upward moves.
- For example: Breaking M1, retracing, and confirming at M1 with a target at M2.
To recognize a standard 3-level rise or retrace scenario in mixed analysis, as well as a potential extended chart progression, these levels are essential.
**Note:** Average ranges such as High/Low ADR are particularly important levels where interruptions are expected. Profit-taking, long/short, is common at these points, independent of standard structures. This also applies to the high/low levels of the last trading day and the weekly versions of these levels.
The daily open helps identify possible SPOT/Futures gaps (depending on the asset, such as a missing futures market over the weekend: NAS/DAX).
Important:
The Lite Mode is designed to help traders reduce the chart to essential core functions (PVSRA/EMA/WIL/Psy/Daily Open/Hi-Lo) to apply classic TA effectively and strengthen a mixed analysis or challenge certain assumptions regarding confirmation and imbalance.
**Note:** It is recommended to additionally use a MACD indicator to identify potential trends and momentum.
- For example, a positive MACD trend supporting a 50 EMA breakout with a target of the 200 EMA under positive imbalance (standard mixed pattern).
To cater to personal preferences or trading strategies, it is possible to add custom EMA values to the indicator without the need for a second or third separate indicator.
All functions are fully customizable within the indicator settings.

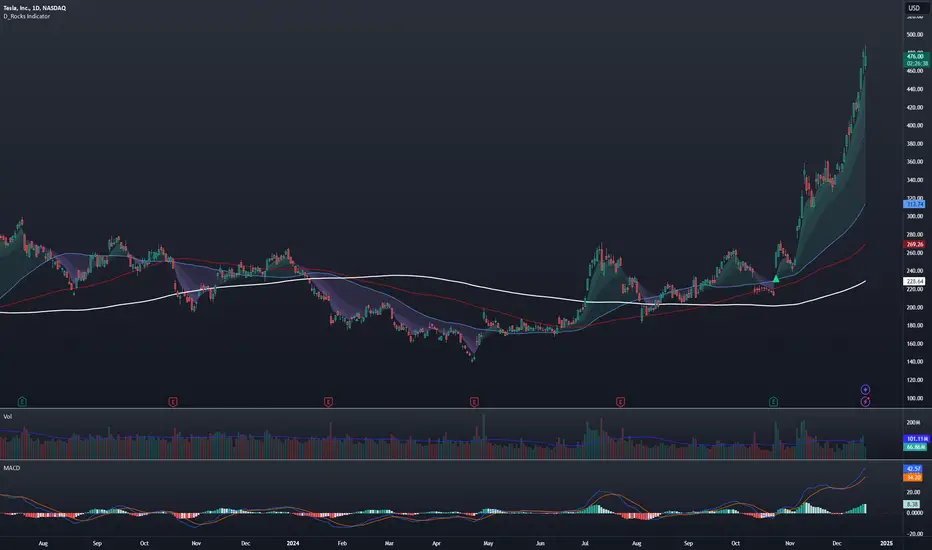
D_Rock's MA IndicatorD_Rock's Moving Average Indicator
This is an indicator version of my strategy linked here
**Overview:**
The basic concept of this indicator is to generate a signal when a faster/shorter length moving average crosses over (for Longs) or crosses under (for Shorts) a medium/longer length moving average. All of which are customizable. This indicator can work on any timeframe, however the daily is the timeframe used for the default settings and screenshots, as it was designed to be a multi-day swing strategy. Once a signal has been confirmed with a candle close, based on user options, the strategy is to enter the trade on the open of the next candle.
The crossover strategy is nothing new to trading, but what can make this strategy unique and helpful, is the addition of further confirmation points before a signal is generated along with the ability to show multiple moving averages on the chart if you choose. Each moving average pair can also be turned into a "cloud" instead of the traditional lines, for additional viewing preferences. Just about everything visual can be toggled on/off as well.
This indicator is a Trend (MA) indicator with optional confirmation points using a Momentum (MACD) indicator. While a Volume-based indicator is not shown here, one could consider using their favorite from that category to further compliment the signal idea.
If you would like to see the backtesting results for your favorite moving average crossover/under, please see my strategy version linked here .
Shoutout given to Ripster's Clouds Indicator as pieces of that code were taken and modified to create both the Cloud visualization effects, and the Moving Average Pair Plots that are implemented in this strategy.
MOVING AVERAGE OPTIONS
Select between and change the length & type of up to 5 pairs (10 total) of moving averages
The "Show Cloud-x" option will display a fill color between the "a" and "b" pairs
All moving averages lines can be toggled on/off in the "Style" tab, as well as adjusting their colors.
Visualization features do not affect calculations, meaning you could have all or nothing on the chart and the strategy will still produce results
SIGNAL CHOICES
Choose the fast/shorter length MA and the medium/longer length MA to determine the entry signal
CONFIRMATION OPTIONS
Both of these have customizable values and can be toggled on/off
A candle close over a slower/much longer length moving average
An additional cross-over (cross-under for Shorts) on the MACD indicator using default MACD values. While the MACD indicator is not necessary to have on the chart, it can help to add that for visualization. The calculations will perform whether the indicator is on the chart or not.
ADDITIONAL PLOTS
MACD (Moving Average Convergence/Divergence):
- The MACD is an optional confirmation indicator for this strategy.
- Plotting the indicator is not necessary for the strategy to work, but it can be helpful to visually see the status and position of the MACD if this feature is enabled in the strategy
- This helps to identify if there is also momentum behind the entry signal
Boosted Moving AverageOverview:
The Boosted Moving Average (BMA) is designed to enhance the traditional Exponential Moving Average (EMA) by introducing a boositng factor that amplifies its responsiveness to price changes. This means that the BMA will react more quickly to significant market movements, while still maintaining a smooth trajectory.
Key Features:
Boost Factor Sensitivity: Adjust the BMA's reactivity to price movements. A higher boost factor makes it more responsive, ideal for traders who want to catch price shifts early.
Dual EMA Calculation: The BMA combines two EMAs with different lengths to create a divergence that forms the basis for boosted values. This dual approach helps refine entry and exit points.
Smoothing: After boosting, the moving average is smoothed using another EMA, ensuring you get the clearest possible signal without over-complicating things.
Bullish/Bearish Coloring: The plot changes color based on the current trend, making it easy to visualize market direction:
How It Works:
The script calculates two EMAs: one with the given length and one with half that length.
The boost factor amplifies the difference between these two EMAs to provide an enhanced signal.
A final EMA is applied to smooth the resulting boosted moving average, ensuring clarity in market direction.
Color-coded trends make it easy to see if the market is bullish (green) or bearish (red).

Day & Swing Trading EMA Clouds with Adaptive LevelsDay & Swing Trading EMA Clouds with Adaptive Levels is a tool designed for traders who need a flexible indicator that adapts to both short-term (day trading) and long-term (swing trading) strategies. The indicator blends EMA clouds and adaptive support/resistance levels, making it suitable for analyzing trend strength and key price zones.
How It Works:
EMA Clouds for Trend Detection:
This indicator uses three EMAs (Fast, Intermediate, Slow) to create two clouds:
Fast Cloud: The area between the fast and Intermediate EMAs.
Slow Cloud: The area between the Intermediate and slow EMAs.
The cloud colors change based on trend direction:
Positive (uptrend): When the fast EMA is above the Intermediate EMA (turquoise) or the Intermediate EMA is above the slow EMA (teal).
Negative (downtrend): When the fast EMA is below the Intermediate EMA (pink) or the Intermediate EMA is below the slow EMA (magenta).
Traders can use these clouds to visually gauge market momentum and trend reversals.
Adaptive EMA Settings Based on Trading Mode:
The EMA lengths adjust automatically depending on whether you're in Day Trading or Swing Trading mode:
Day Trading Mode uses shorter periods to capture quick price movements:
Fast EMA: 5-period
Mid EMA: 13-period
Slow EMA: 21-period
Swing Trading Mode uses longer periods to capture broader trends:
Fast EMA: 12-period
Mid EMA: 26-period
Slow EMA: 50-period
This dynamic adjustment allows you to switch between trading styles seamlessly, with the EMAs reflecting the most relevant timeframes for each strategy.
Adaptive Support and Resistance Levels:
Depending on the selected trading mode, the indicator dynamically plots key levels:
Day Trading Mode: Previous day’s high, low, and midpoint, as well as 2-day levels.
Swing Trading Mode: Previous month’s high, low, and midpoint, as well as 2-month levels.
These levels act as dynamic support and resistance zones, giving traders critical areas to monitor for potential reversals or breakouts.
Buy & Sell Signals:
Visual buy/sell signals are generated when the fast EMA crosses above or below the slow EMA. These signals can help traders identify potential trend reversals.
Customization:
You can fully adjust the transparency and colors of the clouds to fit your personal preferences and trading style.
Why This Combination?
Combining EMA clouds with adaptive levels provides traders with a complete picture. The clouds highlight the underlying market momentum and trend strength, while the adaptive levels offer potential entry/exit points based on historical price action. This unique mashup allows traders to follow trends and plan trades around key support and resistance zones.

EMA GridThe EMA Grid indicator is a powerful tool that calculates the overall market sentiment by comparing the order of 20 different Exponential Moving Averages (EMAs) over various lengths. The indicator assigns a rating based on how well-ordered the EMAs are relative to each other, representing the strength and direction of the market trend. It also smooths out the macro movements using cumulative calculations and visually represents the market sentiment through color-coded bands.
EMA Calculation:
The indicator uses a series of EMAs with different lengths, starting from 5 and going up to 100. Each EMA is calculated either using the exponential moving averages.
The EMAs form the grid that the indicator uses to measure the order and distance between them.
Rating Calculation:
The indicator computes the relative distance between consecutive EMAs and sums these differences.
The cumulative sum is further smoothed using multiple EMAs with different lengths (from 3 to 21). This smooths out short-term fluctuations and helps identify broader trends.
Market Sentiment Rating:
The overall sentiment is calculated by comparing the values of these smoothing EMAs. If the shorter-term EMA is above the longer-term EMA, it contributes positively to the sentiment; otherwise, it contributes negatively.
The final rating is a normalized value based on the relationship between these EMAs, producing a sentiment score between 1 (bullish) and -1 (bearish).
Color Coding and Bands:
The indicator uses the sentiment rating to color the space between the 100 EMA and 200 EMA, representing the strength of the trend.
If the sentiment is bullish (rating > 0), the band is shaded green. If the sentiment is bearish (rating < 0), the band is shaded red.
The intensity of the color is based on the strength of the sentiment, with stronger trends resulting in more saturated colors.
Utility for Traders:
The EMA Grid is ideal for traders looking to gauge the broader market trend by analyzing the structure and alignment of multiple EMAs. The color-coded band between the 100 and 200 EMAs provides an at-a-glance view of market momentum, helping traders make informed decisions based on the trend's strength and direction.
This indicator can be used to identify bullish or bearish conditions and offers a smoothed perspective on market trends, reducing noise and highlighting significant trend shifts.

Daksh RSI POINT to ShootHere are the key points and features of the Pine Script provided:
### 1. **Indicator Settings**:
- The indicator is named **"POINT and Shoot"** and is set for non-overlay (`overlay=false`) on the chart.
- `max_bars_back=4000` is defined, indicating the maximum number of bars that the script can reference.
### 2. **Input Parameters**:
- `Src` (Source): The price source, default is `close`.
- `rsilen` (RSI Length): The length for calculating RSI, default is 20.
- `linestylei`: Style for the trend lines (`Solid` or `Dashed`).
- `linewidth`: Width of the plotted lines, between 1 and 4.
- `showbroken`: Option to show broken trend lines.
- `extendlines`: Option to extend trend lines.
- `showpivot`: Show pivot points (highs and lows).
- `showema`: Show a weighted moving average (WMA) line.
- `len`: Length for calculating WMA, default is 9.
### 3. **RSI Calculation**:
- Calculates a custom RSI value using relative moving averages (`ta.rma`), and optionally uses On-Balance Volume (`ta.obv`) if `indi` is set differently.
- Plots RSI values as a green or red line depending on its position relative to the WMA.
### 4. **Pivot Points**:
- Utilizes the `ta.pivothigh` and `ta.pivotlow` functions to detect pivot highs and lows over the defined period.
- Stores up to 10 recent pivot points for highs and lows.
### 5. **Trend Line Drawing**:
- Lines are drawn based on pivot highs and lows.
- Calculates potential trend lines using linear interpolation and validates them by checking if subsequent bars break or respect the trend.
- If the trend is broken, and `showbroken` is enabled, it draws dotted lines to represent these broken trends.
### 6. **Line Management**:
- Initializes multiple lines (`l1` to `l20` and `t1` to `t20`) and uses these lines for drawing uptrend and downtrend lines.
- The maximum number of lines is set to 20 for uptrends and 20 for downtrends, due to a limit on the total number of lines that can be displayed on the chart.
### 7. **Line Style and Color**:
- Defines different colors for uptrend lines (`ulcolor = color.red`) and downtrend lines (`dlcolor = color.blue`).
- Line styles are determined by user input (`linestyle`) and use either solid or dashed patterns.
- Broken lines use a dotted style to indicate invalidated trends.
### 8. **Pivot Point Plotting**:
- Plots labels "H" and "L" for pivot highs and lows, respectively, to visually indicate turning points on the chart.
### 9. **Utility Functions**:
- Uses helper functions to get the values and positions of the last 10 pivot points, such as `getloval`, `getlopos`, `gethival`, and `gethipos`.
- The script uses custom logic for line placement based on whether the pivots are lower lows or higher highs, with lines adjusted dynamically based on price movement.
### 10. **Plotting and Visuals**:
- The main RSI line is plotted using a color gradient based on its position relative to the WMA.
- Horizontal lines (`hline1` and `hline2`) are used for visual reference at RSI levels of 60 and 40.
- Filled regions between these horizontal lines provide visual cues for potential overbought or oversold zones.
These are the main highlights of the script, which focuses on trend detection, visualization of pivot points, and dynamic line plotting based on price action.
