Trend Surfers - Momentum + ADX + EMAThis script mixes the Lazybear Momentum indicator, ADX indicator, and EMA.
Histogram meaning:
Green = The momentum is growing and the ADX is growing or above your set value
Red = The momentum is growing on the downside and the ADX is growing or above your set value
Orange = The market doesn't have enough momentum or the ADX is not growing or above your value (no trend)
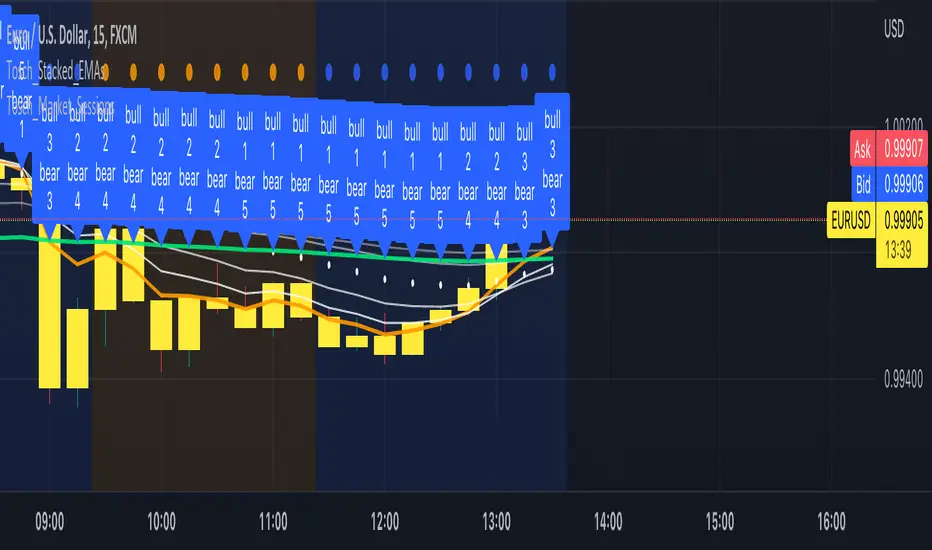
Background meaning:
Blue = The price is above the EMA
Purple = The price is under the EMA
Cross color on 0 line:
Dark = The market might be sideway still
Light = The market is in a bigger move
Pine Script®指標