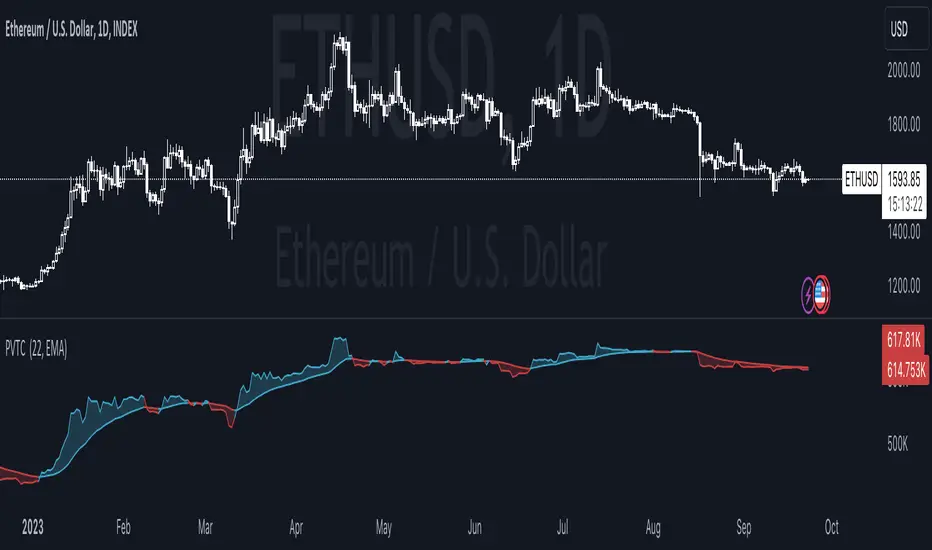
Price Volume Trend Crosses This script is a modified version of the Price Volume Trend ( PVT ) that uses a moving average of the PVT as a signal ( sig ) line.
The length of the signal line can be adjusted as needed by changing the "PVTC Signal Length" value inside the indicator settings menu.
"PVTC Signal Type" allows you to pick between EMA and SMA as the signal line.
Logic behind this script:
If PVT > sig it indicates an bullish environment and gets coloured with the UP color.
If PVT < sig it indicates a bearish environment and get coloured with the DOWN color.
Colors can be modified in the indicator settings menu.
Crosses can be highlighted by ticking the "Highlight Crosses" box in the indicator settings menu.
"Fill Gaps" fills the gap between PVT and sig with the prevailing trends color.
PVTC should not be used on its own but in conjunction with other indicators!
指數移動平均線(EMA)
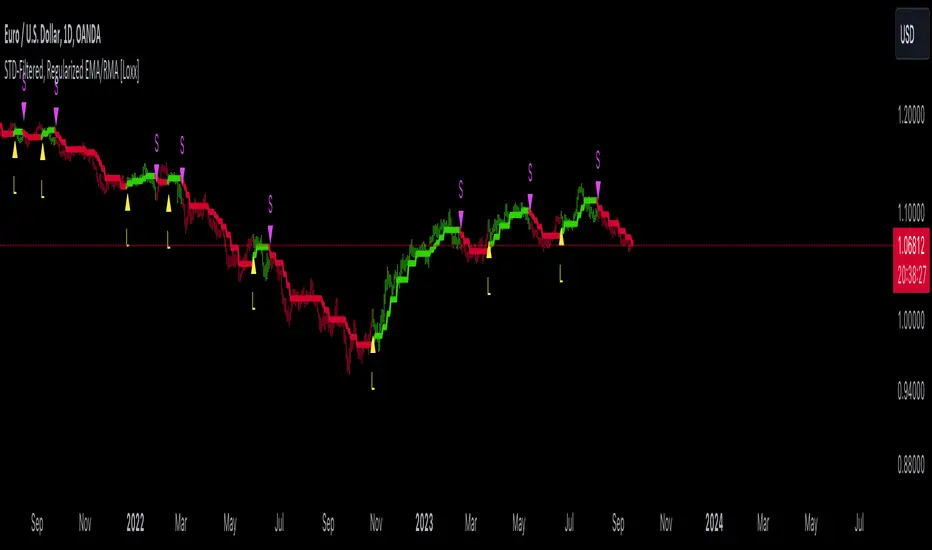
GKD-C STD-Filtered, REMA EMA/RMA [Loxx]The Giga Kaleidoscope GKD-C STD-Filtered, REMA EMA/RMA is a confirmation module included in Loxx's "Giga Kaleidoscope Modularized Trading System."
█ GKD-C STD-Filtered, REMA EMA/RMA
STD-Filtered, Regularized EMA/RMA calculates and visualizes a standard deviation (STD) filtered, regularized version of the Exponential Moving Average (EMA) or Regular Moving Average (RMA) on a trading chart.
Understanding the Regularized Moving Average
The Regularized Moving Average, as conceptualized by Chris Satchwell, offers a more responsive interpretation compared to traditional moving averages. By incorporating a smoothing mechanism using "Lambda", this approach reduces lag without compromising the data's integrity.
In the realm of technical analysis, many regard it as a preferred alternative to the standard Moving Average and Exponential Moving Average.
How Does It Stand Out from Other Moving Averages?
While analysts traditionally shorten an indicator's length or period to minimize lag, the Regularized Moving Average uses a unique approach. By embedding "Regularization" within its computation, this method introduces Lambda (often symbolized as λ-calculus). This mathematical factor tames the moving average's undue fluctuations, offering more stability through its Lambda adjustments.
Pro Tip: For those analyzing smaller intraday timeframes, consider ramping up the Lambda setting to 6.0 or even higher. When tweaking these settings, always remember to backtest and observe how it impacts signal accuracy and noise filtering.
Standard Deviation Filtering:
This filtering mechanism is designed to smoothen price data by eliminating minor fluctuations that might be considered "noise". Here's how the process works:
For every data point, the standard deviation of prices over a specified period is calculated.
This standard deviation is then multiplied by a user-defined value to determine a threshold. This threshold defines the magnitude of change required in the price for it to be considered significant.
For each price, if the absolute difference between its current and previous value is less than this threshold, the price is kept unchanged (considered insignificant and thus filtered). If the difference exceeds the threshold, the price is considered significant and remains as is.
By applying this filter, minor price variations within the threshold are disregarded, resulting in a smoother representation of the price data.
Moving Average Calculation:
The script provides an option to calculate either a regularized Exponential Moving Average (EMA) or a Regular Moving Average (RMA). Here's how these are approached:
If the EMA option is selected: A weighted formula is used where more recent prices have a higher influence on the average than older prices. This is achieved by applying a fraction that's inversely related to the chosen period. The outcome is an average that reacts more quickly to recent price changes.
If the RMA option is selected: The average is computed by giving equal weight to all prices within the chosen period.
Both these averages then undergo a regularization process. Regularization, in this context, refers to adjusting the moving average using a factor to make it potentially more sensitive or responsive to price changes.
This regularized moving average can offer a refined perspective on price trends by being more adaptive to recent changes, potentially highlighting turning points or trend continuations more effectively.
█ Giga Kaleidoscope Modularized Trading System
Core components of an NNFX algorithmic trading strategy
The NNFX algorithm is built on the principles of trend, momentum, and volatility. There are six core components in the NNFX trading algorithm:
1. Volatility - price volatility; e.g., Average True Range, True Range Double, Close-to-Close, etc.
2. Baseline - a moving average to identify price trend
3. Confirmation 1 - a technical indicator used to identify trends
4. Confirmation 2 - a technical indicator used to identify trends
5. Continuation - a technical indicator used to identify trends
6. Volatility/Volume - a technical indicator used to identify volatility/volume breakouts/breakdown
7. Exit - a technical indicator used to determine when a trend is exhausted
8. Metamorphosis - a technical indicator that produces a compound signal from the combination of other GKD indicators*
*(not part of the NNFX algorithm)
What is Volatility in the NNFX trading system?
In the NNFX (No Nonsense Forex) trading system, ATR (Average True Range) is typically used to measure the volatility of an asset. It is used as a part of the system to help determine the appropriate stop loss and take profit levels for a trade. ATR is calculated by taking the average of the true range values over a specified period.
True range is calculated as the maximum of the following values:
-Current high minus the current low
-Absolute value of the current high minus the previous close
-Absolute value of the current low minus the previous close
ATR is a dynamic indicator that changes with changes in volatility. As volatility increases, the value of ATR increases, and as volatility decreases, the value of ATR decreases. By using ATR in NNFX system, traders can adjust their stop loss and take profit levels according to the volatility of the asset being traded. This helps to ensure that the trade is given enough room to move, while also minimizing potential losses.
Other types of volatility include True Range Double (TRD), Close-to-Close, and Garman-Klass
What is a Baseline indicator?
The baseline is essentially a moving average, and is used to determine the overall direction of the market.
The baseline in the NNFX system is used to filter out trades that are not in line with the long-term trend of the market. The baseline is plotted on the chart along with other indicators, such as the Moving Average (MA), the Relative Strength Index (RSI), and the Average True Range (ATR).
Trades are only taken when the price is in the same direction as the baseline. For example, if the baseline is sloping upwards, only long trades are taken, and if the baseline is sloping downwards, only short trades are taken. This approach helps to ensure that trades are in line with the overall trend of the market, and reduces the risk of entering trades that are likely to fail.
By using a baseline in the NNFX system, traders can have a clear reference point for determining the overall trend of the market, and can make more informed trading decisions. The baseline helps to filter out noise and false signals, and ensures that trades are taken in the direction of the long-term trend.
What is a Confirmation indicator?
Confirmation indicators are technical indicators that are used to confirm the signals generated by primary indicators. Primary indicators are the core indicators used in the NNFX system, such as the Average True Range (ATR), the Moving Average (MA), and the Relative Strength Index (RSI).
The purpose of the confirmation indicators is to reduce false signals and improve the accuracy of the trading system. They are designed to confirm the signals generated by the primary indicators by providing additional information about the strength and direction of the trend.
Some examples of confirmation indicators that may be used in the NNFX system include the Bollinger Bands, the MACD (Moving Average Convergence Divergence), and the MACD Oscillator. These indicators can provide information about the volatility, momentum, and trend strength of the market, and can be used to confirm the signals generated by the primary indicators.
In the NNFX system, confirmation indicators are used in combination with primary indicators and other filters to create a trading system that is robust and reliable. By using multiple indicators to confirm trading signals, the system aims to reduce the risk of false signals and improve the overall profitability of the trades.
What is a Continuation indicator?
In the NNFX (No Nonsense Forex) trading system, a continuation indicator is a technical indicator that is used to confirm a current trend and predict that the trend is likely to continue in the same direction. A continuation indicator is typically used in conjunction with other indicators in the system, such as a baseline indicator, to provide a comprehensive trading strategy.
What is a Volatility/Volume indicator?
Volume indicators, such as the On Balance Volume (OBV), the Chaikin Money Flow (CMF), or the Volume Price Trend (VPT), are used to measure the amount of buying and selling activity in a market. They are based on the trading volume of the market, and can provide information about the strength of the trend. In the NNFX system, volume indicators are used to confirm trading signals generated by the Moving Average and the Relative Strength Index. Volatility indicators include Average Direction Index, Waddah Attar, and Volatility Ratio. In the NNFX trading system, volatility is a proxy for volume and vice versa.
By using volume indicators as confirmation tools, the NNFX trading system aims to reduce the risk of false signals and improve the overall profitability of trades. These indicators can provide additional information about the market that is not captured by the primary indicators, and can help traders to make more informed trading decisions. In addition, volume indicators can be used to identify potential changes in market trends and to confirm the strength of price movements.
What is an Exit indicator?
The exit indicator is used in conjunction with other indicators in the system, such as the Moving Average (MA), the Relative Strength Index (RSI), and the Average True Range (ATR), to provide a comprehensive trading strategy.
The exit indicator in the NNFX system can be any technical indicator that is deemed effective at identifying optimal exit points. Examples of exit indicators that are commonly used include the Parabolic SAR, the Average Directional Index (ADX), and the Chandelier Exit.
The purpose of the exit indicator is to identify when a trend is likely to reverse or when the market conditions have changed, signaling the need to exit a trade. By using an exit indicator, traders can manage their risk and prevent significant losses.
In the NNFX system, the exit indicator is used in conjunction with a stop loss and a take profit order to maximize profits and minimize losses. The stop loss order is used to limit the amount of loss that can be incurred if the trade goes against the trader, while the take profit order is used to lock in profits when the trade is moving in the trader's favor.
Overall, the use of an exit indicator in the NNFX trading system is an important component of a comprehensive trading strategy. It allows traders to manage their risk effectively and improve the profitability of their trades by exiting at the right time.
What is an Metamorphosis indicator?
The concept of a metamorphosis indicator involves the integration of two or more GKD indicators to generate a compound signal. This is achieved by evaluating the accuracy of each indicator and selecting the signal from the indicator with the highest accuracy. As an illustration, let's consider a scenario where we calculate the accuracy of 10 indicators and choose the signal from the indicator that demonstrates the highest accuracy.
The resulting output from the metamorphosis indicator can then be utilized in a GKD-BT backtest by occupying a slot that aligns with the purpose of the metamorphosis indicator. The slot can be a GKD-B, GKD-C, or GKD-E slot, depending on the specific requirements and objectives of the indicator. This allows for seamless integration and utilization of the compound signal within the GKD-BT framework.
How does Loxx's GKD (Giga Kaleidoscope Modularized Trading System) implement the NNFX algorithm outlined above?
Loxx's GKD v2.0 system has five types of modules (indicators/strategies). These modules are:
1. GKD-BT - Backtesting module (Volatility, Number 1 in the NNFX algorithm)
2. GKD-B - Baseline module (Baseline and Volatility/Volume, Numbers 1 and 2 in the NNFX algorithm)
3. GKD-C - Confirmation 1/2 and Continuation module (Confirmation 1/2 and Continuation, Numbers 3, 4, and 5 in the NNFX algorithm)
4. GKD-V - Volatility/Volume module (Confirmation 1/2, Number 6 in the NNFX algorithm)
5. GKD-E - Exit module (Exit, Number 7 in the NNFX algorithm)
6. GKD-M - Metamorphosis module (Metamorphosis, Number 8 in the NNFX algorithm, but not part of the NNFX algorithm)
(additional module types will added in future releases)
Each module interacts with every module by passing data to A backtest module wherein the various components of the GKD system are combined to create a trading signal.
That is, the Baseline indicator passes its data to Volatility/Volume. The Volatility/Volume indicator passes its values to the Confirmation 1 indicator. The Confirmation 1 indicator passes its values to the Confirmation 2 indicator. The Confirmation 2 indicator passes its values to the Continuation indicator. The Continuation indicator passes its values to the Exit indicator, and finally, the Exit indicator passes its values to the Backtest strategy.
This chaining of indicators requires that each module conform to Loxx's GKD protocol, therefore allowing for the testing of every possible combination of technical indicators that make up the six components of the NNFX algorithm.
What does the application of the GKD trading system look like?
Example trading system:
Backtest: Multi-Ticker CC Backtest
Baseline: Hull Moving Average
Volatility/Volume: Hurst Exponent
Confirmation 1: Advance Trend Pressure as shown on the chart above
Confirmation 2: uf2018
Continuation: Coppock Curve
Exit: Rex Oscillator
Metamorphosis: Baseline Optimizer
Each GKD indicator is denoted with a module identifier of either: GKD-BT, GKD-B, GKD-C, GKD-V, GKD-M, or GKD-E. This allows traders to understand to which module each indicator belongs and where each indicator fits into the GKD system.
█ Giga Kaleidoscope Modularized Trading System Signals
Standard Entry
1. GKD-C Confirmation gives signal
2. Baseline agrees
3. Price inside Goldie Locks Zone Minimum
4. Price inside Goldie Locks Zone Maximum
5. Confirmation 2 agrees
6. Volatility/Volume agrees
1-Candle Standard Entry
1a. GKD-C Confirmation gives signal
2a. Baseline agrees
3a. Price inside Goldie Locks Zone Minimum
4a. Price inside Goldie Locks Zone Maximum
Next Candle
1b. Price retraced
2b. Baseline agrees
3b. Confirmation 1 agrees
4b. Confirmation 2 agrees
5b. Volatility/Volume agrees
Baseline Entry
1. GKD-B Baseline gives signal
2. Confirmation 1 agrees
3. Price inside Goldie Locks Zone Minimum
4. Price inside Goldie Locks Zone Maximum
5. Confirmation 2 agrees
6. Volatility/Volume agrees
7. Confirmation 1 signal was less than 'Maximum Allowable PSBC Bars Back' prior
1-Candle Baseline Entry
1a. GKD-B Baseline gives signal
2a. Confirmation 1 agrees
3a. Price inside Goldie Locks Zone Minimum
4a. Price inside Goldie Locks Zone Maximum
5a. Confirmation 1 signal was less than 'Maximum Allowable PSBC Bars Back' prior
Next Candle
1b. Price retraced
2b. Baseline agrees
3b. Confirmation 1 agrees
4b. Confirmation 2 agrees
5b. Volatility/Volume agrees
Volatility/Volume Entry
1. GKD-V Volatility/Volume gives signal
2. Confirmation 1 agrees
3. Price inside Goldie Locks Zone Minimum
4. Price inside Goldie Locks Zone Maximum
5. Confirmation 2 agrees
6. Baseline agrees
7. Confirmation 1 signal was less than 7 candles prior
1-Candle Volatility/Volume Entry
1a. GKD-V Volatility/Volume gives signal
2a. Confirmation 1 agrees
3a. Price inside Goldie Locks Zone Minimum
4a. Price inside Goldie Locks Zone Maximum
5a. Confirmation 1 signal was less than 'Maximum Allowable PSVVC Bars Back' prior
Next Candle
1b. Price retraced
2b. Volatility/Volume agrees
3b. Confirmation 1 agrees
4b. Confirmation 2 agrees
5b. Baseline agrees
Confirmation 2 Entry
1. GKD-C Confirmation 2 gives signal
2. Confirmation 1 agrees
3. Price inside Goldie Locks Zone Minimum
4. Price inside Goldie Locks Zone Maximum
5. Volatility/Volume agrees
6. Baseline agrees
7. Confirmation 1 signal was less than 7 candles prior
1-Candle Confirmation 2 Entry
1a. GKD-C Confirmation 2 gives signal
2a. Confirmation 1 agrees
3a. Price inside Goldie Locks Zone Minimum
4a. Price inside Goldie Locks Zone Maximum
5a. Confirmation 1 signal was less than 'Maximum Allowable PSC2C Bars Back' prior
Next Candle
1b. Price retraced
2b. Confirmation 2 agrees
3b. Confirmation 1 agrees
4b. Volatility/Volume agrees
5b. Baseline agrees
PullBack Entry
1a. GKD-B Baseline gives signal
2a. Confirmation 1 agrees
3a. Price is beyond 1.0x Volatility of Baseline
Next Candle
1b. Price inside Goldie Locks Zone Minimum
2b. Price inside Goldie Locks Zone Maximum
3b. Confirmation 1 agrees
4b. Confirmation 2 agrees
5b. Volatility/Volume agrees
Continuation Entry
1. Standard Entry, 1-Candle Standard Entry, Baseline Entry, 1-Candle Baseline Entry, Volatility/Volume Entry, 1-Candle Volatility/Volume Entry, Confirmation 2 Entry, 1-Candle Confirmation 2 Entry, or Pullback entry triggered previously
2. Baseline hasn't crossed since entry signal trigger
4. Confirmation 1 agrees
5. Baseline agrees
6. Confirmation 2 agrees

STD-Filtered, Regularized EMA/RMA [Loxx]STD-Filtered, Regularized EMA/RMA calculates and visualizes a standard deviation (STD) filtered, regularized version of the Exponential Moving Average (EMA) or Regular Moving Average (RMA) on a trading chart.
█ Understanding the Regularized Moving Average
The Regularized Moving Average, as conceptualized by Chris Satchwell, offers a more responsive interpretation compared to traditional moving averages. By incorporating a smoothing mechanism using "Lambda", this approach reduces lag without compromising the data's integrity.
In the realm of technical analysis, many regard it as a preferred alternative to the standard Moving Average and Exponential Moving Average.
█ How Does It Stand Out from Other Moving Averages?
While analysts traditionally shorten an indicator's length or period to minimize lag, the Regularized Moving Average uses a unique approach. By embedding "Regularization" within its computation, this method introduces Lambda (often symbolized as λ-calculus). This mathematical factor tames the moving average's undue fluctuations, offering more stability through its Lambda adjustments.
Pro Tip: For those analyzing smaller intraday timeframes, consider ramping up the Lambda setting to 6.0 or even higher. When tweaking these settings, always remember to backtest and observe how it impacts signal accuracy and noise filtering.
█ Standard Deviation Filtering:
This filtering mechanism is designed to smoothen price data by eliminating minor fluctuations that might be considered "noise". Here's how the process works:
For every data point, the standard deviation of prices over a specified period is calculated.
This standard deviation is then multiplied by a user-defined value to determine a threshold. This threshold defines the magnitude of change required in the price for it to be considered significant.
For each price, if the absolute difference between its current and previous value is less than this threshold, the price is kept unchanged (considered insignificant and thus filtered). If the difference exceeds the threshold, the price is considered significant and remains as is.
By applying this filter, minor price variations within the threshold are disregarded, resulting in a smoother representation of the price data.
█ Moving Average Calculation:
The script provides an option to calculate either a regularized Exponential Moving Average (EMA) or a Regular Moving Average (RMA). Here's how these are approached:
If the EMA option is selected: A weighted formula is used where more recent prices have a higher influence on the average than older prices. This is achieved by applying a fraction that's inversely related to the chosen period. The outcome is an average that reacts more quickly to recent price changes.
If the RMA option is selected: The average is computed by giving equal weight to all prices within the chosen period.
Both these averages then undergo a regularization process. Regularization, in this context, refers to adjusting the moving average using a factor to make it potentially more sensitive or responsive to price changes.
This regularized moving average can offer a refined perspective on price trends by being more adaptive to recent changes, potentially highlighting turning points or trend continuations more effectively.
█ Extras
Signals
Alerts
Bar coloring
Weighted Oscillator Convergence DivergenceThe Weighted Oscillator Convergence Divergence (WOCD) aims to help traders identify potential trend reversals or momentum shifts in financial markets by calculating and visualizing the difference between a smoothed oscillator (WMA) value and its exponential moving average (EMA) and simple moving average (SMA) counterparts. This indicator is particularly useful for traders who want an alternative perspective on price momentum and divergence.
Key Features:
Inputs:
Length: The user can specify the number of bars to consider for calculations (default is 9).
Smoothing 1: Defines the smoothing factor for the first smoothed value (default is 5).
Smoothing 2: Specifies the smoothing factor for the second smoothed value (default is 7).
Ma Type: There are three types of moving averages you can choose (Wilder, non-lag, Weighted is by default).
Color Settings: Users can customize the indicator's colors for various elements, such as length, smoothing values, and different sections of the histogram.
Calculation:
WOCD calculates the raw oscillator value by subtracting the close price from a 3-period High, Low, Close (HLC3) moving average.
It then applies smoothing to this raw oscillator value using two different methods: exponential moving average (EMA) and simple moving average (SMA) with user-defined smoothing periods.
Histogram Plot:
The indicator plots a histogram based on the difference between the smoothed oscillator and the first smoothed value.
When the histogram is above zero and rising, it is colored according to the "Above Grow" color setting. When it's above zero and falling, it uses the "Fall" color for visualization.
Similarly, when the histogram is below zero and rising, it is colored according to the "Below Grow" color setting, and when it's below zero and falling, it uses the "Fall" color.
Oscillator and Smoothed Values:
The indicator also plots the smoothed oscillator, smoothed value 1 (EMA-based), and smoothed value 2 (SMA-based) on the chart.
Zero Line:
A horizontal line at zero is drawn on the chart for reference.
How to Use the WOCD Indicator:
Trend Identification: Observe the histogram's direction and color. A rising histogram above zero may indicate bullish momentum, while a falling histogram below zero could signal bearish momentum.
Divergence: Look for divergences between price action and the histogram. When the histogram and price move in opposite directions, it can be a potential reversal signal.
Crossovers: Pay attention to crossovers between the smoothed oscillator and its smoothed counterparts (EMA and SMA). These crossovers can indicate changes in trend strength or direction.
Zero Line: The zero line can act as a reference point. Positive histogram values suggest bullish sentiment, while negative values indicate bearish sentiment.
Comparison to MACD Indicator:
The WOCD indicator shares some similarities with the Moving Average Convergence Divergence (MACD) indicator but also has distinct differences:
Similarities:
Both WOCD and MACD are momentum oscillators designed to identify potential trend reversals and divergences.
They use moving averages (EMA in the case of MACD) to smooth the raw oscillator values.
Both indicators provide histogram representations of the difference between the oscillator and its smoothed counterpart.
Differences:
WOCD uses a 3-period High, Low, Close (HLC3) moving average to calculate the raw oscillator value, whereas MACD uses the difference between two exponential moving averages (usually 12-period and 26-period EMAs).
The smoothing in WOCD employs both EMA and SMA, while MACD exclusively uses EMA.
WOCD allows users to customize colors for various elements, enhancing visual clarity.

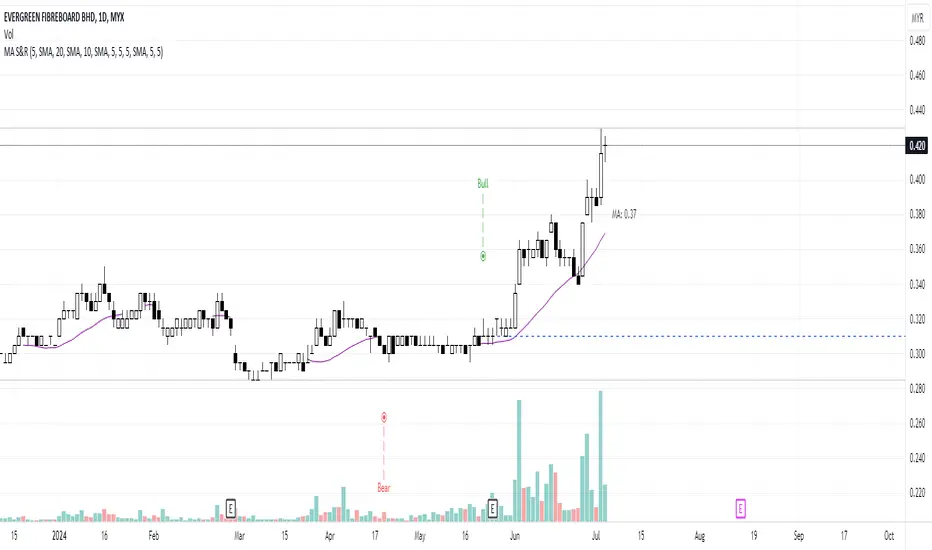
MA Support & Resistance SignalThis indicator is to show MA Support/Resistance and trend of a stock.
It contains three (3) Moving Averages that can be set to SMA or EMA:
1. Upper Line : SMA 5 (default)
2. Lower Line : SMA 20 (default)
3. Support/Resistance Line : SMA 10 (default)
Other signals:
1. Bull and Blue Dotted Line signal: Upper Line (SMA 5) crossover with Lower Line (SMA 20).
2. Bear and Red Dotted Line signal: Lower Line (SMA 20) crossover with Upper Line (SMA 5).
3. Red Triangle signal: Price closes below Support/Resistance Line (SMA 10).
4. Green Bar signal: Price breaks Support/Resistance Line (SMA 10).
The way how I use it:
- Since I don't like my chart to be crowded with a lot of moving averages, I will disable SMA 5 and SMA 10 and will only leave SMA 20 as my final support line.
- Entry when only:
1. Bull signal appeared.
2. Green bar appeared, or;
3. Price rebound on SMA 20.
I let the script open so that you guys can custom it based on your own preferences. Hope you guys enjoy it.
Moving Averages w/Signals [CSJ7]Unlock the power of three dynamic moving averages: Fast, Medium, and Slow. Choose between the reliability of Simple or the responsiveness of Exponential MAs. Plus, with our tailored Buy and Sell signals based on user-defined crossing scenarios, you're equipped with a clear roadmap in the ever-changing landscape of the markets.
1. Spot Trends with Ease: Our color-coded system makes identifying the market's direction intuitive. Green signals bullish momentum, while red indicates bearish movements.
2. Precision Signals: Navigate the markets confidently with our Buy and Sell signals, designed to highlight potential entry and exit points.
3. Gauge Trend Strength: The color intensity between the Medium and Slow MAs offers a visual cue on the trend's strength, ensuring you're always in the know.
Limitations:
- Inherent Lag: As with all moving average tools, there's a natural delay. But it's this reflective nature that offers valuable insights.
- Stay Alert in Sideways Markets: During consolidative phases, the indicator might produce occasional false signals. Always cross-reference with other tools.
- Customization is Key: The tool's true potential shines when you adjust the settings to align with your trading style and strategy.
4. How to Use:
Quick Setup: Select your preferred MA type, set the lengths, and define your ideal crossover scenarios. It's that simple!
Interpreting Signals: A green triangle below the price suggests a potential buying zone, while a red triangle above hints at a selling opportunity.
Trend Insights: The color gradient between the Medium and Slow MAs offers a visual representation of the trend's vigor. The more vibrant, the stronger the trend.
Elevate your trading strategy with the Moving Averages w/Signals & AutoTrade . With clarity and precision, it's the companion every trader deserves.

Alxuse Supertrend 4EMA Buy and Sell for tutorialAll abilities of Supertrend, moreover :
Drawing 4 EMA band & the ability to change values, change colors, turn on/off show.
Sends Signal Sell and Buy in multi timeframe.
The ability used in the alert section and create customized alerts.
To receive valid alerts the replay section , the timeframe of the chart must be the same as the timeframe of the indicator.
Supertrend with a simple EMA Filter can improve the performance of the signals during a strong trend.
For detecting the continuation of the downward and upward trend we can use 4 EMA colors.
In the upward trend , the EMA lines are in order of green, blue, red, yellow from bottom to top.
In the downward trend, the EMA lines are in order of yellow, red, blue, green from bottom to top.
How it works:
x1 = MA1 < MA2 and MA2 < MA3 and MA3 < MA4 and ta.crossunder(MA3, MA4)
x2 = MA1 < MA2 and MA2 < MA3 and MA3 < MA4 and ta.crossunder(MA2, MA3)
x3 = MA1 < MA2 and MA2 < MA3 and MA3 < MA4 and ta.crossunder(MA1, MA2)
y1 = MA4 < MA3 and MA3 < MA2 and MA2 < MA1 and ta.crossover(MA3, MA4)
y2 = MA4 < MA3 and MA3 < MA2 and MA2 < MA1 and ta.crossover(MA2, MA3)
y3 = MA4 < MA3 and MA3 < MA2 and MA2 < MA1 and ta.crossover(MA1, MA2)
Red triangle = x1 or x2 or x3
Green triangle = y1 or y2 or y3
Long = BUY signal and followed by a Green triangle
Exit Long = SELL signal
Short = SELL signal and followed by a Red triangle
Exit Short = BUY signal
It is also possible to get help from the Stochastic RSI and MACD indicators for confirmation.
For receiving a signal with these two conditions or more conditions, i am making a video tutorial that I will release soon.
Supertrend
Definition
Supertrend is a trend-following indicator based on Average True Range (ATR). The calculation of its single line combines trend detection and volatility. It can be used to detect changes in trend direction and to position stops.
The basics
The Supertrend is a trend-following indicator. It is overlaid on the main chart and their plots indicate the current trend. A Supertrend can be used with varying periods (daily, weekly, intraday etc.) and on varying instruments.
The Supertrend has several inputs that you can adjust to match your trading strategy. Adjusting these settings allows you to make the indicator more or less sensitive to price changes.
For the Supertrend inputs, you can adjust atrLength and multiplier:
the atrLength setting is the lookback length for the ATR calculation;
multiplier is what the ATR is multiplied by to offset the bands from price.
When the price falls below the indicator curve, it turns red and indicates a downtrend. Conversely, when the price rises above the curve, the indicator turns green and indicates an uptrend. After each close above or below Supertrend, a new trend appears.
Summary
The Supertrend helps you make the right trading decisions. However, there are times when it generates false signals. Therefore, it is best to use the right combination of several indicators. Like any other indicator, Supertrend works best when used with other indicators such as MACD, Parabolic SAR, or RSI.
Exponential Moving Average
Definition
The Exponential Moving Average (EMA) is a specific type of moving average that points towards the importance of the most recent data and information from the market. The Exponential Moving Average is just like it’s name says - it’s exponential, weighting the most recent prices more than the less recent prices. The EMA can be compared and contrasted with the simple moving average.
Similar to other moving averages, the EMA is a technical indicator that produces buy and sell signals based on data that shows evidence of divergence and crossovers from general and historical averages. Additionally, the EMA tries to amplify the importance that the most recent data points play in a calculation.
It is common to use more than one EMA length at once, to provide more in-depth and focused data. For example, by choosing 10-day and 200-day moving averages, a trader is able to determine more from the results in a long-term trade, than a trader who is only analyzing one EMA length.
It’s best to use the EMA when for trending markets, as it shows uptrends and downtrends when a market is strong and weak, respectively. An experienced trader will know to look both at the line the EMA projects, as well as the rate of change that comes from each bar as it moves to the next data point. Analyzing these points and data streams correctly will help the trader determine when they should buy, sell, or switch investments from bearish to bullish or vice versa.
Short-term averages, on the other hand, is a different story when analyzing Exponential Moving Average data. It is most common for traders to quote and utilize 12- and 26-day EMAs in the short-term. This is because they are used to create specific indicators. Look into Moving Average Convergence Divergence (MACD) for more information. Similarly, the 50- and 200-day moving averages are most common for analyzing long-term trends.
Moving averages can be very useful for traders using technical analysis for profit. It is important to identify and realize, however, their shortcomings, as all moving averages tend to suffer from recurring lag. It is difficult to modify the moving average to work in your favor at times, often having the preferred time to enter or exit the market pass before the moving average even shows changes in the trend or price movement for that matter.
All of this is true, however, the EMA strives to make this easier for traders. The EMA is unique because it places more emphasis on the most recent data. Therefore, price movement and trend reversals or changes are closely monitored, allowing for the EMA to react quicker than other moving averages.
Limitations
Although using the Exponential Moving Average has a lot of advantages when analyzing market trends, it is also uncertain whether or not the use of most recent data points truly affects technical and market analysis. In addition, the EMA relies on historical data as its basis for operating and because news, events, and other information can change rapidly the indicator can misinterpret this information by weighting the current prices higher than when the event actually occurred.
Summary
The Exponential Moving Average (EMA) is a moving average and technical indicator that reflects and projects the most recent data and information from the market to a trader and relies on a base of historical data. It is one of many different types of moving averages and has an easily calculable formula.
The added features to the indicator are made for training, it is advisable to use it with caution in tradings.

Crypto Notes Scalping Indicator by Mohsin
**Crypto Notes Indicator**
This custom trading indicator, named "Crypto Notes," is designed to assist traders in analyzing cryptocurrency price movements. It combines two key components: the SSL (Stochastic Support and Resistance) channel and a Moving Average.
**Indicator Components:**
1. **SSL Channel:**
- The SSL channel is a technical analysis tool that helps identify potential support and resistance levels in the cryptocurrency price chart.
- The indicator calculates two values: `sslDown` and `sslUp`, which represent potential support and resistance levels, respectively.
- The SSL channel is based on a user-defined period and length, allowing traders to customize the sensitivity of the support and resistance levels.
2. **Buy and Sell Signals:**
- Buy and sell signals are generated when the `sslUp` crosses above `sslDown` (a buy signal) or when `sslUp` crosses below `sslDown` (a sell signal).
- These signals help traders identify potential entry and exit points for their cryptocurrency trades.
3. **Moving Average (MA1):**
- The indicator also includes a customizable exponential moving average (EMA) with a length defined by the user.
- This moving average (MA1) can be used to smooth out price data and identify trends in the cryptocurrency's price movement.
**How to Use:**
1. **SSL Channel:** The SSL channel visually represents potential support and resistance levels on the price chart. Traders can observe price behavior concerning these levels to make trading decisions.
2. **Buy Signals:** Buy signals are labeled as "BUY" on the chart when `sslUp` crosses above `sslDown`. This is an indication of a potential bullish trend or an opportune time to enter a long position.
3. **Sell Signals:** Sell signals are labeled as "SELL" on the chart when `sslUp` crosses below `sslDown`. This suggests a potential bearish trend or an opportune time to exit a long position or consider shorting.
4. **Moving Average (MA1):** The customizable moving average (MA1) can help traders identify trends in the cryptocurrency's price movement. When MA1 is above the price, it may suggest an uptrend, and when it's below, it may suggest a downtrend.
**Customization:**
- Traders can adjust the indicator's parameters, such as the SSL channel period, length, and the length of the EMA (MA1), to suit their specific trading strategies and preferences.
**Disclaimer:** This indicator is a tool for technical analysis and does not provide financial advice. Trading cryptocurrencies involves risks, and users should conduct thorough research and risk management before making any trading decisions.
**Note:** It's essential to thoroughly test this indicator and incorporate it into a comprehensive trading strategy before using it for actual trading.
---
Please ensure you understand the indicator's functionality and consider using it alongside other tools and analysis methods as part of your trading strategy.

SMA/EMA/RSImagic 36.963 by IgorPlahutaTwo Elements in this script:
Alerts: These are notifications that draw your attention to specific market conditions. There are two types:
RSI Higher Lows or Lower Highs: This alert triggers when the Relative Strength Index (RSI) forms higher lows or lower highs.
RSI Exiting 30 (Up) or RSI Exiting 70 (Down): These alerts activate when the RSI crosses the 30 threshold upwards or the 70 threshold downwards.
ALL BUY/SELL: to catch both of them with one setting
To Set Up an Alert: To configure an alert, select the one relevant to your trading strategy, choose the "Greater than" option, and input a value of "0" (this essentially activates the alert). Adjust other settings as per your requirements.
Please note that these alerts should be used in conjunction with a system you trust for confirmation.
Moving Averages: This involves monitoring several moving averages:
SMA12, SMA20, EMA12, EMA20: These moving averages are highlighted with background colors to help you quickly identify changes or crossovers. They are superimposed on each other for easy comparison.
SMA 50, SMA200: These moving averages are also highlighted with background colors to spot crossovers, and their lines change color depending on their direction (falling in red or rising in green).
Enjoy using these tools in your trading endeavors!


EMA & Camarilla StrategyChat GPT based , 20, 200 EMA Strategy
This script calculates EMAs (5, 20, and 200), Camarilla Pivot Points, and checks for your specified candlestick pattern conditions. It then generates buy and sell signals based on the EMA crossover and the candlestick pattern. Stop loss is calculated as the lowest low of the last 5 bars, and the target is set at the Camarilla pivot point (you can customize these values).

EMA x 3 MAsThis indicator can be used for moving average strategies based on a EMA trigger over MAs (SMAs) : MA1 , MA2 , MA3 .
Based on those crossings, the background color will change for the upcoming candle showing green for upper crossing change (the more MA are crossed, the darker is the background). Order and priority of background colors :
1/ EMA x MA1
2/ EMA x MA2 (if EMA x MA1 confirmed)
3/ EMA x MA3 (if EMA x MA1and EMA x MA2 confirmed)
EMA and MAs can also be tuned with your own values in the parameters, therefore allowing you to try different strategies and to use the EMA and MAs as support/resistance indication.
You can set up the background and lines colors in the Style in the parameters.

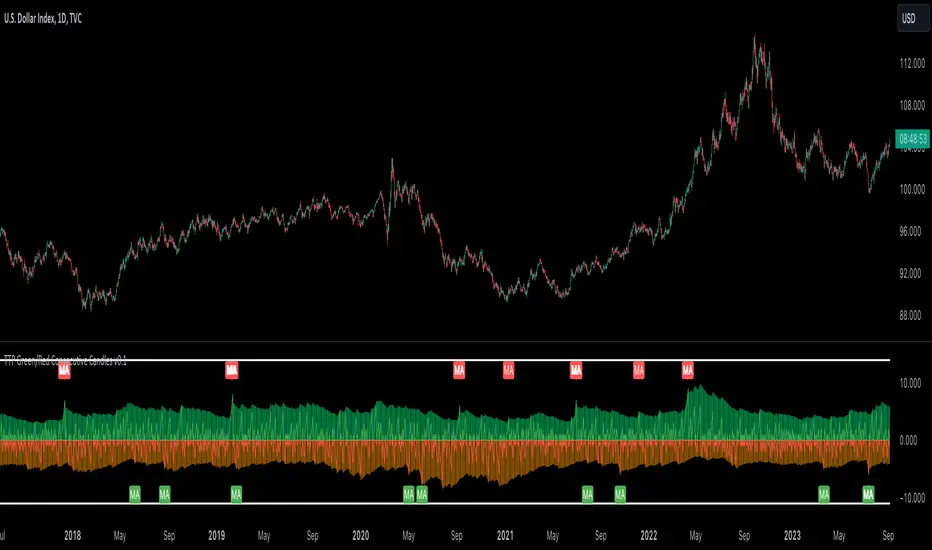
TTP Green/Red Consecutive CandlesThis indicator counts consecutive green/red candles offering some basic statistics and signals/alerts.
Features
- Counts consecutive green/red candles in an oscillator chart
- Moving average of the counting helps spotting when the consecutive candles are away from the mean. MA length and multiplier to adjust the signal sensitivity.
- Thresholds can be set to backtest and send alerts on any number of arbitrary consecutive candles of the same color.
- All time highs: the indicator keeps track of when the maximum has been reached
- Distribution data: the number of times each number of consecutive color candles has been reached is offered
Signals
- Threshold signal triggers when the number of candles of the same color is above the specified threshold.
- MA cross signal triggers when the number of candles of the same color is above the MA.
MA Directional Table"MA Directional Table" primary objective is to analyze the direction of the trend based on two Moving Averages (MA) for various timeframes and customizing the inputs to match your preferred style.
Features:
Moving Average Type: You can select which type of Moving Average to use (SMA, EMA, VWMA).
Moving Average Lengths: You can set the lengths for the short-term and long-term moving averages.
Table Position: The indicator provides a table which can be placed at the top or bottom, and to the left or right of the chart. It shows the trend status for multiple timeframes (1 min, 5 min, 15 min, 1 hour, 4 hours, 1 day).
Table Orientation: The table can be oriented either horizontally or vertically.
Price Condition: Optionally, the table color can be set to yellow if the current price deviates from the Moving Average trend and crosses MA1.
Cloud Settings: You can opt to show a cloud between the two moving averages. The color of the cloud changes based on the direction of the trend (bullish or bearish).
Extra MA: Optionally, an extra Moving Average can be plotted on the chart.

Super Cloud Support and Resistance Signal [5ema]This indicator can supply the trending and signal.
-----
How to calculate?
The cloud be create by the min/max of the EMA lines:
+ (avg(EMA(source, 20), EMA(source, 50), EMA(source, 200), EMA(source, 460), EMA(source, 610))
+ with source = high / low / open and close.
The signal bar is a reversal candle pattern such as engulfing, hammer, ....
For avoid to against the trend, use the number left bars are completely above or below the cloud.
-----
How to set up?
Input the number left bars to get the number left bars are completely above or below the cloud. Its purpose is avoid to get signal against the trend. Can set it bigger than 2.
Can filter the signal only buy or only sell to follow the current trend.
-----
How to use?
Refer the trend cloud:
Can refer the signal:
Make an alert when signal appear.
-----
This indicator is for reference only, you need your own method and strategy.
If you have any questions, please let me know in the comments.

Reversal Signal [5ema]This indicator can find a reversal point when the price is oversold, the breakout is far from the EMA.
-----
How to calculate?
Find the minimum (maximum) value on five EMAs: 20, 50, 200, 460, 610.
Calculate the number left bars with condition that is completely above (below) the min (max) EMA line.
The signal bar is Engulfing bar.
-----
How to appear signal?
Have signal bar cross the min (max) EMA line.
The number left bars that is completely above (below) the min (max) EMA line greater than inputting.
-----
How to use?
Can change the value of EMAs to suitable with symbols and strategy.
Can change the number left bars to suitable with symbols and strategy.
Can see the trend cloud to recognize the trending.
Review a strategy when appear the signal on chart.
Make the alert when appear the signal.
Can choose only Buy or Sell signal.
-----
This indicator is for reference only, you need your own method and strategy.
If you have any questions, please let me know in the comments.

13E2113E21 is a strategy based on the concept of "Buy-on-Dip" and "Sell-on-Rise". The strategy is built around the concept that as the market starts trending in a particular direction it will give a retrace to it's 13 exponential moving average price and then continue in it's trend thus forming higher lows (or lower highs) in the process.
The indicator 13E21 helps determine the 2 EMAs (13 and 21) and also highlights the candle that touches either EMAs and closes accordingly.
The edge in the code is that it makes use of the difference between the two EMAs as a signal of the market trending. It will trigger an entry only when the difference between the two EMAs is greater than 0.02% thus implying that the market is actually trending and not consolidating.
The indicator will give bullish triggers only when the price touches 13EMA or 21EMA, the closing price is greater than 13EMA and the difference between 13EMA and 21EMA is greater than 0.02% or 10 points.
Similarly, the indicator will give bearish triggers only when the price touches 13EMA or 21EMA, the closing price is less than 13EMA and the difference between 13EMA and 21EMA is greater than 0.02% or 10 points.

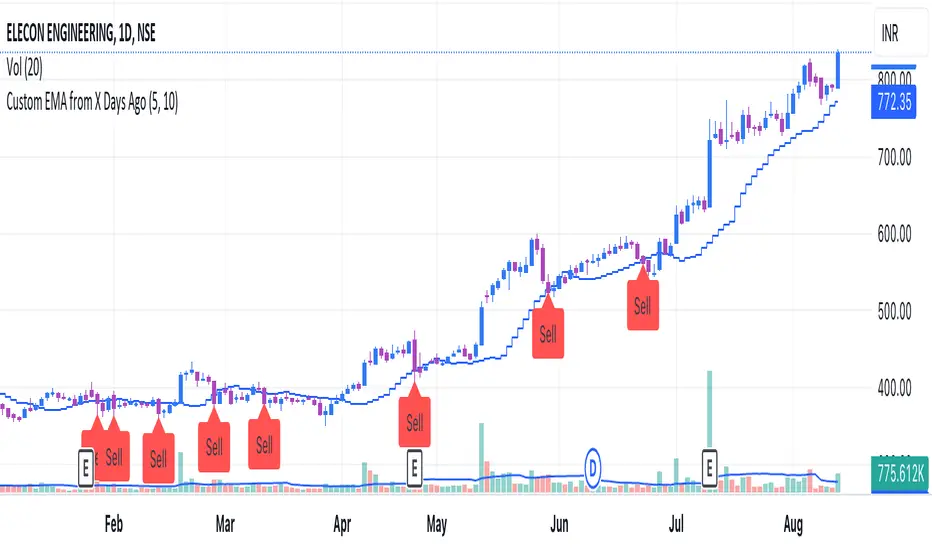
Custom EMA from X Days AgoThis is an indicator to plot the selected EMA value from X days ago on today's candle.
Or it will helps to plot the previous candle's EMA value on current candle.
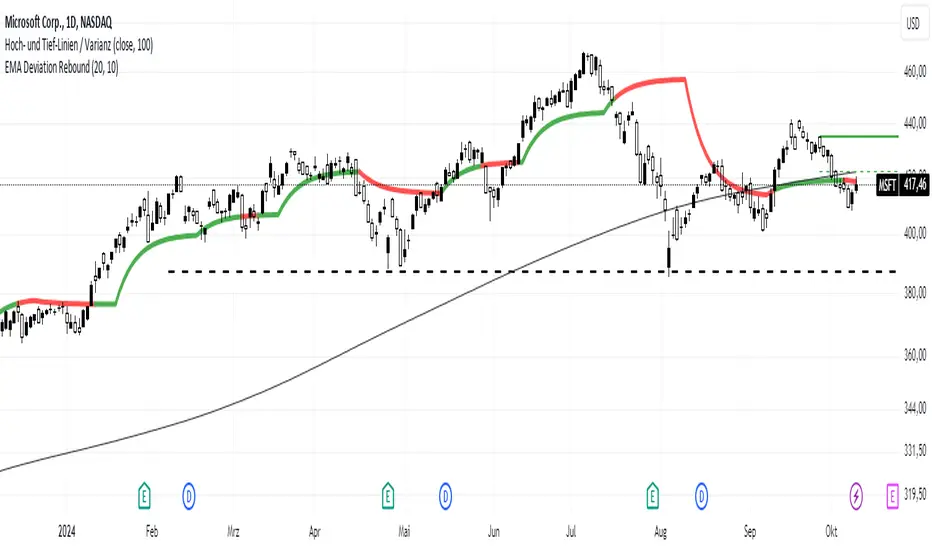
EMA Deviation ReboundThe " EMA Deviation Rebound " indicator I've created utilizes calculations involving the standard deviation of closing prices and exponential moving averages (EMA) to generate a line. The color of this line changes based on whether the EMA value is above or below the current closing price. This can be interpreted as an indicator for potential buy or sell signals:
Buy Signal: If the price crosses the indicator from bottom to top, this can be considered a buy signal. This could indicate that the price has overcome a resistance and a potential upward movement may be forthcoming.
Sell Signal: If the price crosses the indicator from top to bottom, this could serve as a sell signal. This might suggest that the price has broken a support downward and possibly indicates an impending downward movement.
The indicator is named "EMA Deviation Rebound" because I use it to identify potential resistance and support levels. When the price rebounds at the indicator, this could signify a price movement in the opposite direction.
It's important to use such indicators in conjunction with other analysis techniques and market information to make informed trading decisions.
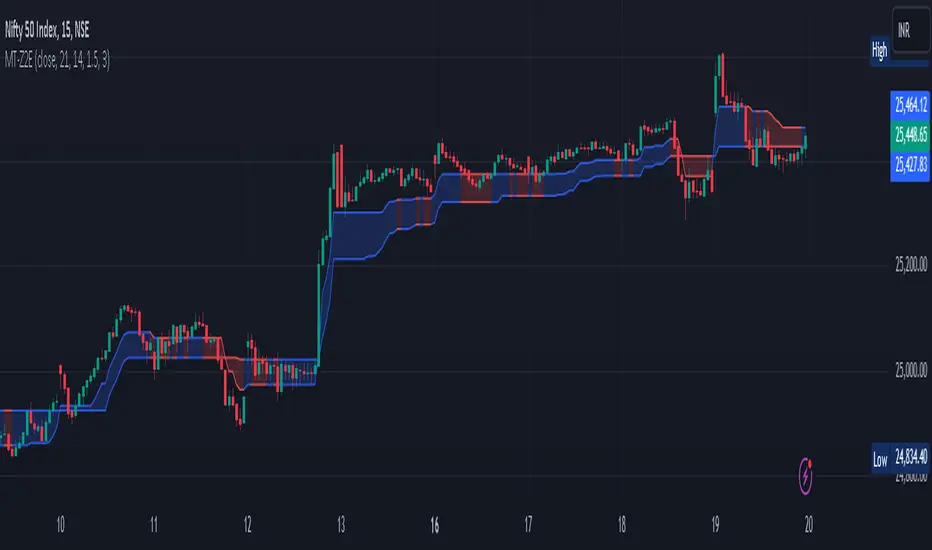
Magic Trend By Market Mindset - Zero To EndlessMagic Trend indicator is an indicator combining the Commodity Channel Index (CCI) and the Average True Range (ATR) indicators.
The indicator is represented by a line that turns red when CCI readings are below 0 and converts to blue when CCI reaches above 0.
Color of the line can be treated as a trend indicator.
When CCI > 0 (Blue Color), price is assumed to be in uptrend and a buying momentum could be seen.
When CCI < 0 (Red Color), price is assumed to be in downtrend and a selling pressure could be seen.
Two Multipliers of ATR have been used. Default values for multiploier are : 1.5 and 3.0
It tells about the volatality in the price and also helps in deciding Entry poits, Stop loss points and sometimes Exit points.
If trend magic lines are not straight and moving upward/downward, continuition of the trend is expected and so Holding the position is adviced.
If the farther line (line with multiplier 3.0) is broken, a trend reversal can be seen soon.
In this case, squaring off and making reverse position is adviced near the other (1.5 mult) line.
If price is revolving in between these two lines... a sideways movement is expected.
Happy Trading
Market Mindset
EMA Angle Trend StrengthEATS is an innovative indicator that calculates the slope of the exponential moving average (EMA) over a defined number of candles, presenting this on a scale of 0 to 100.
Users can individually adjust the length of the EMA and the precision of slope calculation. For the EMA length, users can specify the number of candles used for the EMA calculation. In terms of precision, the user can define the number of candles over which the slope calculation takes place.
The EATS indicator uses a mathematical function to calculate the angle of slope of the EMA. The resulting slope is converted into degrees and then portrayed on a scale of 0 to 100 using the "eats" function.
This indicator can be a useful tool for traders looking to evaluate a market's momentum and identify potential trend shifts. It allows you to visualize the strength a trend based on the angle of the EMA slope, offering a complementary perspective to traditional price and volume indicators.
Please note that as with all indicators, the EATS indicator should not be used as a standalone trading tool. It should always be used in combination with other technical analyses and/or fundamental analyses to make the most informed trading decisions.

Buy/Sell EMA CandleThis indicator is designed to display various technical indicators, candle patterns, and trend directions on a price chart. Let's break down the code and explain its different sections:
Exponential Moving Averages (EMA):
The code calculates and plots five EMAs of different lengths (13, 21, 55, 90, and 200) on the price chart. These EMAs are used to identify trends and potential crossovers.
Engulfing Candle Patterns:
The code identifies and highlights potential bullish and bearish engulfing candle patterns. It checks if the current candle's body size is larger than the combined body sizes of the previous and subsequent four candles. If this condition is met, it marks the pattern on the chart.
s3.tradingview.com
EMA Crossovers:
The code identifies and highlights points where the shorter EMA (ema1) crosses above or below the longer EMA (ema2). It plots circles to indicate these crossover points.
Candle Direction and RSI Trend:
The code determines the trend direction of the last candle based on whether it closed higher or lower than its open price. It also calculates the RSI (Relative Strength Index) and determines its trend direction (overbought, oversold, or neutral) based on predefined thresholds.
s3.tradingview.com
Table Display:
The code creates a table displaying trend directions for different timeframes (monthly, weekly, daily, 4-hour, and 1-hour) for candle direction and RSI trends. The trends are labeled with "L" for long, "S" for short, and "N/A" for not applicable.
High Volume Bars (HVB):
The code identifies and colors bars with above-average volume as either bullish or bearish based on whether the price closed higher or lower than it opened. The color and conditions for high volume bars can be customized.
s3.tradingview.com
Doji Candle Pattern:
The code identifies and marks doji candle patterns, where the open and close prices are very close to each other within a certain percentage of the candle's high-low range.
RSI-Based Candle Coloring:
The code adjusts the color of the candles based on the RSI value. If the RSI value is above the overbought threshold or below the oversold threshold, the candles are colored yellow.
Usage and Interpretation:
Traders can use this indicator to identify potential trend changes based on EMA crossovers and candle patterns like engulfing and doji.
The RSI trend direction can provide additional insight into potential overbought or oversold conditions.
High volume bars can indicate potential price reversals or continuation patterns.
The table provides an overview of trend directions on different timeframes for both candle direction and RSI trends.
Keep in mind that this is a complex indicator with multiple features. Users should carefully evaluate its performance and consider combining it with other indicators and analysis methods for more accurate trading decisions.
The table is designed to provide a consolidated view of trend directions and other indicators across multiple timeframes. It is displayed on the chart and organized into rows and columns. Each row corresponds to a specific aspect of analysis, and each column corresponds to a different timeframe.
Here's a breakdown of the components of the table:
Row 1: Separation.
Row 2 (Header Row): This row contains the headers for the columns. The headers represent the different timeframes being analyzed, such as Monthly (M), Weekly (W), Daily (D), 4-hour (4h), and 1-hour (1h).
Row 3 (Content Row): This row contains labels indicating the types of information being displayed in the columns. The labels include "T" for Trend, "C" for Current Candle, and "R" for RSI Trend.
Row 4 and Onwards: These rows display the actual data for each aspect of analysis across different timeframes.
For each aspect of analysis (Trend, Current Candle, RSI Trend), the corresponding rows display the following information:
Monthly (M): The trend direction for the given aspect on the monthly timeframe.
Weekly (W): The trend direction for the given aspect on the weekly timeframe.
Daily (D): The trend direction for the given aspect on the daily timeframe.
4-hour (4h): The trend direction for the given aspect on the 4-hour timeframe.
1-hour (1h): The trend direction for the given aspect on the 1-hour timeframe.
The trend directions are represented by labels such as "L" for Long, "S" for Short, or "N/A" for Not Applicable.
The table's purpose is to provide a quick overview of trend directions and related information across multiple timeframes, aiding traders in making informed decisions based on the analysis of trend changes and other indicators.

Naresh CE with 13 62 crossThank you to Lauris, for sharing knowledge and logic for the EMA cross-over (13/62).
The provided Pine Script is a custom script, which is designed to display Chandelier Exit levels on the price chart and generate buy and sell labels based on specific conditions.
Here's a breakdown of the key components and logic of the Pine Script:
Exponential Moving Averages (EMAs):
ema1: The 13-period Exponential Moving Average (EMA) of the closing price.
ema2: The 62-period Exponential Moving Average (EMA) of the closing price.
EMA Plotting:
The script plots the ema1 (13 EMA) and ema2 (62 EMA) lines on the price chart using the plot() function.
Chandelier Exit Calculation:
The Chandelier Exit values are calculated using the Average True Range (ATR).
The script calculates the atr (Average True Range) using the atr() function with the given length.
longStop is calculated as the highest price of the specified length minus the ATR, and shortStop is calculated as the lowest price plus the ATR.
Directional Indicator (dir):
The dir variable is used to determine the direction of the Chandelier Exit based on the comparison of the current close price with the previous long and short stops.
Buy and Sell Signals:
The script generates buy signals when the Chandelier Exit direction changes from short to long (buySignal).
Similarly, sell signals are generated when the Chandelier Exit direction changes from long to short (sellSignal).
The conditions for buy and sell signals are based on the value of dir and its previous value.
Buy and Sell Labels:
Buy and sell labels are plotted on the chart using plotshape() based on the generated buy and sell signals.
The showLabels input parameter controls whether to display the buy and sell labels.
Highlighting States:
The script fills the chart area with color (green for long, red for short) based on the direction of the Chandelier Exit values.
The highlightState input parameter controls whether to apply this highlighting.
Alerts:
The script includes alert conditions based on the direction change (changeCond), buy signal (buySignal), and sell signal (sellSignal) using the alertcondition() function.
The script aims to help traders identify potential buy and sell signals based on the Chandelier Exit levels derived from the 13 EMA and 62 EMA crossovers. The Chandelier Exit values can serve as dynamic stop-loss levels for long and short positions.
