25 EMA High-Low Band with 200 EMA by Basanta25 EMA High-Low Band with 200 EMA by Basanta.
This indicator is purely for Trend Trading by observing the Exponential moving average 200.
When the price is above EMA 200 it is considered Bullish and When the price is below EMA 200 it is considered Bearish. Entry will be made in pullback of 25 EMA.
Emacrossover

EMA Color Flip Strategy + ATR Risk BoxesEMA ColorFlip Strategy
A trend-following strategy that captures EMA color flips for high-probability intraday setups on Ethereum (ETH), Solana (SOL), and Dogecoin (DOGE). Uses ATR-based dynamic risk boxes to define precise entry zones, stop losses, and profit targets with asymmetric risk-reward.
The approach focuses on clean trend shifts across multiple timeframes, filtering for sustained momentum moves while maintaining tight risk control. Designed for futures and crypto trading with consistent position sizing.
Happy New Year! The strategy is off to a strong start in 2026 - here's to continued performance throughout the year! 🚀📈

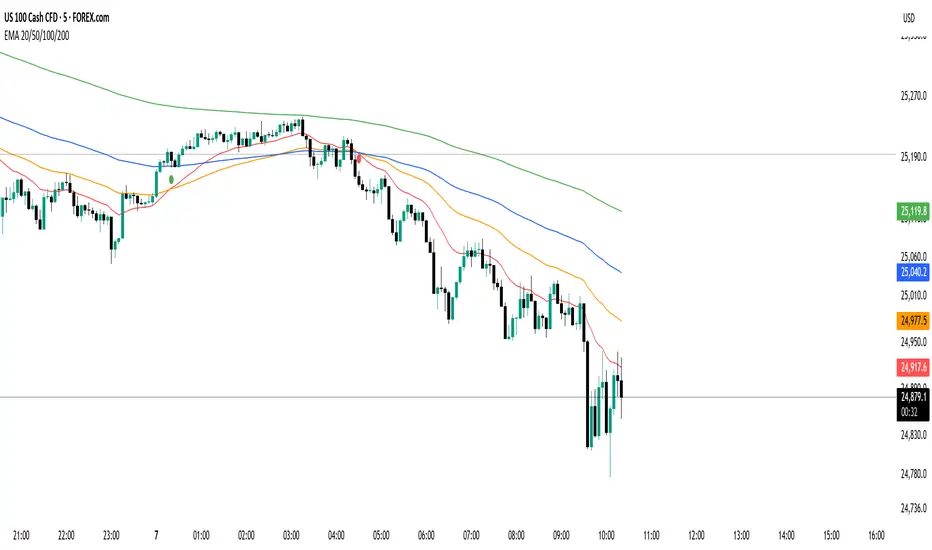
Multi Moving Average (EMA / SMA) - 4 Periods📈 Indicator Overview – Multi Moving Average (EMA / SMA)
This indicator is designed to help traders analyze trend direction and market structure using multiple moving averages in a single, clean tool.
The user can select the type of moving average—either Exponential Moving Average (EMA) or Simple Moving Average (SMA)—from the settings panel. Once selected, the indicator plots up to four different moving average periods simultaneously, such as 20, 50, 100, and 200, using the chosen MA type.
Each moving average:
Has its own configurable period
Can be individually enabled or disabled
Can be assigned a custom color for easy visual identification
This flexibility allows traders to:
Identify short-, medium-, and long-term trends at a glance
Analyze trend alignment and strength
Spot dynamic support and resistance zones
Adapt the indicator easily for scalping, swing trading, or positional trading
Because the calculations are based purely on price data and standard MA formulas, the indicator is non-repainting, lightweight, and reliable, making it suitable for both discretionary and systematic trading.
In short, this is a versatile, all-in-one moving average indicator that eliminates the need to add multiple MA indicators separately, keeping the chart clean and focused.

THE ELVINATORTHE ELVINATOR is my trend-following momentum indicator built on the 20 EMA, 50 EMA, and 200 EMA, designed for trading **XAUUSD during the New York session (9:30–17:00 NY time), Monday through Friday**.
**How to trade it:**
* **Trend filter:** Only take **longs above the 200 EMA** and **shorts below the 200 EMA**. This keeps trades aligned with Gold’s dominant direction.
* **Long setups:** A **20 EMA cross above the 50 EMA** signals bullish momentum. Best entries come after a pullback into the 20–50 EMA zone followed by strong continuation candles.
* **Short setups:** A **20 EMA cross below the 50 EMA** signals bearish momentum. Look for pullbacks into the EMA zone and rejection before continuation lower.
* **Timing:** Focus on NY open and high-volume moves. Avoid choppy conditions and late-session exhaustion.
* **Risk & exits:** Place stops beyond recent swings or EMA structure. Targets can be prior highs/lows or scaled with trend continuation.
THE ELVINATOR is built for **structure, patience, and disciplined execution**, allowing traders to capitalize on Gold’s volatility without chasing noise.

Swing Master by Pooja📘 Swing Master by Pooja
Invite-Only | Rule-Based Swing & Trend Structure Indicator
🔍 What this indicator is
Swing Master by Pooja is a rule-based technical analysis indicator designed to help traders identify high-quality swing opportunities within an established trend structure.
This script is not a trading strategy.
It does not execute trades and does not provide fixed targets or stop-loss levels.
Instead, it functions as a decision-support tool.
Visual signals appear only on confirmed candles, and only when trend structure, momentum, and market participation align together.
The core objective of this indicator is filtering low-quality market conditions and avoiding random entries, not generating frequent signals.
🎯 Intended Trading Use
This indicator is intended for traders who:
Trade trend-based swings and pullbacks
Prefer structure-aligned entries instead of chasing price
Want multi-factor confirmation before acting
Apply their own execution and risk-management rules
Applicable on:
Indices
Stocks
Futures
Intraday & higher-timeframe swing charts
🧠 Why this is NOT a simple indicator mashup
Although Swing Master uses EMA, RSI, Volume, and multi-timeframe context, each component serves a distinct and non-overlapping role.
No indicator is used to confirm itself, and no single condition can trigger a signal independently.
Signals are generated only when all required structural and momentum conditions align together on a confirmed bar, reducing noise and hindsight bias.
🔹 EMA Structure (50 / 100 / 200)
Defines trend hierarchy and market structure
Strictly filters trades in the dominant trend direction
Identifies pullback zones, not breakout points
EMA stacking is used to determine structural bias, not direct entries.
🔹 Pullback-Tolerance Logic (Key Original Component)
Instead of requiring exact EMA touches, the script applies a tolerance-based pullback zone around EMAs.
This allows:
More realistic swing entries
Fewer missed opportunities
Reduced noise compared to rigid EMA rules
This pullback-zone evaluation is custom-designed and central to the indicator’s behavior.
🔹 RSI Momentum Filter
Ensures pullbacks occur with momentum acceptance
Filters entries during weak or exhausted moves
Helps avoid counter-trend traps
RSI is used strictly as a momentum-quality filter, not as a standalone signal.
🔹 Volume Participation Filter
Confirms that price movement has market participation
Filters signals during low-interest or weak-volume phases
Helps avoid false continuation attempts
🚦 Signal Types Explained (Rule-Specific & Non-Repeating)
Each visual signal represents a distinct market condition, not repeated logic.
▸ sb — Swing Buy
Trend-aligned pullback near EMA structure
RSI confirms momentum
Volume confirms participation
▸ FS — Future Sell
Mirror logic of Swing Buy
Appears only in established downtrends
▸ SB / SS — Strong Buy / Strong Sell Zones
Price acceptance above or below all EMAs
Indicates strong directional control
Plotted only on the first bar of zone entry (no repetition)
▸ GB / GS — Golden Buy / Golden Sell
EMA 100 / EMA 200 crossover
Represents a structural trend transition
Appears only on confirmed crossovers
Each signal type follows its own independent rule-set.
📊 Multi-Timeframe Dashboard (Context Only)
The optional dashboard provides:
Trend state across higher timeframes
Top-down market context for directional bias
The dashboard is informational only and does not generate signals.
🔔 Alerts
Alert conditions are available for all signal types.
Alerts trigger only on confirmed candles and are intended to support manual analysis, not automated trading.
🔐 Why Invite-Only & Closed-Source
Swing Master incorporates:
Stateful signal control
Multi-condition validation
Non-repeating signal logic
Custom pullback-zone evaluation
The source code is protected to preserve the internal interaction, sequencing, and state management logic, not to conceal commonly known indicators.
⚠ Disclaimer
This indicator is provided for educational and analytical purposes only.
It does not constitute financial advice and does not guarantee results.
All trading decisions, execution, and risk management remain entirely the user’s responsibility.

Advanced custom multi MA signals (EMA/SMA/VWMA/VWAP) Features of Multi Moving Averages
The biggest enemy in trading is "Noise." If you get swayed by minute fluctuations on the chart, you end up missing the forest for the trees.
This indicator (Advanced Custom Multi MA Signals) is not just a simple line. By combining the three core elements of Price, Time, and Volume, it acts as a navigation system that visualizes the market's "true trend." In particular, the ability to analyze 5 moving averages simultaneously across various timeframes is akin to viewing a 3D map of the battlefield.
Understanding Core Concepts
This indicator supports 4 types of moving averages. It is crucial to clearly understand the nature of each tool.
SMA (Simple Moving Average): The most basic average value. Since it produces fewer whipsaws (false signals), it is used as a baseline to judge the "long-term trend."
EMA (Exponential Moving Average): Places more weight on recent prices. It reacts sensitively to market changes, making it advantageous for identifying "entry points."
VWMA (Volume Weighted Moving Average): Incorporates "volume" into the price calculation. It acts as a "false signal filter," weeding out price moves that aren't backed by trading volume.
VWAP (Volume Weighted Average Price): The benchmark price used by institutional investors for daily trading. It is calculated based on the session, regardless of the period settings. It is considered the "lifeline" of day trading.
Indicator Settings Guide
Open the settings window and tune it to fit your trading style.
MA 01 ~ 05 (Moving Average Settings)
MA Type: Select according to your purpose. (Generally, EMA is recommended for short-term analysis, SMA/VWMA for long-term).
Length: Enter the period you wish to analyze (e.g., 20, 60, 120, 200).
Timeframe: This is the core feature. It allows you to overlay moving averages from a higher timeframe (e.g., 4-hour, Daily) onto the chart you are currently viewing (e.g., 15-minute).
Signal Option (Trading Signals)
Golden Cross (GC) / Death Cross (DC): Captures the moment the short-term line breaks through the long-term line. You can run up to 3 strategies simultaneously.
Ribbon Gradient (Trend Visualization)
Represents the gap between two moving averages with color. As the color deepens and the width expands, it indicates a powerful trend; if the width narrows, it suggests a high probability of a trend reversal.
5 Usage Strategies
The highlight of this indicator is the cross strategy utilizing the "Multi-Timeframe (MTF)" feature. Familiarize yourself with the 5 example strategies below and set up your own strategy based on your expertise.
💡 Tip 1. Do not go against the "Major Trend" (The Authority of the Weekly Candle)
Settings: Set MA5 to .
Interpretation: The Weekly 50 line is the "major trend line" managed by institutions and market makers. If the current price is above this line, maintain only a "Buy (Long)" bias; if below, maintain only a "Sell (Short)" bias. Adhering to this rule alone can help you avoid massive losses.
💡 Tip 2. Highly Reliable "Swing Signal" (Daily Golden Cross)
Settings: In Signal 1, configure the Short MA to and the Long MA to .
Interpretation: A Golden Cross where the 4-Hour 50 EMA breaks above the Daily 50 EMA often signifies a major "trend reversal" rather than a temporary rebound. This provides an ideal entry signal for office workers or swing traders who need high reliability.
💡 Tip 3. 4-Hour Candle as the Standard for "Precision Entry"
Situation: When the Daily trend is rising (Bullish alignment).
Strategy: While watching the 15-minute or 1-hour chart, set the indicator's Signal 2 to the cross of and .
Interpretation: When the Daily chart is in an uptrend, a Golden Cross occurring on the 4-Hour chart marks "the point where a correction (pullback) ends and the rise resumes." This is the entry point with the best risk-to-reward ratio.
💡 Tip 4. Filtering Out "Fake Signals" (The Secret of Volume)
Strategy: When creating a cross signal, try using VWMA (Volume Weighted) for the Long MA, even if you use EMA for the Short MA.
Reason: A Golden Cross caused simply by a rise in price can be a trap. However, if it breaks through the heavy VWMA line accompanied by volume, it is strong evidence that "genuine liquidity" has entered.
💡 Tip 5. Remember the "Hierarchy" (Higher Timeframe Priority Rule)
Principle: If a Golden Cross (Buy Signal) appears on the 4-Hour chart, but the Daily chart is in a Death Cross (Sell Signal) state, do not enter.
Interpretation: A signal from a lower timeframe cannot overcome the power of a higher timeframe. The professional approach is to trade with significant volume only when signals align (Sync) in the order of Weekly > Daily > 4-Hour. Keep this indicator's dashboard feature on and always check the status of higher timeframes.
Signal Generation Principle (Operating Mechanism)
Signals are generated when the set short-term moving average and long-term moving average cross each other.
📈 1. Golden Cross (BUY = Buy Signal)
Situation: The moment the short-term MA crosses upward from below the long-term MA.
Principle: It implies that recent buying pressure has broken through the resistance level accumulated over a long period.
📉 2. Death Cross (SELL = Sell Signal)
Situation: The moment the short-term MA crosses downward from above the long-term MA.
Principle: It implies that recent selling pressure has collapsed the long-term support line.
※ If the candles are not displaying correctly or are flickering, please set the indicator's 'Visual order' to 'Bring to front' as shown in the image below.
Investment Caution and Disclaimer
Before using this indicator for actual trading, please strictly read the contents below.
① Auxiliary indicators are a "Compass," not a "Book of Prophecy."
This indicator is merely a tool that mathematically calculates and visualizes past price data. A "magic indicator" that predicts future price fluctuations 100% accurately or guarantees profit does not exist. The signals provided are for reference only and must never be the sole basis for entry/exit decisions.
② The responsibility for all investments lies with "Yourself."
Financial investment (Cryptocurrencies, Stocks, Futures, etc.) involves high volatility and is a risky activity that can result in the loss of some or all of the principal. The final responsibility for all trading results (profits and losses) incurred by utilizing this indicator lies entirely with the investor. The distributor and developer accept no legal responsibility for investment results under any circumstances.
③ Past data does not guarantee the future.
Even a Golden Cross that fit perfectly in backtesting or past charts may operate differently in tomorrow's market situation (News, Macroeconomics, Unexpected Variables, etc.). Do not rely solely on technical analysis; you must conduct fundamental analysis and risk management in parallel.
④ Risk management is the top priority.
No matter how promising a signal appears, "all-in trading" (investing all assets in a single trade) is a shortcut to bankruptcy. More important than the indicator itself is adhering to the principles of strict scaling in (split buying) and Stop-Loss.

SIDD EMA RSI Supertrend Signal Table🔥 SIDD EMA RSI SuperTrend Multi-Timeframe Signal Table
**SIDD EMA RSI SuperTrend Signal Table** is a **clean, powerful multi-timeframe trend confirmation dashboard** designed for traders who want **clarity, confluence, and speed** — all in one glance.
This indicator **does NOT repaint** and uses **industry-standard trend logic** combining **EMA structure, RSI momentum, and SuperTrend direction** across **6 different timeframes**.
---
## 🧠 Core Logic Behind the Indicator
This script works on **three independent trend engines**, displayed together in a compact table:
### ✅ 1️⃣ EMA Trend (Structure Based)
* Uses **EMA 50 vs EMA 200**
* **Bullish** → EMA 50 above EMA 200
* **Bearish** → EMA 50 below EMA 200
* Captures **primary market structure**
### ✅ 2️⃣ RSI Trend (Momentum Based)
* RSI Length: **14**
* **Bullish** → RSI > **55**
* **Bearish** → RSI ≤ **55**
* Helps confirm **trend strength & momentum**
### ✅ 3️⃣ SuperTrend (Price Action Based)
* ATR Length: **10**
* Factor: **3.0**
* Clearly defines **trend direction & trailing bias**
* Excellent for **entry & exit alignment**
---
## ⏱️ Multi-Timeframe Coverage
The table analyzes trends across **6 configurable timeframes**:
* Intraday → **5m, 15m, 1H**
* Swing → **4H, Daily**
* Positional → **Weekly**
Each timeframe shows:
* 📈 EMA Trend
* 📊 RSI Trend
* 🔁 SuperTrend Direction
Color-coded for instant readability:
* 🟢 Bullish
* 🔴 Bearish
* ⚪ Neutral
---
## 🎯 How to Use This Indicator
✔ **Trend Trading**
Trade only when **EMA + RSI + SuperTrend align** across higher & lower timeframes.
✔ **Intraday Confirmation**
Use higher TF (1H / 4H) bias and take entries on lower TF.
✔ **Avoid Chop & False Signals**
If signals are mixed → market is likely **sideways or risky**.
✔ **Swing & Positional Trades**
Daily + Weekly alignment gives **high-probability setups**.
---
## ⚙️ Customization Options
* Adjustable **timeframes**
* Table **position** (Top/Bottom – Left/Right)
* Table **size** (Extra Small / Small / Normal)
* Custom **colors, borders & text**
* Optimized for **minimal chart clutter**
---
## ⚠️ Disclaimer
This indicator is a **trend confirmation & decision-support tool**.
Always combine with **price action, support/resistance, and proper risk management**.

Smart MA Zone Crossover [HMA-EMA]Smart MA Zone Crossover is a trend-following indicator designed to capture early momentum shifts using the crossover between Hull Moving Average (HMA) and Exponential Moving Average (EMA).
The indicator visually highlights trend direction using a dynamic colored zone, making it easy to identify bullish and bearish market phases at a glance.
🔸 Step 1: Moving Average Calculation
HMA (Hull Moving Average) → Faster, smoother, reacts quickly to price
EMA (Exponential Moving Average) → Stable trend reference
Both MA lengths are **fully adjustable** from the settings panel.
🔸 Step 2: Trend Detection
Bullish Trend: HMA is above EMA
Bearish Trend: HMA is below EMA
The area between the two averages is filled with color to visually represent the current trend state.
Step 3: Signal Generation (Non-Repainting)
Signals are generated **only on confirmed crossovers**:
✅ BUY Signal- HMA crosses above EMA
❌ SELL Signal-HMA crosses belowEMA
Signals do **not repaint** and appear only once per crossover.
🔸 Step 4: Visual Customization
Users can enable or disable:
* Moving average lines
* Colored MA zone fill
* Buy/Sell arrows
* Buy/Sell text labels
This allows the indicator to remain **minimal or detailed**, depending on user preference.
🔹 Key Features
✔ Non-repainting logic
✔ Clean crossover-based signals
✔ Customizable HMA & EMA lengths
✔ Optional MA zone fill
✔ Buy/Sell arrows & labels
✔ Works on all timeframes
✔ Beginner-friendly & scalper-ready
🔹 Best Use Cases
* Trend confirmation
* Momentum trading
* Scalping & intraday trading
* Swing trend filtering
For best results, combine with:
* Support & resistance
* Volume
* Higher-timeframe trend
🔹 Disclaimer
This indicator is provided for **educational purposes only**.
It is **not financial advice**. Always backtest and use proper risk management before trading live markets.

Hybrid Strategy: Trend/ORB/MTFHybrid Strategy: Trend + ORB + Multi-Timeframe Matrix
This script is a comprehensive "Trading Manager" designed to filter out noise and identify high-probability breakout setups. It combines three powerful concepts into a single, clean chart interface: Trend Alignment, Opening Range Breakout (ORB), and Multi-Timeframe (MTF) Analysis.
It is designed to prevent "analysis paralysis" by providing a unified Dashboard that confirms if the trend is aligned across 5 different timeframes before you take a trade.
How it Works
The strategy relies on the "Golden Trio" of confluence:
1. Trend Definition (The Setup) Before looking for entries, the script analyzes the immediate trend. A bullish trend is defined as:
Price is above the Session VWAP.
The fast EMA (9) is above the slow EMA (21). (The inverse applies for bearish trends).
2. The Signal (The Trigger) The script draws the Opening Range (default: first 15 minutes of the session).
Buy Signal: Price breaks above the Opening Range High while the Trend is Bullish.
Sell Signal: Price breaks below the Opening Range Low while the Trend is Bearish.
3. The Confirmation (The Filter) A signal is only valid if the Higher Timeframe (default: 60m) agrees with the direction. If the 1m chart says "Buy" but the 60m chart is bearish, the signal is filtered out to prevent false breakouts.
Key Features
The Matrix Dashboard A zero-lag, real-time table in the corner of your screen that monitors 5 user-defined timeframes (e.g., 5m, 15m, 30m, 60m, 4H).
Trend: Checks if Price > EMA 21.
VWAP: Checks if Price > VWAP.
ORB: Checks if Price is currently above/below the Opening Range of that session.
D H/L: Warns if price is near the Daily High or Low.
PD H/L: Warns if price is near the Previous Daily High or Low.
Visual Order Blocks The script automatically identifies valid Order Blocks (sequences of consecutive candles followed by a strong explosive move).
Chart: Draws Green/Red zones extending to the right, showing where price may react.
Dashboard: Displays the exact High, Low, and Average price of the most recent Order Blocks for precision planning.
Risk Management (Trailing Stop) Once a trade is active, the script plots Chandelier Exit dots (ATR-based trailing stop) to help you manage the trade and lock in profits during trend runs.
Visual Guide (Chart Legend)
⬜ Gray Box: Represents the Opening Range (first 15 minutes). This is your "No Trade Zone." Wait for price to break out of this box.
🟢 Green Line: The Opening Range High. A break above this line signals potential Bullish momentum.
🔴 Red Line: The Opening Range Low. A break below this line signals potential Bearish momentum.
🟢 Green / 🔴 Red Zones (Boxes): These are Order Blocks.
🟢 Green Zone: A Bullish Order Block (Demand). Expect price to potentially bounce up from here.
🔴 Red Zone: A Bearish Order Block (Supply). Expect price to potentially reject down from here.
⚪ Dots (Trailing Stop):
🟢 Green Dots: These appear below price during a Bullish trend. They represent your suggested Stop Loss.
🔴 Red Dots: These appear above price during a Bearish trend.
🏷️ Buy / Sell Labels:
BUY: Triggers when Price breaks the Green Line + Trend is Bullish + HTF is Bullish.
SELL: Triggers when Price breaks the Red Line + Trend is Bearish + HTF is Bearish.
Settings
Session: Customizable RTH (Regular Trading Hours) to filter out pre-market noise.
Matrix Timeframes: 5 fixed slots to choose which timeframes you want to monitor.
Order Blocks: Adjust the sensitivity and lookback period for Order Block detection.
Risk: Customize the ATR multiplier for the trailing stop.
Disclaimer
This tool is for educational purposes only. Past performance does not guarantee future results. Always manage your risk properly.

3 EMA with Alerts 2025This indicator plots three key EMAs (20, 50, and 200) directly on the chart, making it easy to track short-, medium-, and long-term trends. A color-coded table is displayed in the top-right corner for quick reference.
The script also includes smart alerts that trigger only when the state changes:
• 🔵 EMA 20 crossing above EMA 50 & EMA 200 → Bullish signal
• 🔴 EMA 20 crossing below EMA 50 & EMA 200 → Bearish signal
This tool is designed for traders who want clean visuals, reliable alerts, and simplified trend recognition in 2025 markets.

EMA/Volume/Institutional Candle (Deep)This indicator is designed for short-term swing trading and intraday trend identification using a combination of EMA structure, momentum shifts, volume confirmation, and institutional footprint analysis.
🔹 Key Features
1. EMA Trend Framework (9, 20, 50, 200)
✔ EMA 9 & EMA 20: Ultra-short-term momentum; ideal for fast trend shifts.
✔ EMA 50: Medium-term trend guide; helps identify pullbacks vs. reversals.
✔ EMA 200: Long-term trend bias and major dynamic support/resistance.
2. EMA 9/20 Crossover Signal
✔ Bullish Crossover → EMA 9 crossing above EMA 20 indicates momentum expansion and early trend reversal.
✔ Bearish Crossover → EMA 9 crossing below EMA 20 shows momentum weakening and possible short-side opportunity.
3. High-Volume Zone Detection
✔ Highlights candles with volume spikes above average, signaling institutional interest.
✔ Useful for identifying breakout validity, liquidity grabs, or trap candles.
4. Institutional Candles (Smart Money Footprint)
✔ Automatically marks institutional order blocks, imbalance zones, or large displacement candles.
✔ Helps traders identify where smart money entered the market and potential mitigation zones.
🎯 How This Indicator Helps You Trade
✔ Quickly spot trend direction with multi-EMA alignment
✔ Identify high-probability entries with EMA 9/20 crossover + volume confirmation
✔ Find institutional zones for sniper-style entries
✔ Filter fake breakouts using volume spikes
✔ Perfect for stocks, indices, crypto, and forex


EMA/SMA Crossover Signals📊 EMA/SMA Crossover Signals
A professional trading indicator that identifies golden and death crosses between a customizable EMA and SMA with clear BUY/SELL labels displayed directly on your chart.
🎯 Key Features:
✅ Customizable Moving Averages - Adjust both EMA and SMA periods to match your trading strategy
✅ Clear Signal Labels - Large, color-coded "BUY" and "SELL" labels that are impossible to miss
✅ Adjustable Label Positioning - Control the vertical distance of signal labels from price action
✅ Professional Color Customization - Change colors for both moving averages and signals to match your theme
✅ Label Size Options - Choose from 4 different sizes (Tiny, Small, Normal, Large)
✅ Audio Alerts - Get notified instantly when crossovers occur
✅ Overlay Display - Signals appear directly on your price chart for better context
📈 How It Works:
🟢 BUY Signal: Triggered when the EMA crosses above the SMA (bullish crossover)
🔴 SELL Signal: Triggered when the EMA crosses below the SMA (bearish crossover)
⚙️ Customizable Settings:
Moving Averages:
- EMA Period (Default: 8)
- SMA Period (Default: 200)
Colors:
- EMA Color
- SMA Color
- Buy Signal Color
- Sell Signal Color
Signal Settings:
- Signal Vertical Offset
- Label Vertical Offset
- Label Size
💡 Best For:
- Day Trading (1-5 min timeframes)
- Swing Trading (4H-Daily)
- Trend Following Strategies
- Identifying momentum shifts
- Confirming market structure changes
🔔 Perfect for traders using ICT, Wyckoff, and institutional trading methodologies
Use this indicator as part of your complete trading system. Always combine with proper risk management and additional confluence factors.

BT MA BandsThe BT MA Bands indicator is built around a central moving average (MA) with upper and lower bands derived from it, similar to Bollinger Bands but focused on exponential moving averages (EMAs) for smoother responsiveness.
The core idea is to visualize trend strength, volatility squeezes, and potential reversal points through dynamic bands that expand/contract based on price deviation. It includes trend-based color fills, entry/exit signals, an optional ATR (Average True Range) overlay for additional volatility bands, and flexible MA source options to adapt to different market conditions.
Inputs
MA Type and Length: Choose from EMA (default), SMA, WMA, or HMA. Default length is 20 periods, but adjustable (e.g., 10-50) for short-term scalping or longer swings.
Deviation Multiplier: Sets the band width as a multiple of the standard deviation from the MA (default: 2.0). Higher values create wider bands for trending markets; lower for ranging ones.
Source Data: Select price source for the MA calculation—close (default), open, high, low, (high+low)/2, or weighted (hlc3/hlcc4) to emphasize different aspects of price action.
ATR Toggle and Multiplier: Optional ATR-based outer bands (default off). When enabled, multiplier (default: 1.5) adds volatility sensitivity, helping filter noise in choppy conditions.
Signal Sensitivity: Threshold for generating buy/sell alerts (e.g., 0-100 scale; default 50) based on band crossovers or squeezes.
Style Options: Enable/disable fills, signals, and colors for personalization.
Visual Elements
Central MA Line: A solid line (e.g., blue by default) representing the chosen moving average, acting as the baseline.
Upper and Lower Bands: Dotted or dashed lines (green/red defaults) that flank the MA, widening during volatility and narrowing in consolidations.
Color-Changing Fills: The area between bands fills with color shifts—bullish (green) when price is above the MA and bands are expanding, bearish (red) when below and contracting, or neutral (gray) during flat trends.
Entry Signals: Arrow plots (up green for bullish, down red for bearish) appear on the chart when price crosses the bands or a squeeze resolves, with optional text labels like "Buy" or "Sell."
ATR Overlay (if enabled): Additional dashed outer bands in a lighter color (e.g., purple) to highlight extreme volatility zones.
How to Use It in Trading
Trend Identification: Use the central MA and band fills to gauge direction—price above the MA with green fills signals an uptrend (favor longs); below with red indicates downtrends (favor shorts). Narrow bands suggest a "squeeze" setup, often preceding big moves.
Entry Points:
Bullish Entries: Enter long when price breaks above the upper band on a bullish signal arrow, especially after a squeeze. Confirm with volume spike or RSI >50 on timeframes like 5m-1h for quick trades.
Bearish Entries: Enter short on a break below the lower band with a bearish arrow, post-squeeze. Ideal on 4h+ frames for swings, paired with MACD crossovers.
Exits and Risk Management: Exit longs when price hits the lower band or a bearish signal fires; vice versa for shorts. Set stops just beyond the opposite band (e.g., below lower for longs). Target 1.5-3x risk-reward, using ATR bands for trailing stops in volatile markets.
General Tips: Best in trending environments; avoid during news events causing false breakouts. Backtest parameters on historical data, and combine with other indicators like RSI or volume for confluence. It's great for spotting reversals but not infallible—always apply position sizing and monitor for band "walks" (price hugging one band) as continuation signals.

BT LigmaThe BT Ligma indicator combines momentum-based signals with volatility filters to identify potential trend reversals and high-probability entry points.
It uses a set of Exponential Moving Averages (EMAs) – typically a fast EMA (e.g., 9-period) crossing over a slower one (e.g., 21-period) – to generate baseline buy/sell signals. These are enhanced by a proprietary "Ligma Spread" filter, which measures the dynamic spread between short-term price action and a volatility envelope (similar to Bollinger Bands but customized with ATR multipliers). This filter helps weed out false signals in choppy markets by requiring a minimum spread threshold before confirming a trade alert.
BT Ligma allows a user to select up to 3 EMAs, the MA calculation method, and signal individual candles that cross EMA 1 & 2, or all 3 bands in the same bar.
Version 1.4, includes refined alert logic, including audio/visual notifications and optional trailing stops based on EMA alignments.
To use it effectively for trade entries:
Long (Buy) Entries: Look for a bullish EMA crossover (fast EMA above slow) combined with a positive Ligma Spread expansion (indicating increasing momentum). Enter when the signal fires on a close above the recent swing high, ideally on a timeframe like 15m or 1h for scalping/day trading. Pair this with volume confirmation or RSI above 50 to avoid overbought traps.
Short (Sell) Entries: Wait for a bearish EMA crossover (fast below slow) with a contracting or negative Ligma Spread (signaling potential downside volatility). Enter on a close below the recent swing low, using higher timeframes (e.g., 4h) for swing trades to capture larger moves.
General Tips: Always apply risk management – set stops below/above the slow EMA, target 2-3x risk-reward ratios, and avoid trading during low-liquidity periods. Backtest on historical data to tweak parameters, and combine with fundamentals like news events for better context.
Vantage-X (2.0)Vantage-X (2.0) — The Clean-Chart Trading Dashboard
Vantage-X (2.0) is a next-generation, all-in-one chart optimization dashboard designed for traders who want clarity, precision, and zero clutter. Whether you scalp, day trade, or swing trade, this indicator removes the noise and gives you the exact market signals that matter, all from one clean, minimal interface.
Built for traders who are tired of overcrowded charts filled with lines, clouds, bands, and unnecessary indicators, Vantage-X (2.0) brings everything together into a powerful visual dashboard — so you can focus on price action, not distraction.
⸻
🔹 What’s New in Version 2.0
Vantage-X (2.0) adds several high-value trend-tracking systems to improve timing, confirmation, and momentum detection:
• EMA 50 / EMA 200 Cross
A classic long-term momentum and directional bias filter.
Perfect for identifying macro trend shifts or avoiding trades against the dominant trend.
• EMA 20 / EMA 50 Cross
A medium-term trend confirmation system used by professional intraday traders to time pullbacks, continuations, and structure-based setups.
• EMA 5 / EMA 13 Cross
A fast-reaction signal for sudden bursts of volatility.
Ideal for scalpers catching early momentum, breakouts, retests, and reversal flips.
All three systems come with full toggles, so you can enable or disable any layer depending on your style.
All three EMA Crosses work on the current timeframe you are looking at.
⸻
🔹 Core Purpose
The purpose of Vantage-X is simple:
Give traders a clean, powerful dashboard that replaces multiple indicators — without ever touching the price chart.
No more overlapping lines.
No more stacked indicators taking up screen space.
No more analysis paralysis.
Just fast, easy, intuitive signals displayed in a compact table so you can instantly read the market’s story.
⸻
🔹 Features
✔ Ultra-clean dashboard layout (does not clutter your chart)
✔ Trend direction & EMA cross signals
✔ Color-coded bias detection (bullish, bearish, neutral)
✔ Adjustable toggle system for full customization
✔ Works on all markets & timeframes
✔ Designed for scalpers, day traders, and swing traders
✔ Perfect for traders who rely on price action but still want smart confirmation
⸻
🔹 Why Traders Love It
Vantage-X is built for the modern trader — the type who values simplicity, clarity, and speed. Every feature in this dashboard is made to:
• Reduce hesitation
• Improve timing
• Simplify decision-making
• Keep charts visually clean
• Remove emotional noise
• Increase confidence in entries and exits
If you want a chart that stays clean but still gives high-precision market signals, Vantage-X is built for you.
⸻
🔹 Free to Use — For the Trading Community
Vantage-X (2.0) is completely free.
No paywalls. No locked features.
This release is my contribution to traders who want a cleaner, more efficient way to interpret the market without relying on a dozen indicators layered on top of each other.
⸻
🔹 Final Notes
Vantage-X (2.0) is continuously evolving, and future versions will bring even more flexibility, signal refinement, and dashboard intelligence. Feedback is always welcomed — I want this to be one of the most useful and clean charting tools available on TradingView.
🔥 {COMING SOON: You will be able to set different timeframes for each EMA cross Signal. So if you are looking at 5min timeframe but you want to know 15min 20/50 EMA cross. You will be able to adjust that in settings. SO NO SWITCHING BACK AND FORTH BETWEEN DIFFERENT TIMEFRAME CHARTS!!} 🔥

paigep.llc - SuperMASuperMA is a multi-layered moving-average and candle-coloring system that combines SMA, EMA, and optional HMA logic to help traders visualize trend shifts, pullbacks, and momentum changes in a clean, structured way.
The script includes multiple modules: trend-based moving averages, pullback signals, exit logic, and an optional HMA cross engine.
📌 Core Features
1. Full SMA + EMA Framework
The indicator plots multiple moving averages (8, 9, 13, 20, 50, 200) using both SMA and EMA calculations. Each line automatically colors bullish or bearish based on its relationship to the 200-period baseline.Users can toggle SMAs and EMAs independently for clearer chart control.
2. Main Trend Entry & Exit Logic (8×200 and 8×20)
Built-in crossover logic detects:
Main Entry: SMA 8 crossing above/below EMA 200
Main Exit: SMA 8 and SMA 20 cross (with an option to choose which SMA is treated as the “fast” leg)
A “first exit only” option allows the script to ignore additional exit signals until a new trend regime begins.
3. Pullback Module (20 SMA Interaction)
Pullback entries and exits occur when price crosses the 20 SMA during existing trend conditions.
This includes:
Pullback entries through the 20 SMA
Pullback exits back across the 20 SMA
Labels and candle colors are available for all pullback events.
4. Optional HMA Cross Module
A separate module allows traders to use two Hull Moving Averages (HMA) with customizable:
Lengths
Independent timeframes
Line colors
Cross-based entries and exits
This module has its own events, labels, and optional candle coloring.
5. Advanced Candle Coloring System
Candle coloring is layered in priority order, based on:
Main trend entries
Main exits
HMA entries
HMA exits
Pullback entries
Pullback exits
Trend-only candles (based on SMA 8 relative to EMA 200)
Users may also independently color wicks and borders.
6. Configurable Alerts (Fully Decoupled from Visuals)
Alerts are available for all major events, including:
Main Entries (8×200)
Main Exits (8×20)
Pullback Entries and Exits
HMA Entries and Exits
Bull or Bear Trend candles
Any colored candle event
Alerts can fire on bar close only or intrabar, depending on user preference.
📌 Use Cases
SuperMA helps traders visualize:
Trend direction using SMA/EMA structure
Momentum shifts through HMA crosses
Pullback zones around the 20 SMA
Early regime transitions based on the 8×200 relationship
Candle-level context through color-coded bars
The indicator works across all markets and timeframes.
⚠️ Note
This tool is for visual and analytical assistance only. It does not guarantee future performance and should be combined with additional analysis and risk management.

paigep.llc - SuperMA
SuperMA is a multi-layered moving-average and candle-coloring system that combines SMA, EMA, and optional HMA logic to help traders visualize trend shifts, pullbacks, and momentum changes in a clean, structured way.
The script includes multiple modules: trend-based moving averages, pullback signals, exit logic, and an optional HMA cross engine.
📌 Core Features
1. Full SMA + EMA Framework
The indicator plots multiple moving averages (8, 9, 13, 20, 50, 200) using both SMA and EMA calculations. Each line automatically colors bullish or bearish based on its relationship to the 200-period baseline. Users can toggle SMAs and EMAs independently for clearer chart control.
2. Main Trend Entry & Exit Logic (8×200 and 8×20)
Built-in crossover logic detects:
Main Entry: SMA 8 crossing above/below EMA 200
Main Exit: SMA 8 and SMA 20 cross (with an option to choose which SMA is treated as the “fast” leg)
A “first exit only” option allows the script to ignore additional exit signals until a new trend regime begins.
3. Pullback Module (20 SMA Interaction)
Pullback entries and exits occur when price crosses the 20 SMA during existing trend conditions.
This includes:
Pullback entries through the 20 SMA
Pullback exits back across the 20 SMA
Labels and candle colors are available for all pullback events.
4. Optional HMA Cross Module
A separate module allows traders to use two Hull Moving Averages (HMA) with customizable:
Lengths
Independent timeframes
Line colors
Cross-based entries and exits
This module has its own events, labels, and optional candle coloring.
5. Advanced Candle Coloring System
Candle coloring is layered in priority order, based on:
Main trend entries
Main exits
HMA entries
HMA exits
Pullback entries
Pullback exits
Trend-only candles (based on SMA 8 relative to EMA 200)
Users may also independently color wicks and borders.
6. Configurable Alerts (Fully Decoupled from Visuals)
Alerts are available for all major events, including:
Main Entries (8×200)
Main Exits (8×20)
Pullback Entries and Exits
HMA Entries and Exits
Bull or Bear Trend candles
Any colored candle event
Alerts can fire on bar close only or intrabar, depending on user preference.
Use Cases
SuperMA helps traders visualize:
Trend direction using SMA/EMA structure
Momentum shifts through HMA crosses
Pullback zones around the 20 SMA
Early regime transitions based on the 8×200 relationship
Candle-level context through color-coded bars
The indicator works across all markets and timeframes.
⚠️ Note
This tool is for visual and analytical assistance only. It does not guarantee future performance and should be combined with additional analysis and risk management.

9/15 EMA Scalper 9/15 EMA Scalper — by uzairbaloch
This script is a price-action based scalping system built around the 9 EMA and 15 EMA trend structure.
It identifies short-term reversal points where the market pulls back into the EMAs and confirms direction with a strong candle signal.
The strategy looks for:
• A clear EMA trend (9 above 15 for buys, 9 below 15 for sells)
• Pullback into EMA9/EMA15 with candle bodies touching the fast EMA
• Strong confirmation candle (engulfing / strong momentum / controlled wick)
• Optional slope filter to avoid flat, choppy sessions
• Automatic trade labels showing Entry, SL and TP (based on R:R)
The script is designed for scalping on gold, indices, and high-volatility FX pairs.
It resets trade logic immediately after SL or TP is hit, so it can catch the next valid signal without delay.
This tool is meant as an indicator — not a full strategy — and can be used to visually mark high-probability EMA pullback setups with precise levels.
Author: uzairbaloch

EMA Cross Strategy v5 (30 lots) (15 min candle only)- safe flip🚀 EMA Cross Strategy v5 (30 Lots) (15 min candle only)— Safe Flip Edition
Fully Automated | Fast | Reliable | Battle-tested
Welcome to a clean, powerful, and automation-friendly EMA crossover system.
This strategy is built for traders who want consistent trend-based entries without the risk of unwanted pyramiding or doubled positions.
🔥 How It Works
This strategy uses a fast EMA (10) crossing a slow EMA (20) to detect trend shifts:
Bullish Crossover → LONG (30 lots)
Bearish Crossover → SHORT (30 lots)
Every opposite signal safely flips the position by first closing the current trade, then opening a fresh position of exactly 30 lots.
No doubling.
No runaway position size.
No surprises.
Just clean, mechanical trend-following.
📈 Why This Strategy Stands Out
Unlike basic EMA crossbots, this version:
✔ Prevents unintended pyramiding
✔ Never over-allocates capital
✔ Works perfectly with webhook-based automation
✔ Produces stable, systematic entries
✔ Executes directional flips with precision
🔍 Backtest Highlights (1-Year)
(Backtests will vary by instrument/timeframe)
1,500+ trades executed
Profit factor above 1.27
Strong trend performance
Balanced long/short behavior
No margin calls
Consistent trade execution
This strategy thrives in trending markets and maintains strict discipline even in choppy conditions.
⚙️ Automation Ready
Designed for automated execution via webhook and API setups on supported platforms.
Just connect, run, and let the bot follow the rules without hesitation.
No emotions.
No overtrading.
No fear or greed.
Pure logic.

TrenVantage TRADER - Market Structure Intelligence 📘 TrenVantage TRADER – Market Structure Intelligence
Hello Traders!
We are excited to introduce TrenVantage TRADER! This indicator is a professional-grade market structure tool designed for active traders and analysts who require deeper insight and more precise control. It combines advanced pivot-based level detection, a dynamic ZigZag engine, multi-timeframe trend awareness, and Fibonacci integration into a clear and actionable visual layout. The TRADER edition offers enhanced logic that highlights multiple key levels (up to 8) with strength ratings, making it ideal for traders who need full market context without oversimplification. Whether you are day-trading, swing-trading, or managing multiple assets, TrenVantage TRADER empowers you to understand price structure, identify confluence zones, and monitor directional bias in real time.
✨ Key Features
🔹 Smart Support & Resistance (Max 8 Levels – TRADER Version)
- Auto-detected levels using precision candle-body logic
- Prioritizes the strongest zones with strength ratings
- Includes tested vs. untested levels for professional analysis
- Ideal for reaction-based trading and advanced setups
🔹 Advanced Pivot Engine
- Timeframe-aware, body-focused pivot detection
- Dynamic lookback for professional-level accuracy
- Filters weak pivots to reduce chart clutter
🔹 Dynamic Trend Detection (ZigZag Core)
- Real-time uptrend / downtrend state with swing-based mapping
- Adjustable deviation and sensitivity for professional precision
- Tracks higher highs, higher lows, lower highs, lower lows
🔹 Multi-Timeframe Trend Integration
- Detects trends across multiple higher timeframes
- Displays trend confluence scores for actionable insight
- Helps identify alignment with larger market bias
🔹 Status Box Dashboard
- Displays current trend, price, price change, and SMA & EMA trend position
- Nearest S/R with distance and strength information
- Multi-timeframe trend direction and confluence
- Market position summary (above, below, or between levels)
- Active S/R count and proximity detection status
🔹Dual SMA & EMA Overlay
- Fully adjustable period and visual style
- Acts as a directional filter and confluence tool
- Integrated into status box for instant comparison
- Crossover signals printed
🔹 Proximity & Trend Alerts
- Alerts when price approaches key S/R within defined distance
- Alerts on trend changes (Uptrend / Downtrend)
- Level break alerts for advanced breakout and reversal strategies
- Once-per-bar logic to avoid excessive notifications
🔹 Fibonacci Levels Overlay
- Auto-detects recent swing high/low for retracements and extensions
- Retracements: 23.6%, 38.2%, 50%, 61.8%
- Extensions: 127.2%, 161.8%
- Labels percentage levels directly on chart
- Works alongside S/R for confluence-based analysis
🔍 In-Depth Feature Breakdown
1. Smart Support & Resistance Levels
TrenVantage TRADER uses a refined pivot-based engine combined with candle-body logic to detect the strongest support and resistance zones. Unlike simpler tools, it can maintain up to 8 key levels with visual strength ratings.
How It Works
- Prioritizes zones with multiple touches and tested/untested status
- Tracks both current timeframe and higher timeframe context
- Highlights levels with color-coded clarity:
- Green = Support
- Red = Resistance
How It Helps Traders
- Provides comprehensive market structure overview
- Helps identify strong confluence zones for trading setups
- Reduces guesswork and supports data-driven decisions
2. Advanced Pivot Engine
Professional-grade pivot detection ensures only significant pivots are plotted, improving the reliability of support/resistance levels.
How It Works
- Dynamically adapts lookback periods based on volatility
- Focuses on candle bodies for more robust zone detection
- Filters out weak or irrelevant pivots
How It Helps Traders
- Clean, reliable chart with actionable levels
- Supports both breakout and reaction strategies
- Works across scalping, day, and swing-trading approaches
3. Dynamic Trend Detection (ZigZag Core)
Tracks real structural swings for professional trend analysis, avoiding guesswork or noise.
How It Works
- Detects higher highs/lows and lower highs/lows
- Adjustable deviation filtering for precision
- Smoothly updates trend direction without excessive repainting
How It Helps Traders
- Quickly identifies trend shifts and continuation setups
- Aligns positions with market structure for higher probability trades
- Reduces false signals by focusing on meaningful swings
4. Multi-Timeframe Trend Integration
Professional traders need to see trend alignment across multiple timeframes.
How It Works
- Detects trend direction on 2–3 higher timeframes
- Displays MTF confluence in status box
- Provides a clear bias score for informed decision-making
How It Helps Traders
- Confirms entries and exits with higher timeframe alignment
- Improves risk management with multi-level awareness
- Supports advanced strategy building
5 . Status Box Dashboard
A compact information hub displaying essential market data in real time.
What It Shows
- Trend direction & momentum bias
- SMA position & influence
- Nearest support & resistance levels
- Distance and strength of each level
- Multi-timeframe trend confluence
- Market position summary
- Active S/R count and proximity alerts
How It Helps Traders
- Reduces need to constantly scan the chart
- Improves situational awareness and trade timing
- Supports multi-asset monitoring with clarity
6. Dual SMA & EMA Overlay
Adds professional-grade trend filters with both SMA and EMA, giving traders more clarity and confluence without chart clutter.
How It Works
- Plots two adjustable moving averages: one SMA and one EMA
- SMA serves as a directional trend filter, EMA highlights momentum shifts
- Both moving averages can be integrated into the status box for instant comparison
- Optional cross signals indicate potential trend reversals or acceleration
How It Helps Traders
- Confirms trend alignment across both smooth (SMA) and reactive (EMA) perspectives
- Detects momentum shifts early to support entries, exits, and trade management
- Adds confluence when combined with support/resistance levels and multi-timeframe trends
- Provides a clear visual guide for swing, day, and position trading
7. Proximity & Trend Alerts
Professional-grade alerts ensure traders never miss actionable events.
How It Works
- Alerts when price approaches key levels within set distance
- Alerts on trend change or level break
- Configured once-per-bar for clarity
How It Helps Traders
- Supports breakout, reaction, and reversal strategies
- Reduces chart monitoring time
- Ensures key market shifts are noticed immediately
8. Fibonacci Levels Overlay
TrenVantage TRADER integrates dynamic Fibonacci retracements and extensions directly into your chart, giving you an advanced tool to anticipate potential reversal, continuation, and breakout zones.
How It Works
- Automatically detects the most recent significant swing high and swing low
- Draws retracement levels: 23.6%, 38.2%, 50%, 61.8%
- Draws extension levels: 127.2%, 161.8%
- Retracements follow the direction of the last swing; extensions project potential breakout targets
- Optional labels show the percentage level directly on the chart for clarity
- Fully adjustable opacity and visibility settings for clean visual representation
How It Helps Traders
- Highlights areas where price is likely to react or stall
- Supports both trend-following and counter-trend strategies
- Works in conjunction with support/resistance levels for confluence-based decision-making
- Adds an objective, mathematically-based reference for target setting and trade management
🚀 Getting Started (Quick Guide)
🔹Add the Indicator to Your Chart
- Works instantly on any timeframe or market
🔹Adjust the Settings
- Configure S/R levels, SMA, MTF trend, and alerts
🔹Watch Key Levels
- Red = Key Resistance Levels, Green = Key Support Levels
🔹Level Types
- By default, Tested Levels = Dotted, Untested Levels = Solid
🔹Monitor Status Box
- Check trend, SMA position, nearest levels, and market context
🔹Set Alerts
- Enable proximity, trend change, and level break notifications
📈 Best Practices for TrenVantage TRADER
🔹 Trend Confirmation:
- Combine ZigZag trend state, SMA, and MTF trend alignment.
🔹 Level Reactions:
- Observe price at the nearest support/resistance zones; proximity alerts help anticipate reactions.
🔹 Market Positioning:
-Use status box to quickly assess whether price is above, below, or between levels.
🔹 Confluence Building:
- Combine multiple levels, SMA, and MTF alignment for higher probability setups.
🔹 Professional Clarity:
- Up to 8 key levels are shown with strength ratings, balancing insight and chart readability.
📌 Disclaimer
This indicator is a technical analysis tool provided for informational and educational purposes only. It does not constitute financial advice, trading advice, or investment recommendations. All trading involves risk, and past performance does not guarantee future results. Always perform your own analysis and use proper risk management. You are solely responsible for any decisions made based on this tool.
If you'd like access or have any questions, feel free to reach out to me directly via DM.

Multi EMA + Golden Trio Crossover (Bullish & Bearish) by SKL📌 Multi EMA + Golden Trio Crossover (Bullish & Bearish) — by SKL
This indicator plots six key Exponential Moving Averages (EMA 5, 13, 26, 50, 100, 200) and highlights powerful momentum shift signals through the Golden Trio Crossover — a unique setup where EMA 5 crosses both EMA 13 and EMA 26 in the same candle .
It works for both bullish and bearish conditions, making it suitable for intraday, swing, and positional trading.
🔍 What is the Golden Trio Crossover?
A Golden Trio Crossover occurs when:
Bullish: EMA 5 crosses ** above ** EMA 13 *and* EMA 26 in the same candle
Bearish: EMA 5 crosses ** below ** EMA 13 *and* EMA 26 in the same candle
This triple-confirmation crossover often signals:
Early trend reversals
Strong continuation breakouts
Momentum shift points
📈 What This Indicator Includes
1. Six EMA Lines
EMA 5 – Blue
EMA 13 – Green
EMA 26 – Orange
EMA 50 – Black
EMA 100 – Gray
EMA 200 – Red
These EMAs help traders track trend direction, strength, and structure.
🌟 Visual Highlights
Green background → Bullish Golden Trio
Red background → Bearish Golden Trio
Label markers on each signal
“BULL GCO”
“BEAR GCO”
🔔 Alerts Included
You can enable alerts for:
Bullish Golden Trio Crossover
Bearish Golden Trio Crossover
Useful for breakout traders, scalpers, and swing traders.
🎯 How Traders Use This Indicator
Identify early trend shifts
Spot high-probability breakout candles
Confirm entries with multi-EMA confluence
Combine with volume, price action, or RSI for even stronger setups
📌 Notes
Works on all timeframes
Works on all asset classes (Stocks, Indices, Crypto, Forex, Commodities)
Fully automatic signal detection

EMA 20/50/100/200 Trader IkkaEMA 20/50/100/200 📊 + Crossover Alerts 🔔 Trader Ikka
This indicator plots four key Exponential Moving Averages (EMA 20, 50, 100, and 200) to help identify trends.
It also detects and marks bullish 🟢 and bearish 🔴 crossovers between the EMA 20 and EMA 50, signaling potential trend reversals or continuations.
✨ Features:
📊 Plots EMA 20, 50, 100, and 200 with color-coded lines
🟢🔴 Highlights bullish and bearish crossovers between EMA 20 & EMA 50
🔔 Built-in alert conditions for automated notifications
⚡ Useful for identifying momentum shifts and entry/exit zones