Time Specific Standard Deviation Zones(10 am - 4hr candle)This indicator is designed for intraday traders who want to visualize volatility-based zones around the 10:00 AM New York session open, plotted precisely from 10:00 AM to 2:00 PM EST.
✅ Key Features:
📦 Automatically draws mirrored Standard Deviation (SD) zones:
0.5 SD, 1 SD, 1.5 SD above and below the 10AM open
Open Line reference for mean reversion tracking
📐 Internal Fibonacci Levels within each zone:
0.236, 0.382, 0.5, 0.618, 0.786
⏱️ Works across any timeframe
📊 Ideal for:
Breakout traders
Volatility compression strategies
Statistical mean reversion models
🔧 Built using precise New York session timestamps, ensuring accuracy across time zones and resolutions.
S&P 500 E-Mini Futures

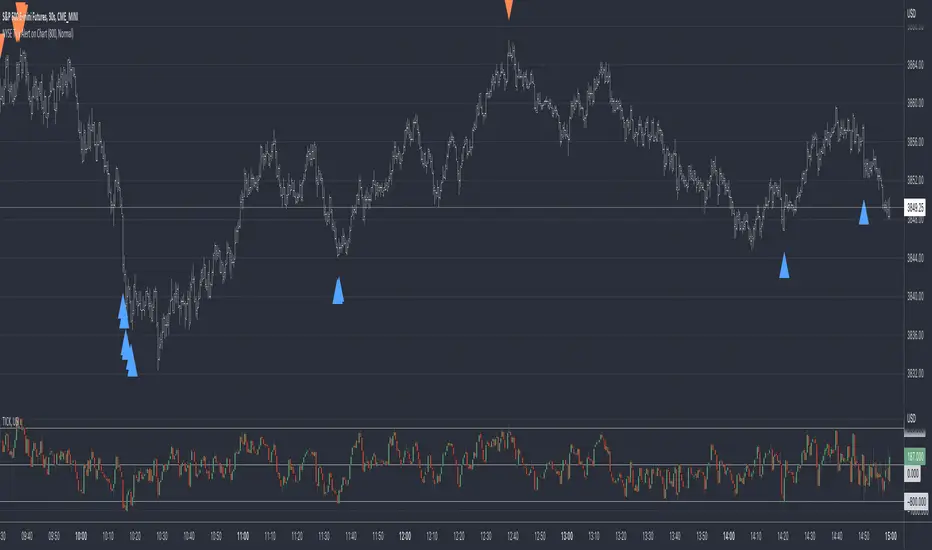
TICK Extreme Levels & AlertsAutomatically draws horizontal lines at +1000 and -1000 TICK levels
Sends alerts when TICK crosses those levels (for potential scalping/reversal setups)
Strategy: How to Use TICK in Real-Time Trading
1. Confirm Market Breadth
Use TICK to confirm broad participation in the move:
• Long S&P futures or SPY? Only buy breakouts if TICK is above +600 to +1000
• Shorting? Confirm with TICK below –600 to –1000
2. Fade Extremes for Scalps
Look for reversals at extreme levels:
• Fade +1200+: market likely overbought short term → scalp short
• Fade –1200–: market likely oversold → scalp long
Use in combo with other signals (like price exhaustion, candlestick reversal, or VWAP touches)
3. Avoid Trading in the Choppy Zone
If TICK remains between –400 and +400, institutions are not committed. This is where fakeouts are common.
4. Time Entries with TICK Swings
For example:
• TICK moves from –800 to +600 = momentum shift → look for long entries
• TICK stalling around +1000 = momentum climax → partial profit or fade play

ATR Contract RecommendationATR Contract Recommendation Indicator
Version: 1
New Features and Enhancements:
ATR Calculation and Smoothing Options:
Calculate ATR using a configurable length.
Choose from multiple smoothing methods (RMA, SMA, EMA, WMA).
Account Size Customization:
Select your account size from three options: 50K, 100K, or 150K.
The contract recommendation logic adjusts dynamically based on the chosen account size.
Instrument-Specific, Customizable Recommendations:
Separate sets of customizable ATR thresholds and recommendation texts for each instrument (NQ, ES, YM) and each account size (C = Contract).
For example, for NQ:
150K Account:
ATR < 5 → "5+C"
5–10 → "5C"
10–15 → "3C"
15–30 → "2C"
30+ → "1C"
100K Account:
ATR < 5 → "4C"
5–10 → "2C"
10–15 → "1C"
15–20 → "1C"
20+ → "5C MNQ"
50K Account:
ATR < 5 → "2C"
5–20 → "1C"
20+ → "5C MNQ"
Similar customizable threshold groups have been added for ES and YM, with instrument-specific suffixes (e.g. "MES" or "MYM") appended when needed.
Customizable Display Box (Table):
The indicator displays a recommendation box on the chart showing the current ATR value and the recommended contract size.
Users can customize the table's position (top left, top right, bottom left, or bottom right).
New Feature: Adjustable table size (number of columns and rows) via new input settings.
Customize the text color and background color of the recommendation box.
Improvements:
Enhanced instrument detection and dynamic recommendation output for a more accurate contract sizing suggestion.
User Interface Enhancements:
Streamlined input groups for thresholds and recommendation texts, allowing for full customization based on account size and instrument.

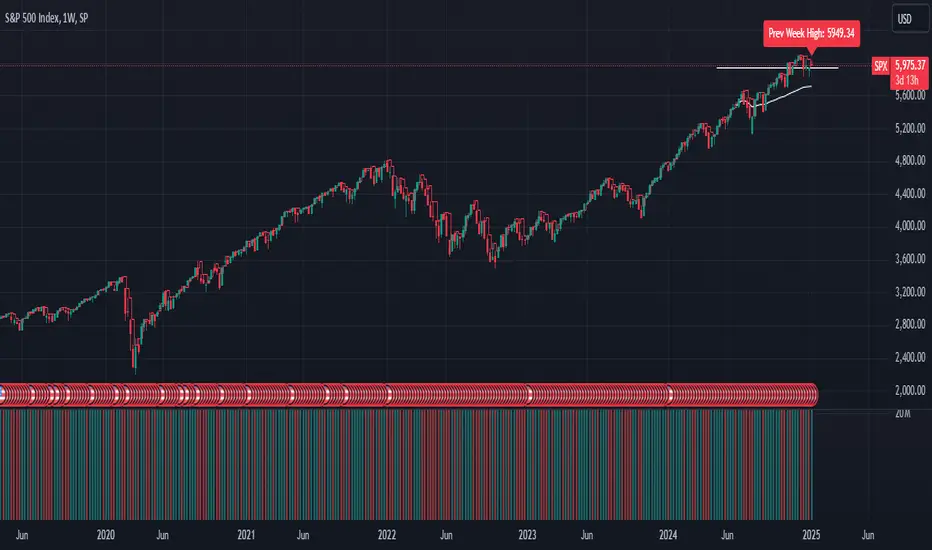
GL_Prev Week HighThe GL_Prev Week High Indicator is a powerful tool designed to enhance your trading analysis by displaying the previous week's high price directly on your chart. With clear and customizable visuals, this indicator helps traders quickly identify critical price levels, enabling more informed decision-making.
Key Features:
Previous Week's High Line:
Displays the previous week's high as a red line on your chart for easy reference.
Customizable Horizontal Line:
Includes a white horizontal line for enhanced clarity, with adjustable length, color, and width settings.
All-Time High Tracking:
Automatically tracks the all-time high from the chart's history and places a dynamic label above it.
Real-Time Updates:
The indicator updates in real-time to ensure accuracy as new bars are added.
User Inputs for Personalization:
Adjust the left and right span of the horizontal line.
Customize line width and color to suit your preferences.
Use Case:
This indicator is ideal for traders looking to integrate the previous week's high as a key support or resistance level in their trading strategy. Whether you are analyzing trends, identifying breakout zones, or planning entry/exit points, this tool provides valuable insights directly on the chart.
How to Use:
Add the indicator to your chart.
Customize the settings (line length, width, and color) through the input panel to match your preferences.
Use the red line to track the previous week's high and the label to monitor all-time highs effortlessly.
License:
This script is shared under the Mozilla Public License 2.0. Feel free to use and adapt the script as per the license terms.
Bull Flag DetectionThe FuturesGod bull flag indicator aims to identify the occurrence of bull flags.
Bull flags are a popular trading pattern that allows users to gauge long entries into a given market. Flags consist of a pole that is followed by either a downward or sideways consolidation period.
This script can be used on any market but was intended for futures (NQ, ES) trading on the intraday timeframe.
The script does the following:
1. Identifies the occurrence of a flag pole. This is based on a lookback period and percentage threshold decided by the user.
2. Marks the consolidation area after the pole occurrence using swing highs and swing lows.
3. Visually the above is represented by a shaded green area.
4. When a pole is detected, it is marked by a downward off-white triangle. Note that if the percentage threshold is reached several times on the same upward climb, the script will continue to identify points where the threshold for pole detection is met.
5. Also visualized are the 20, 50 and 200 period exponential moving averages. The area between the 20 and 50 EMAs are shaded to provide traders a visual of a possible support area.

RTH Levels Initial Balance Overnight 12-1 Opening types (IB)(ON)Made for ES/NQ.
CME_MINI:ES1!
CME_MINI:NQ1!
But it will most likely work for all USA futures. Default clock settings are set according to CST.
This Indicator automatically draws RTH levels, yesterday’s RTH levels, initial balance, overnight and 12-1 (lunch) levels.
In additionally, at RTH open, it shows opening type.
Also shows/alert works for 12-1 stat.
You may need to change the clock range settings for stocks.
Definitions of opening types.
If price opens the day above the previous day session high, it is considered Higher Outside Range. (HOR)
If price opens the day between the previous close and the previous high, it is considered Higher Inside Range. (HIR)
If price opens between the previous close and previous low, it is Lower Inside Range. (LIR)
If price opens below previous day session low, it is Lower Outside Range. (LOR)
Acronyms:
RTH : Regular Trading Hours
ON : Overnight
IBH : Initial Balance High
IBL : Initial Balance Low
IBMid: Initial Balance Mid
ONH : Overnight High
ONL : Overnight Low
ONMid : Overnight Session Midpoint Price
yRthO : Yesterday's rth open
yRthH : Yesterday's rth high
yRthL : Yesterday's rth low
yRthC : Yesterday's rth close
yRthMid : Yesterday's rth mid
12-1 : Lunch time for Chicago (12pm to 1pm) (CST)
rthmid (for rth session) : (high + low) / 2

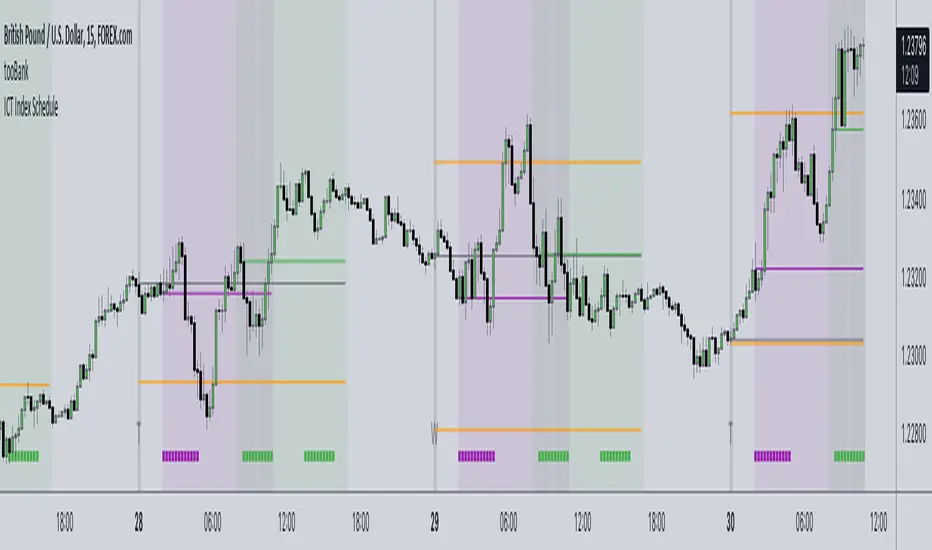
ICT Index ScheduleNew ICT student here, decided to compile the daily schedule and salient levels for London and New York index sessions into one place to aid my learning – thought others might benefit from this too :)
The script works with whatever timezone setting, however make sure to change your timezone to New York time if you want to have the proper time-price alignment (I personally find it helpful when studying).
Here's a legend of all the elements displayed at once:
London only:
New York only:
// Couldn't find a comprehensive script with all the elements included, s/o to @the1dv for their Days of Week script.
SPY Targets to ESSPY Targets to ES is an indicator that draws lines on an ES / MES futures chart based of price targets given for SPY.
This is useful if given support/resistance levels or price targets for SPY and you like to see the converted value to ES / MES
This indicator also converts VWAP from SPY and adds it to the ES / MES chart.
Note that conversion is happening on price updates, and there are small conversion differences between ES and SPY as price moves. This is why lines are not perfectly straight. To counter this, smoothing is added which evens out the variations. Please give yourself up to 0.5-1 handle deviation from the line drawn on the futures chart.
Version 1.0 supports up to 30 price targets. More targets will be added in later version
Scallop Pattern built for scalping NQ & MNQ
The Scallop Pattern identifies momentum reversal.
The pattern consists of two candles and the direction to trade is confirmed in the following candle.
An example trade is shown in the picture. s3.tradingview.com
A Stop Limit order is generally used to enter the long position.

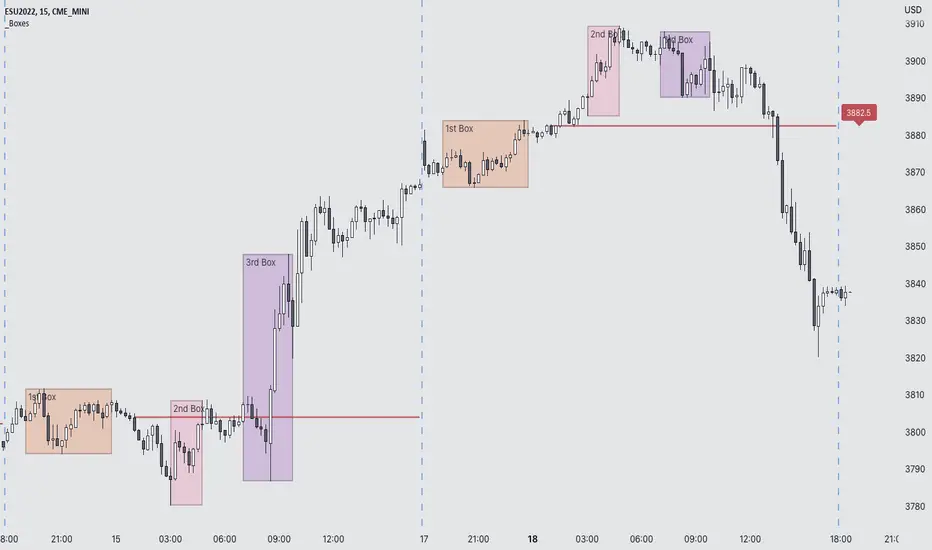
Futures Exchange Sessions 3.0Description
The ultimate conclusion to the Futures Exchange Sessions 2.0 indicator. In version 3.0 the user gets full control of the start and end times of three separate dynamic boxes and one horizontal line. If the user wants to visually keep track of killzones, lunches, or any other time span in a trading day, version 3.0 will dynamically expand and keep track of price within the time specified by the user.
Inputs and Style
Everything about the three dynamic boxes and one horizontal line can but independently configured. Color, style, border, width can all be adjusted. In the Settings each box has a text box so the user can give each one a unique name.
Timezone
All of the start and end times are in EST. Additionally, each box and line need a dependent start of each day. This is controlled by a setting where the user can specify a timezone called Start Day Timezone which would be midnight of the respective timezone. In general if a box or line resides within a particular Session pick the corresponding timezone. If the users box/line fits in the Asian Session then choose Asia/Shanghai. If the box/line is within the London Session then choose Europe/London. And the same goes for the New York Session.
Special Notes
If start time is within one period of the Start Day Timezone in the Settings, then the line/box won't display
Boxes and time lines only display when timeframe is <= 30 minute
To turn off box text label set opacity to 0%
Pre Market \ Opening Range High LowGreen vertical lines are showing pre market open and then the opening range as the first hour of market NYSE market open
Pre market high and low are blue lines | intraday opening range high low are in white
Trades are taken in the current direction above | below range breaks with the direction of price action using the moving averages
Price breaking through moving averages and a range is the optimal trade to enter - exit at next range for target - stop loss below the lower | higher moving average depending on short or long
A break above or below the intraday high or low and pre market high or low can give massive profits trailing your stop loss as price runs
Using MA 5 and 12 to filter out entries and exits above or below the ranges short or long is also another strategy to implement
BEST TIME FRAME TO USE IS 5 MINUTE

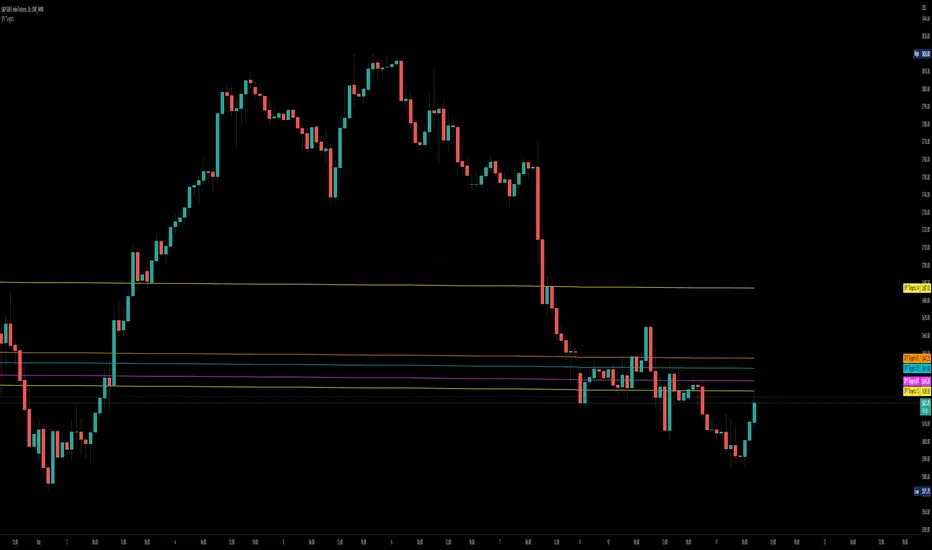
LVOLA MODELAnother variant of the VOLA Model Range.
To use this script which focusses on vol on the given equity/commodity/price pair its focussed on at its core methodology. We use NQ1 here as an example on how this indicator can be used. Note the red lines indicate where buy signals occurred an example listed below. Note the best timeframes to use this indicator include (intraday - 1d trades) 7min, 30min, 1hr and Daily for multi day trades. This can be used in conjunction with MVEX VOLA, VOLA & ZVOLA (especially so) when looking to trade $NQ/$ES QQQ / SPY use this in conjunction with the other VOLA models to confirm whether a buy/sell signal. This can also be used on equities since total flows in the bond market can help dictate movement in equities.
This is distilled into a simple method where you can use this indicator to gauge a potential buy or sell signal. The red shows a sell signal and a green which is a buy i.e. when the blue line short term signal (blue line) has a major divergence vs the mid and long term then this is typically a sell signal. This is shown in the chart above.
The green lines indicate where buy signals occurred with an example listed below.
The same goes for the reverse where the short term signal (blue line) is higher then we have a view of a potential buy signal.
Once again when the VVS (Short term signal) is flattened out then we have a slowing done in the movement of price action and a reversion has the potential to occur. The greater the divergence and when the line blue line flat lines i.e. stops going up or down and is separate from the green and the red, you then have a view to take a long (if above green and red with a large gap) and a sell (when blue is below green and red with a large gap).
Once again there are times where the signal will not work, as with every indicator, model etc nothing hits 100% and I doubt there ever will be such an indicator to exist. As with everything please manage your risk.

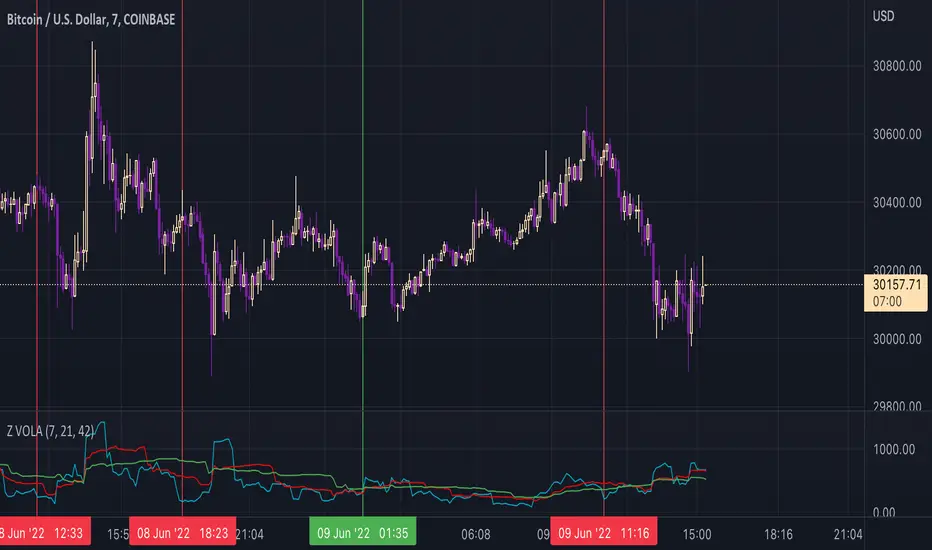
ZVOLA MODELAnother variant of the VOLA Model Range.
To use this script which focusses on vol on the given equity/commodity/price pair its focussed on at its core methodology. We use ES1 here as an example on how this indicator can be used. Note the red lines indicate where buy signals occurred an example listed below. Note the best timeframes to use this indicator include (intraday - 1d trades) 30min, 1hr and Daily for multi day trades. This can be used in conjunction with MVEX VOLA & VOLA in particular when looking to trade $NQ/$ES QQQ / SPY as MVEX VOLA/VOLA can confirm whether a buy/sell signal is in line with the VOLA MODELs move.
This is distilled into a simple method where you can use this indicator to gauge a potential buy or sell signal. The red shows a sell signal and a green which is a buy i.e. when the blue line short term signal (blue line) has a major divergence vs the mid and long term then this is typically a sell signal. This is shown in the chart above.
The green lines indicate where buy signals occurred with an example listed below.
The same goes for the reverse where the short term signal (blue line) is higher then we have a view of a potential buy signal.
Once again when the VVS (Short term signal) is flattened out then we have a slowing done in the movement of price action and a reversion has the potential to occur.
Once again there are times where the signal will not work, as with every indicator, model etc nothing hits 100% and I doubt there ever will be such an indicator to exist. As with everything please manage your risk.
Futures Exchange Sessions 2.0Description
Successor to Futures Exchange Sessions indicator. Completely rebuilt code from the ground up. Every feature has been redesigned and refactored to be the most beneficial while allowing for complete configuration by the user.
This indicator displays Futures Sessions as live boxes that expand dynamically as price moves over the time interval. These boxes make liquidity levels extremely easy to spot and visualize. It helps the user identify market structure and develop their own bias of price action. Everything about the Session boxes can be configured. Box color, border color, border style, and border width are all individually controllable. Each Future Session can be turned on or off at any time. Also, each box has their own text label (Asian Session, London Session, New York Session) and this text can be moved around the box, change color, and change size.
Previous days highs and lows (major liquidity levels) are always important to the futures trader. This indicator now allows the user to individually display the three previous days highs and low levels as lines with optional label. Each line can be independently toggled on or off and like always, every conceivable customization option is available to the user. And the labels can be moved to the right (via the Input Settings) to allow unobstructed views of candles.
The midnight EST open and 8:30 AM EST open horizontal lines (developed by the Inner Circle Trader) are returning in this indicator. But the biggest improvement is that the lines stop at the current bar or the last bar of the trading day. Additionally, the time lines are displayed on previous days so the user can easily see how the candles reacted to these important times of the day.
The Session boxes and the horizontal time lines now can be set to only display a certain number of day back. If the user wants just to see Session boxes for the previous day only, they can do that. If the user wants to see the last 15 days of boxes or lines it is very easy to increase the days back in the settings. Currently, the max days back is 80 calendar days.
Additional Images
Easily visualize and understand price action across time
Everything is customizable so the user can easily match this indicator to their color preferences
Special Notes
To turn off box session text set opacity to 0%
Boxes and horizontal time lines only display when timeframe is <= 30 minute

MVEX VOLA MODELTo use this script which focusses on vol on the given equity/commodity/price pair its focussed on at its core methodology. We use ES1 here as an example on how this indicator can be used. This indicator is mainly for ES/NQ and its constituents (except consumer staples, energy etc) which lack the same correlations.
Note the red lines indicate where buy signals occurred an example listed below. Note the best timeframes to use this indicator include (intraday - 1d trades) 30min, 1hr and Daily for multi day trades.
This is distilled into a simple method where you can use this indicator to gauge a potential buy or sell signal. The red shows a sell signal and a green which is a buy i.e. when the blue line short term signal (blue line) has a major divergence vs the mid and long term then this is typically a sell signal. This is shown in the chart above.
The green lines indicate where buy signals occurred with an example listed below.
The same goes for the reverse where the short term signal (blue line) is higher then we have a view of a potential buy signal.
Once again when the VVS (Short term signal) is flattened out then we have a slowing done in the movement of price action and a reversion has the potential to occur.
Once again there are times where the signal will not work, as with every indicator, model etc nothing hits 100% and I doubt there ever will be such an indicator to exist. As with everything please manage your risk.
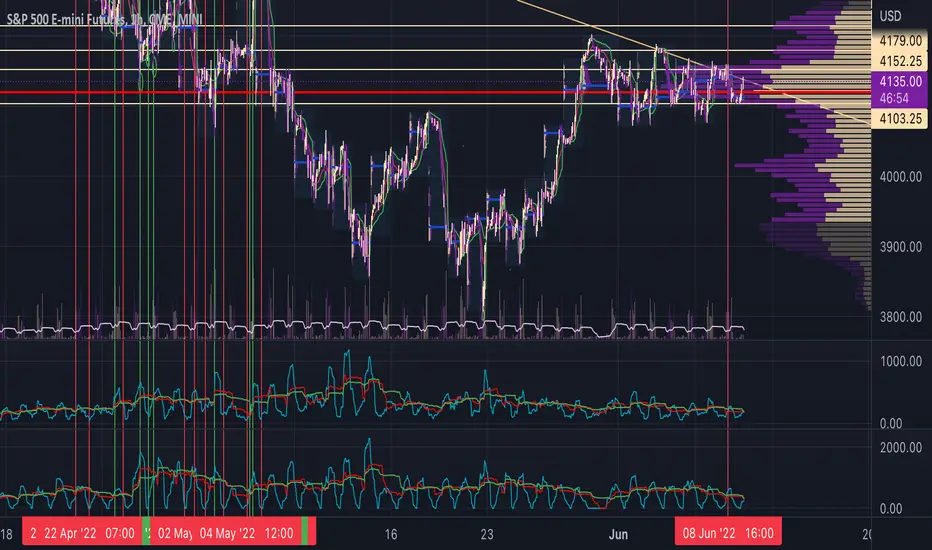
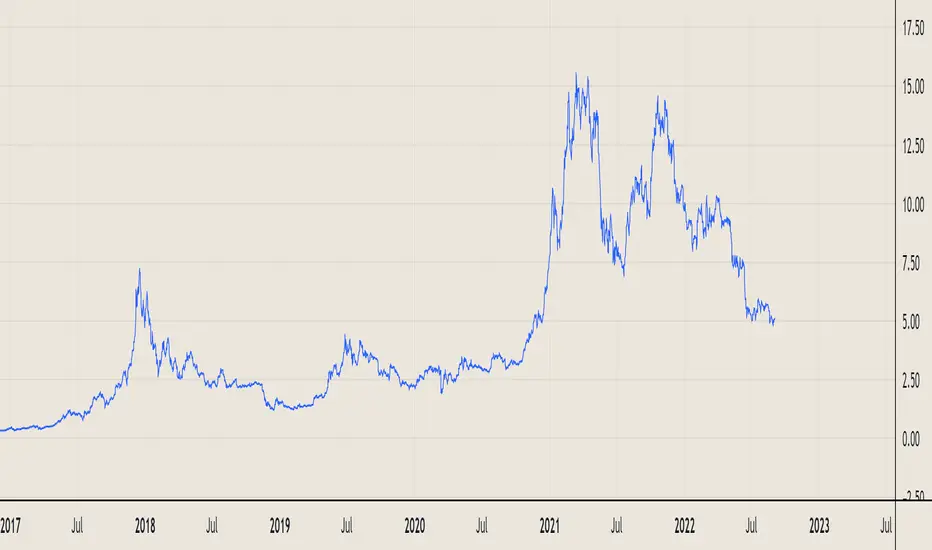
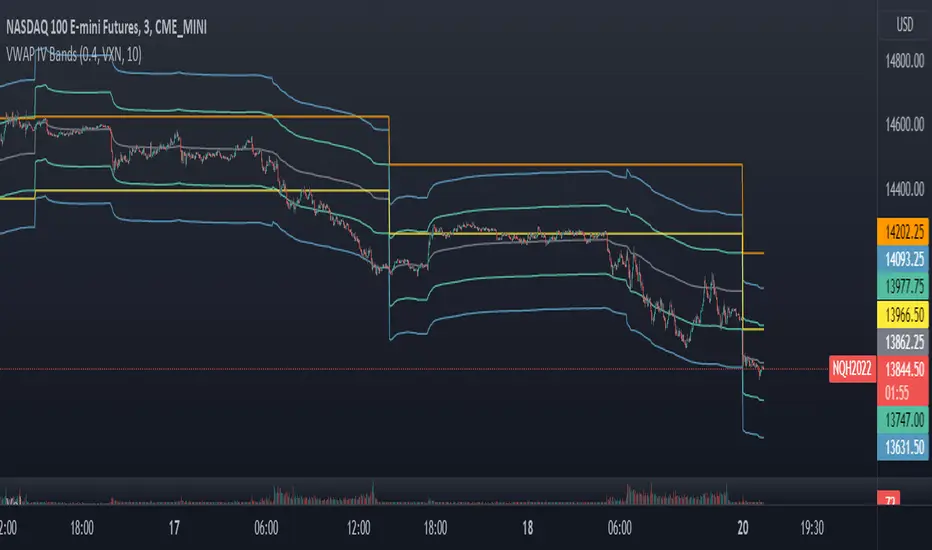
VWAP Implied Volatility BandsThis script takes the built in VWAP function and creates bands using various Volatility Indexes from the CBOE. The script plots the bands at desired multiples, as well as the closing value of the prior day's first set of bands. Users can choose from the following:
VIX(ES), VXN(NQ), RVX(RTY), OVX(CL), GVX(GC), SIV(ZS), CIV(ZC), TYVIX(ZN), EUVIX(EURUSD), BPVIX(GBPUSD)
Upon selecting the desired volatility index, users must change the multiplier to fit the underlying product since the indexes are all calculated differently.
The goal with this script was to use market generated information (IV) to highlight potential trade locations.
VIX Implied Move Bands for ES/Emini futuresThis script uses the close of the VIX on a daily resolution to provide the 'implied move' for the E-mini SP500 futures. While it can be applied to any equity index, it's crucial to know that the VIX is calculated using SPX options, and may not reflect the implied volatility of other indices. The user can adjust the length of the moving average used to calculate the bands, the window of days used to calculate the implied move, and the multiplier that effects the width of the bands.

Equity Index Extended HoursHighlights the extended hours/Globex session for US Equity Index Futures.

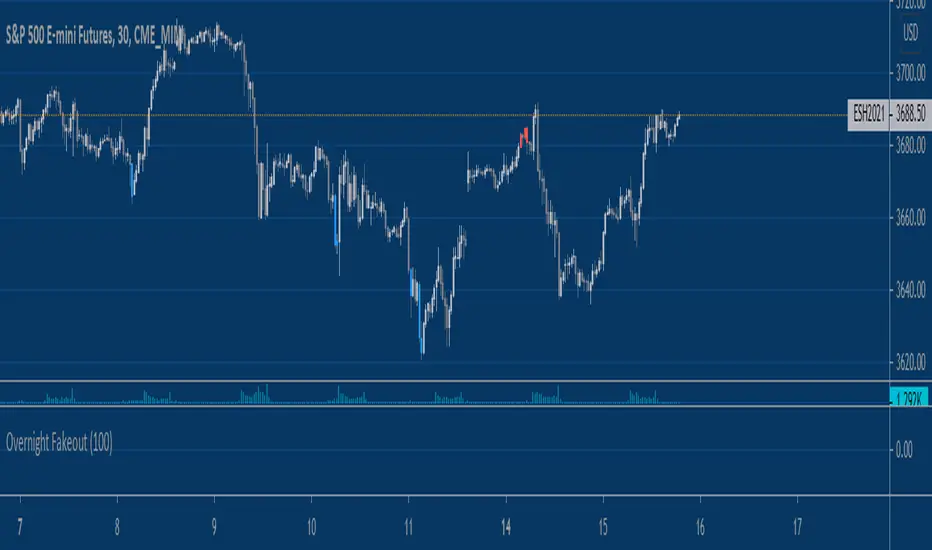
Overnight Bollinger Band ExtremesThis script is a combination of my overnight fakeout script and bollinger band color bars. It's designed to be used on CME/CBOT Equity Indexes during their GLOBEX session. It uses the built in Bollinger Band script and highlights bars that exceed the upper/lower bands during the overnight session.

Keltner Channels Color BarsAnother tweak to a classic built-in script. Simply replacing the Keltner Channels overlay plot with color bars.

Equity Index Overnight FakeoutThis script highlights when price violates the highest high or lowest low within the user's selected lookback period, with the caveat that it occurs during the GLOBEX session. The script is designed to work exclusively with the trading hours for CME and CBOT Equity Index futures. I'm planning to make a more customizable version down the line.
My reasoning behind this very simple script is that the low liquidity and participation of the overnight session creates a tendency for moves at extremes to mean revert. Let me know what you think.