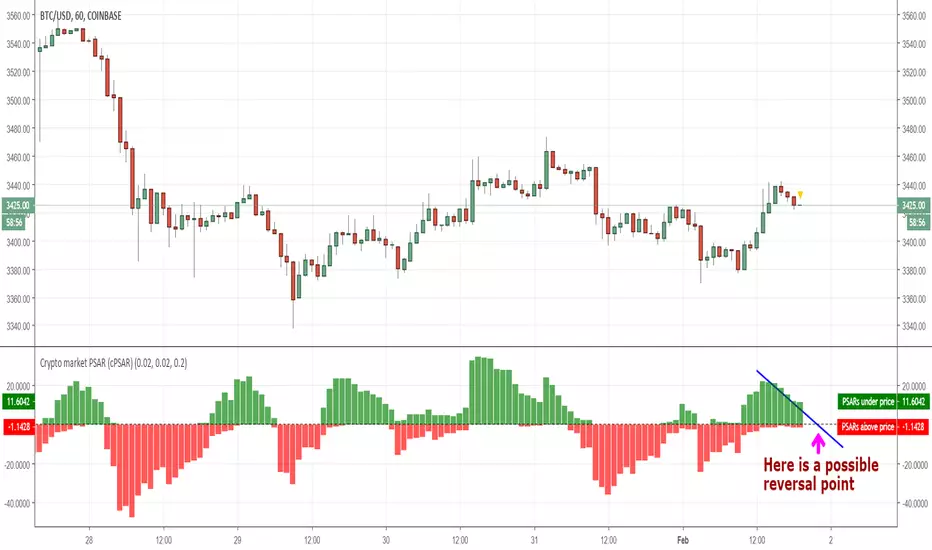
Crypto market PSAR (cPSAR)This indicator calculates the PSARs of the most liquid cryptocurrencies (as percent differences from the prices) and sums them together.
The PSARs under the closes, which act as support, are summed separately and shown in green. The PSARs over the closes (acting as resistance) are summed separately and shown in red.
The result is an indicator which can be interpreted somewhat like the RSI (but keep in mind that PSAR is a lagging indicator unlike the RSI which is a leading indicator). By interpreting this correctly you can - SOMETIMES - predict the short-term turns of the entire crypto market.
Many traders use the prices shown by PSAR (Parabolic Stop And Reverse) to set stop loss prices and/or to take profit and reverse their positions. This is why, on reversal of the PSARs (= when one of the red or green values becomes visibly larger than the other), a strong turning of the market can, sometimes, occur.
以太坊(加密貨幣)
ASX300 Golden Cross stock alerts (A2M-ANZ)Golden Cross happens when the SMA50 crossover the SMA200, which usually signals profitable bullish trend and good buy entry. For example, for Aurelia Metals the Golden Cross buy signal had 250% buy and hold profit in about a year.
This indicator hunts for the Golden Cross of the first 20 stocks in the ASX300 (A2M to ANZ), once it it happens the indicator plots the name of the stock that had Golden cross which could be use as entry for that stock. As you can see various stocks were plotted in the chart, those had crossedover at the time of plotting.
Due to TradingView Pinescript limitations, only 20 stocks can be watched in one indicator. Therefore 15 Golden Cross indicators are required to watch the entire ASX300.
This can also be applied to crypto coins with some adjustments in the script, so you can be alerted of the Golden Cross in crypto coins and buy bullish coins.

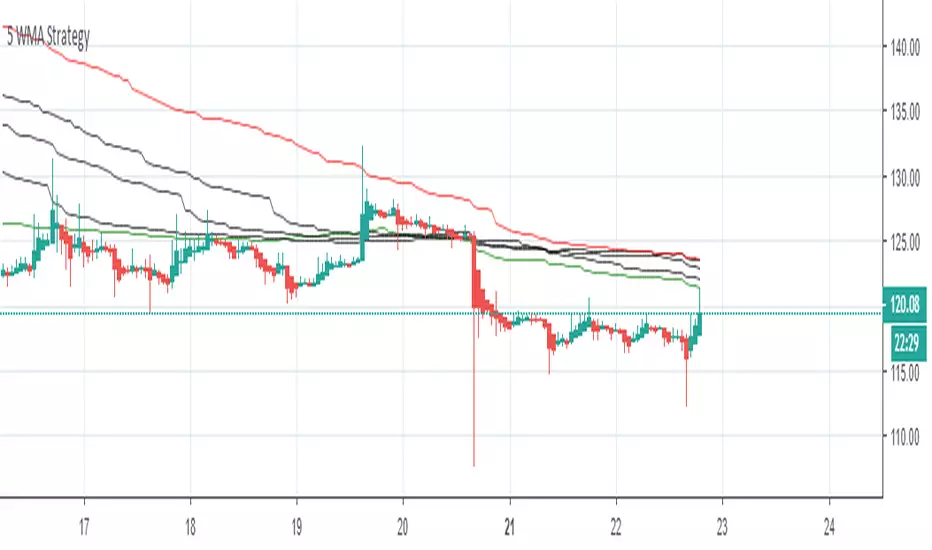
5 Weighted Moving Averages Strategy for Trend Analysis This indicator was made to allow Five WMA to be displayed without needing to use up 5 charting indicators individually
This is best Indicator for Support and Resistance, If GREEN line is on TOP market Bullish
If RED line is on Top Market is Bearish ,
Entry and Exit place Long and Short orders on Lines According to Trend
For more info contact : rohitworkss@gmail.com
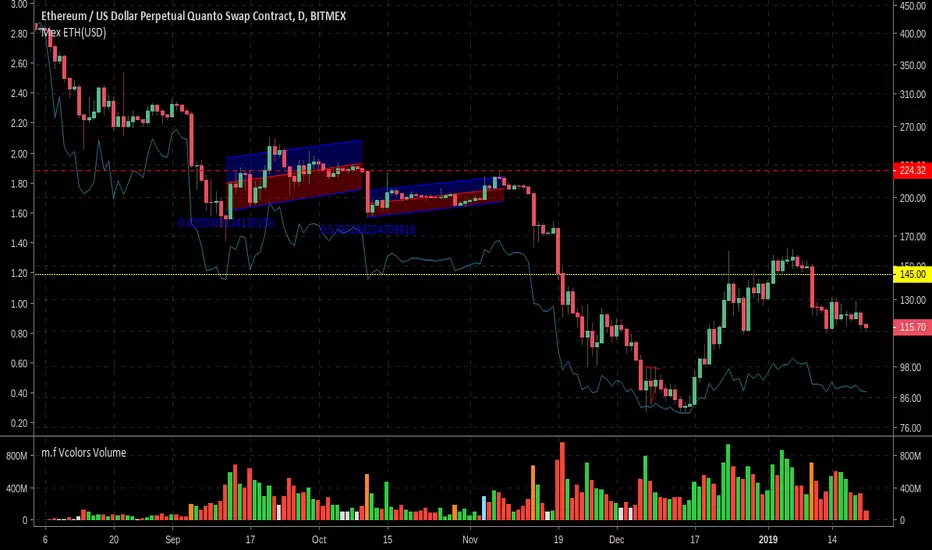
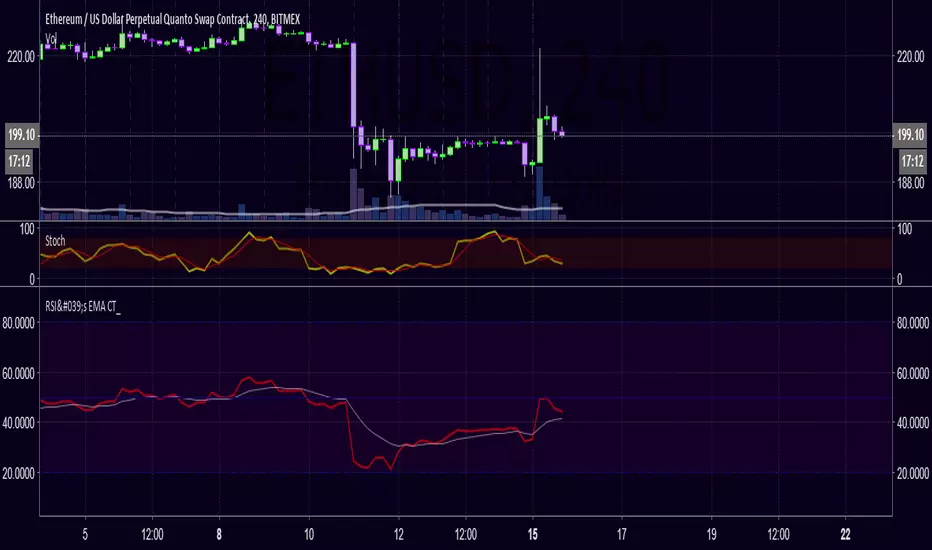
BitMEX ETHUSD contract value (USD)The ETHUSD Quanto Swap contract on BitMEX allows you to trade ETHUSD with Bitcoin put forward as collateral. However this means that 1 contract is not equal to 1 USD or 1 ETH, but instead varies according to the price of ETHUSD.
You can see the contract specs here www.bitmex.com and find more information here blog.bitmex.com
My advice is always to make sure you fully understand a derivative product before you trade it, however many of us may not have the acumen to actually understand how a quanto swap works. Nevertheless, we have to be aware that the value in USD of each contract depends on the price of Ethereum and also the price of Bitcoin at each point in time.
This tool will show you the value of a single ETHUSD contract in USD, but it solely for indicative purposes only. Your trade, your risk. I do not ask for any donations from your gains and I am not liable for any of your losses.
Source code is provided.
Note in the example image that the price of ETHUSD is plotted on a logarithmic scale but the indicative contract value is linear.
RSI + Stochastic RSI Indicator CombinedFree to use RSI and Stochastic RSI, combined within one indicator.
The RSI and Stochastic RSI are two of the most commonly used and respected indicators in trading technical analysis. By placing them on top of each other you can save valuable space on your chart and stay more easily within your TradingView indicator limit.
The RSI is bright blue, with the "neutral" 30-70 chart area shaded blue.
The Stoch RSI is red and blue, with the "neutral" 20-80 chart area shaded purple.
None of the other annotations shown above will appear, they are only to demonstrate how they can be interpreted.
So what does the RSI do?
Broadly speaking, the Relative Strength Index measures the strength and movements of a market.
Above 70 the RSI is considered oversold = an increased likelihood of an incoming price drop.
Below 30 the RSI is considered undersold = an increased likelihood of an incoming price rise.
What does the Stochastic RSI do?
Broadly speaking, the Stochastic RSI measures the momentum of a market. It does this by measuring the RSI relative to its own high/low over the previous period.
Above 80 the Stoch RSI is considered oversold = an increased likelihood of an incoming price drop.
Below 20 the Stoch RSI is considered undersold = an increased likelihood of an incoming price rise.
Look for when the two Stoch RSI lines cross over - it is an important signal.
When the blue line is on top we have momentum driving the price up; when the red line is on top we have momentum driving the price down.
The key here is to look for periods where both the RSI and Stoch RSI are both low at the same time (especially on the daily chart) = an extremely promising entry point to catch a move up. Equally, looking for periods where both the RSI and Stoch RSI are very high is likely a good exit point (or at least a time to make absolutely certain you have a suitable stop-loss in place), because a price drop is likely not far away.
Remember: the Stoch RSI does not always fluctuate cleanly between the top and bottom. At any time it can change direction to reflect market conditions, which is why a stop loss is essential at all times. Equally, just because the RSI or Stoch RSI is at 100, it is still possible for it to keep going up due to whale action or traders FOMOing in. The same applies at low levels. Both these indicators represent historical data and therefore are not strictly predictive in nature, but show trends that may be in action.
Please give me a thumbs up and follow me if you found this useful. This tool is for educational purposes only and not a recommendation to buy or sell. Always do your own research before trading. Make sure to add this to your favourite scripts.
Best wishes,
BCryptological
ps - combine this powerful indicator with knowledge of strong support and resistance points with the 50/100/200 Moving Average . This will help you identify likely entry/exit points to maximise the accuracy of your predictions.

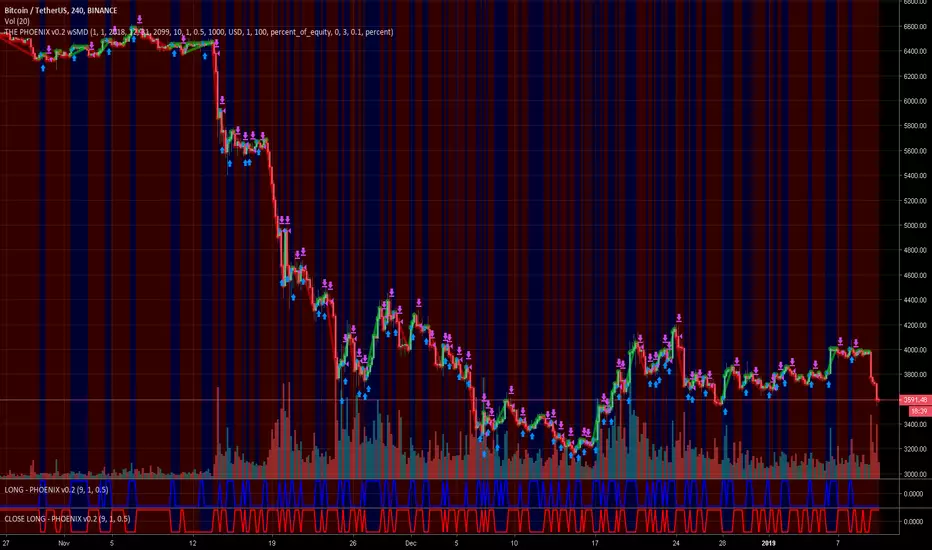
THE PHOENIX v0.1 wSMD - ALERTSALERTS for PHOENIX v0.1 - DO NOT USE THIS SCRIPT UNLESS YOU ARE MARGING TRADING
--------------------------------------------------------------------------------------------------------
Implementation in TradingView of modified version of the "Weis Wave".
indicatior will generate Long and Close Long signals according to market trend.
(Learned the hard way that using short instead of close long to close long orders will seriously mess backtest results and create unrealistic expectations)
Added a customizable RATE OF CHANGE indicator that I called SMD (sideways market detection) to try and avoid trading on sideways market.
References: "Trades About To Happen" David H. Weis, Division 2 of the Richard D. Wyckoff Method of Trading in Stocks.
I've had best results on 2h and 4h charts, I would not recommend to go below 1h, my general rule is to run the backtest on regular candle and make sure the backtest gives goodd result, but I use the script with autoview on heikin ashi.
Backtesting: You can change the dates of the backtest as you please, the backtest runs with 1000USD and 100% of equity orders, 3 ticks slippage and 0.1% commission.
For Autoview users: Will upload LONG ALERT and CLOSE LONG ALERT studies separately as I find it easier to see whats going on on 2 seperate indicators.
NO, IT DOES NOT REPAINT.

[SignalFI] - FutureFI Free [BTC Long VS Short RSIFutureFI uses the futures (Long and Short) contracts housed on Bitfinex to provide a gauge for the relative difference and strength of interest in buying or selling Bitfinex assets based on total contracts created.
FREE VERSION
Hi All,
Welcome to the free version of FutureFI which shows the RSI of the difference between BTC Long and Short Contracts on Bitfinex. In this version, the difference between the RSI of the contracts can be viewed however the following features are locked for members only:
1) Longpower and Shortpower color shading
2) Total New Longs added column bars
3) Multi-Timeframe Signals
4) Longpower and Shortpower Exhaustion Alert signals
5) Chart Asset Standard RSI Exhaustion Alerts
We hope that you find this useful, and that you're interested in the advanced signaling available in our members only scripts which take this concept to a new level.
Supported Assets:
LongAsset "BTCUSDLONGS"
MEMBER "ETHUSDLONGS","XRPUSDLONGS","EOSUSDLONGS","LTCUSDLONGS","BTGUSDLONGS","ETPUSDLONGS","IOTUSDLONGS","ETCUSDLONGS","ZECUSDLONGS","NEOUSDLONGS","XMRUSDLONGS","ZRXUSDLONGS","OMGUSDLONGS","DSHUSDLONGS","BABUSDLONGS","BSVUSDLONGS","SANUSDLONGS","EDOUSDLONGS","TRXUSDLONGS","XLMUSDLONGS","BATUSDLONGS","VETUSDLONGS","SNGUSDLONGS"
ShortAsset "BTCUSDSHORTS"
MEMBER
"ETHUSDSHORTS","XRPUSDSHORTS","EOSUSDSHORTS","LTCUSDSHORTS","BTGUSDSHORTS","ETPUSDSHORTS","IOTUSDSHORTS","ETCUSDSHORTS","ZECUSDSHORTS","NEOUSDSHORTS","XMRUSDSHORTS","ZRXUSDSHORTS","OMGUSDSHORTS","DSHUSDSHORTS","BABUSDSHORTS","BSVUSDSHORTS","SANUSDSHORTS","EDOUSDSHORTS","TRXUSDSHORTS","XLMUSDSHORTS","BATUSDSHORTS","VETUSDSHORTS","SNGUSDSHORTS"
SignalFI was created to help traders and investors to effectively analyze the market based on the Golden Mean Ratio (Fibonacci numbers), plan a trade and ultimately execute it. To help inform and educate market decisions we developed a set of Trading Indicators which are available on TradingView , the most advanced and yet easy to use charting platform available on the web.
SignalFI indicators are just that, indicators. Our indicators are generally configured to use completely historical data (negating repaint), and we advise all alerts created with SignalFI indicators to be fired upon "close" of the current candle. Our indicators can provide valuable context and visualization support when performing market analysis and executing buy and sell decisions. However. we are not financial experts, and all information presented on this site or our other media outlets are for educational purposes only.

[SignalFI] PhilakOne ExtremeWelcome,
This script is provided for free as a support system for the trading strategy developed by Philakone (@philakonecrypto).
Phil has been providing immense support to the trading community through consistent education, and thats why we decided to adapt and automate his system so that everyone can follow.
Key Features
1. Moving Averages
By default fibonacci based EMA moving averages are included with the script set at:
- MA 1 = 8
- MA 2 = 13
- MA 3 = 21
- MA4 = 55
We also added green and red fill colors to show the current status of each MA with respect to the other MA's.
By default Phil uses EMA, however, we included several other MA types to enhance and expand on this concept. Included are the following MA types:
Kaufman Adaptive Moving Average(KAMA)
Hull Moving Average
Smoothed Moving Average
Variable Index Dynamic Average
Fractal Adaptive Moving Average
Fractal Dimension Adaptive Moving Average
Double Exponential Moving Average
Least Squares Moving Average
Coefficient of Variation Weighted Moving Average
Simple Weighted Moving Average
Exponential Moving Average
Weighted Moving Average
Arnaud Legoux Moving Average
Option Types Labels:
"SWMA", "EMA", "WMA", "SMA", "HMA", "KAMA", "SMMA", "VIDYA", "VWMA", "ALMA", "FRAMA", "DEMA", "FDAMA", "LSMA", "COVWMA"
2. RSI
Phil relies on simple RSI to determine the relative strength of a trend. To display this easily we added bar coloring that matches overbought and oversold situations.
Red Bars = RSI > 70
Green Bars = RSI < 30
3. MACD
Phil also uses MACD to determine the trend. To display this easily we added signals above and below bars to show crossovers between the MACD and the MACD Signal line.
Small Green Triangle UP = MACD bull cross
Small Red Triangle DOWN = MACD bear cross
4. Alerts
We know that everyone can't watch charts all day, so we configured this script with full alerting for each of the components above.
1. Moving Average Bull Cross
2. Moving Average Bear Cross
3. RSI Overbought Cross
4. RSI Oversold Cross
5. MACD Bull Cross
6. MACD Bear Cross
Thanks to Phil for the inspiration and continued community education.
We hope you enjoy!
General Information
SignalFI was created to help traders and investors to effectively analyze the market based on the Golden Mean Ratio (Fibonacci numbers), plan a trade and ultimately execute it. To help inform and educate market decisions we developed a set of Trading Indicators which are available on TradingView , the most advanced and yet easy to use charting platform available on the web.
SignalFI indicators are just that, indicators. Our indicators are generally configured to use completely historical data (negating repaint), and we advise all alerts created with SignalFI indicators to be fired upon "close" of the current candle. Our indicators can provide valuable context and visualization support when performing market analysis and executing buy and sell decisions. However. we are not financial experts, and all information presented on this site or our other media outlets are for educational purposes only.
For subscription information, visit www.signalfi.net and follow us on twitter.

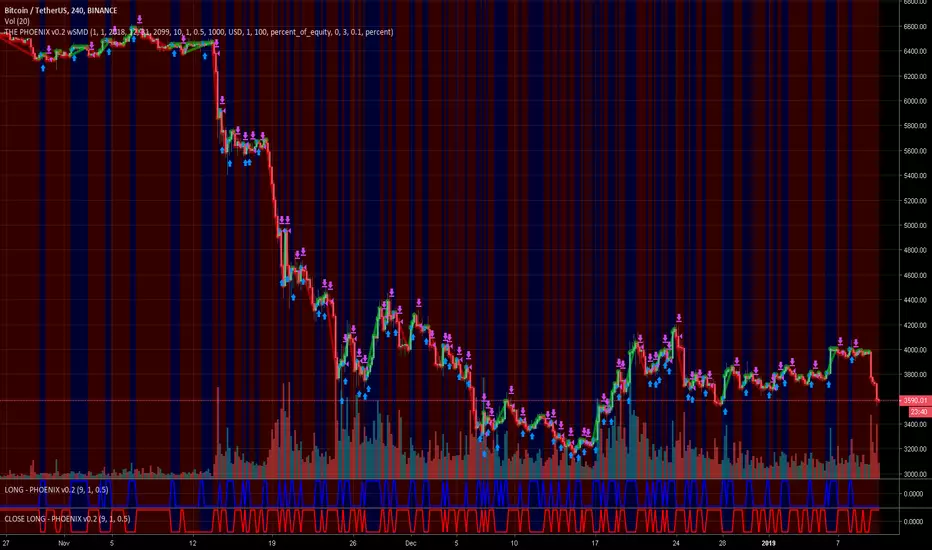
CLOSE LONG - PHOENIX v0.2This is the CLOSE LONG alert script for THE PHOENIX v0.2 wSMD
ALWAYS SET YOUR ALERTS ON 'CROSSING UP' value 0 on CANDLE CLOSE
LONG - PHOENIX v0.2This is the LONG alert script for THE PHOENIX v0.2 wSMD
NOTE: ALWAYS SET YOUR ALERTS ON 'CROSSING UP' value 0 on CANDLE CLOSE
BTC ETH RatioBTCUSD / ETHUSD Ratio.
You might find patterns when to move from BTC to ETH and vice versa.
# Open Source
The code is open source @ github.com and uses the commonpine library github.com

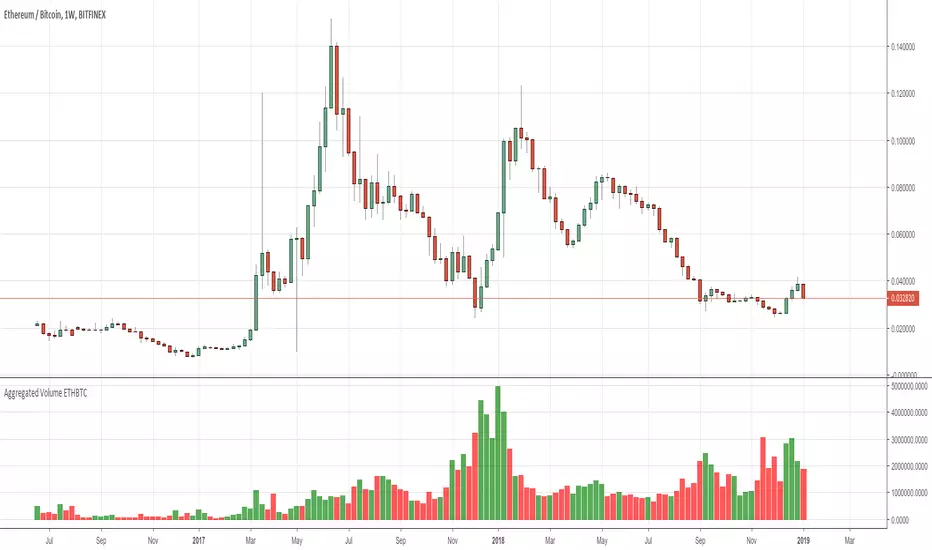
Aggregated Volume ETHBTCAggregates the ETH/BTC volume from multiple exchanges into a single indicator.
# Exchanges and Pairs
Included are only exchanges supported by TradingView:
* Binance
* Bitstamp
* Bittrex
* Coinbase
* Gemini
* Bitfinex
* Kraken
* Poloniex
* HitBTC
Excluded low volume exchanges (not in CMC Top):
* CEX.IO
Many other top exchanges are not included, because they are not supported by TradingView.
# Inputs
By default the spot exchanges are selected. You can select also the other margin trading and derivatives exchanges.
# Contribute
Feel free to share any ideas and issues you have.
# Open Source
The code is open source @ github.com and uses the commonpine library github.com
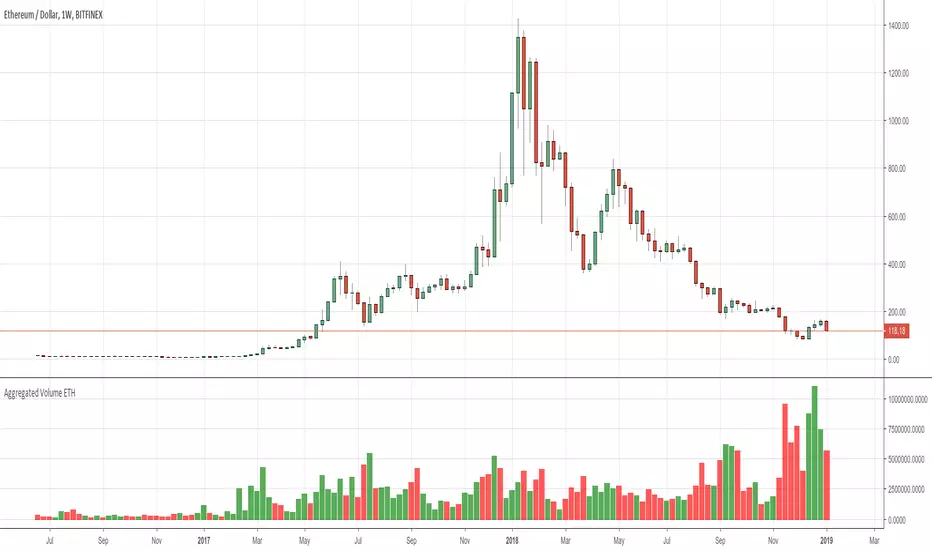
Aggregated Volume ETHAggregates the ETH/fiat volume from multiple exchanges into a single indicator.
# Exchanges and Pairs
Included are only exchanges supported by TradingView:
* Binance
* Bitstamp
* Bittrex
* Coinbase
* Gemini
* itBit
* Bitfinex
* Kraken
* Poloniex
* BitMEX
Excluded low volume exchanges (not in CMC Top):
* CEX . IO
* Coinfloor
Excluded exchange due to volume calculation by TV:
* HitBTC
Many other top exchanges are not included, because they are not supported by TradingView.
# Inputs
By default the spot exchanges are selected. You can select also the other margin trading and derivatives exchanges.
# Contribute
Feel free to share any ideas and issues you have.
# Open Source
The code is open source @ github.com and uses the commonpine library github.com
Crypto Aggregated VolumeThis is a helper tool to perform reliable volume studies in Crypto markets .
Currently, we face the problem of unreliable crypto volume when focusing on a single exchange.
Volume keeps flowing from place to place each time a new fashion exchange appears in the scene.
"Old" exchanges that once were relevant might dry in volume terms. And that's an issue to study volume on a wider context.
For that reason, I've created this indicator: to aggregate crypto volume and overcome the current limitations.
As a user, you're able to select which exchanges to aggregate:
Volume from Unleveraged Exchanges
Volume from Leveraged Exchanges
All Exchanges
Or custom select the exchanges by marking the checkboxes
By default, the indicator is aggregating volume from unleveraged exchanges. The reason for that is because their read might be more reliable.
Trading Bots which distort the volume read, mainly operate in margin exchanges because unleveraged trading is less attractive to them.
On this first release I've aggregated the volume from the following markets:
BTCUSD
ETHUSD
ETHBTC
I've found that aggregating markets is a time intensive task. Therefore if you're using this indicator, please leave a comment below and let me know which other markets you would like being added.

Cyatophilum Crypto Trader 1H [ALERTSETUP]A strategy specificaly engineered for trading altcoins.
Crypto pairs configurations already available: ADA/BTC, BNB/BTC, EOS/BTC, ETH/BTC, ICX/BTC, NEO/BTC, TRX/BTC, XLM/BTC, XMR/BTC, XRP/BTC.
This version allows to create automated alerts for buy and sell signals that can be used for manual or bot trading.
Note: You can use the backtest version for finding the best configuration for your pair if it isn't in the list. I will also be there to help you.
How it Works
The strategy is based upon two Exponential Moving Averages, it captures trend reversals, fakeouts, has a stop loss option and more (see the presentation page for input parameters description).
It should be used in 1 Hour timeframe and on any pair of cryptocurrency.
Backtest
The Net Profit (Gross profit - Gross loss) is calculated with a commission of 0.05% on each order.
Each trade is made with 100 % of equity
Get the indicator today!
Purchase on my website : blockchainfiesta.com

Crypto USD Pairs CorrelatorHey there!
This tool helps to identify the best positive and negative correlated pairs from 38 crypto */USD pairs.
By default it will find the best correlations for your current ticker.
If you are a newbie in Correlation Analysis you can find a brief explanation here .
Settings
Lookback for correlations (default: 14 )
Option to use or not to use current ticker (default: true )
Custom ticker (default: BTCUSD )
Choose as many pairs as you want from 38 available pairs.
Available pairs
ADAUSD
BATUSD
BCDUSD
BCHUSD
BCNUSD
BNBUSD
BTCUSD
BTGUSD
BTSUSD
DASHUSD
DCRUSD
DGBUSD
DOGEUSD
EOSUSD
ETCUSD
ETHUSD
ICXUSD
IOTAUSD
LSKUSD
LTCUSD
MKRUSD
NANOUSD
NEOUSD
OMGUSD
ONTUSD
PAXUSD
QTMUSD
TRXUSD
VETUSD
WAVESUSD
XEMUSD
XLMUSD
XMRUSD
XRPUSD
XTZUSD
ZECUSD
ZILUSD
ZRXUSD
Good luck!

Total Volume for BTC or ETHBITMEX:ETHUSD BITSTAMP:BTCUSD Script includes cumulative Bitcoin volume from exchanges such as Binance, Bitfinex, Bithumb, Coinbase and more
As default, volume is shown based on the number of Bitcoin moved
If volume increases day over day the color will be blue, if it dereases the color will be red. This is not related to price
You can currently switch between ETH or BTC by putting those abbreviations in on the settings inputs
You can also switch to a USD output
You can remove Bitmex data as this exchange is highly leveraged contracts, default includes Bitmex data
Some delays in loading as the indicator pulls data from multiple exchanges
Future updates may include availability of other coins or additional exchanges added

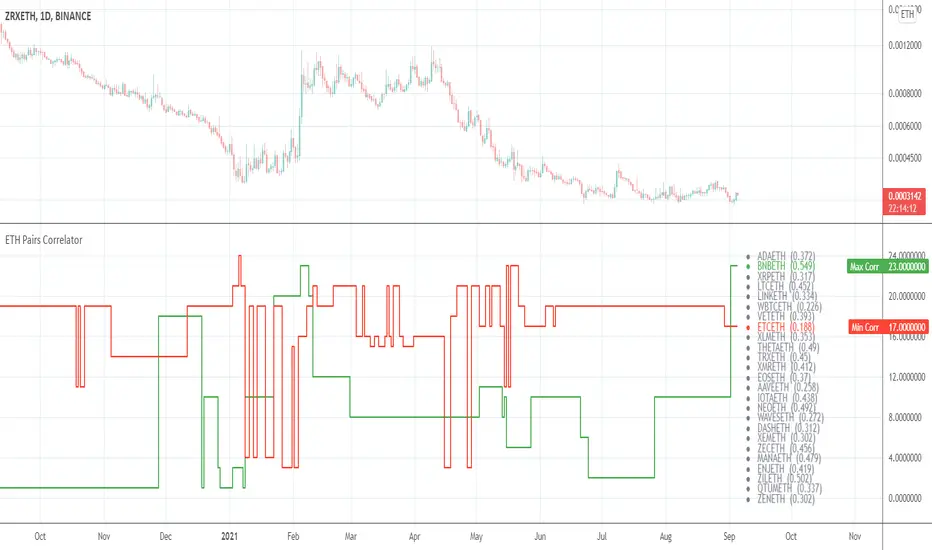
ETH Pairs CorrelatorHey there!
This tool helps to identify the best positive and negative correlated pairs from 38 */ETH cryptocurrency pairs.
By default it will find the best correlations for your current ticker.
If you are a newbie in Correlation Analysis you can find a brief explanation here .
Settings
Lookback for correlations (default: 14 )
Option to use or not to use current ticker (default: true )
Custom ticker (default: BTCUSDT )
Choose as many pairs as you want from 38 available pairs.
Available pairs
ADAETH
BATETH
BCDETH
BCHETH
BNBETH
BSVETH
BTGETH
DASHETH
DGBETH
EOSETH
ETCETH
HOTETH
ICXETH
IOTAETH
LSKETH
LTCETH
MKRETH
NANOETH
NEOETH
NPXSETH
OMGETH
ONTETH
QKCETH
QTMETH
REPETH
TRXETH
TUSDETH
VETETH
WAVESETH
XEMETH
XLMETH
XMRETH
XRPETH
XTZETH
XVGETH
ZECETH
ZILETH
ZRXETH
Good luck!
ETHUSD Total VolumesHello traders!
This tool shows you ETHUSD total trade volumes from the all (well, almost) cryptocurrency exchanges on different timeframes.
Supported timeframes
"1"
"3"
"5"
"10"
"15"
"30"
"45"
"60" - 1 hour
"120" - 2 hours
"180" - 3 hours
"240" - 4 hours
"300" - 5 hours
"360" - 6 hours
"420" - 7 hours
"480" - 8 hours
"540" - 9 hours
"600" - 10 hours
"660" - 11 hours
"720" - 12 hours
"780" - 13 hours
"840" - 14 hours
"900" - 15 hours
"960" - 16 hours
"1020" - 17 hours
"1080" - 18 hours
"1140" - 19 hours
"1200" - 20 hours
"1260" - 21 hours
"1320" - 22 hours
"1380" - 23 hours
"D"
"2D"
"3D"
"W"
"M"
How to get access
Buy for only 25$ to get lifetime access to this indicator
Like and follow for more cool indicators!
Happy Trading!

Range Levels - High and Low of Daily, Weekly, and Montly RangesThis is a great free script for the current ranging crypto markets.
You can see the daily, weekly, and monthly high and low of ranges. It also has alerts that you can enable in the settings and then setup in your TradingView alerts for when the price crosses these levels.
Customer Request: Trend Precognition - Mtrl_ScientistHi everyone,
This is a private build specifically requested by one user.
There are options to enable/disable 4 additional algorithms, whereas the current setting only shows the base algorithm ("BTC Precognition").
The "warning" text indicates a possible trend change, and is based on overbought/oversold conditions that can be adjusted in the settings.

RSI's EMA by @cryptoTrader_RSI Indicator with EMA of RSI. Great Confirming Signals. Modified version of CM_ and lazyBear. *RSI is red
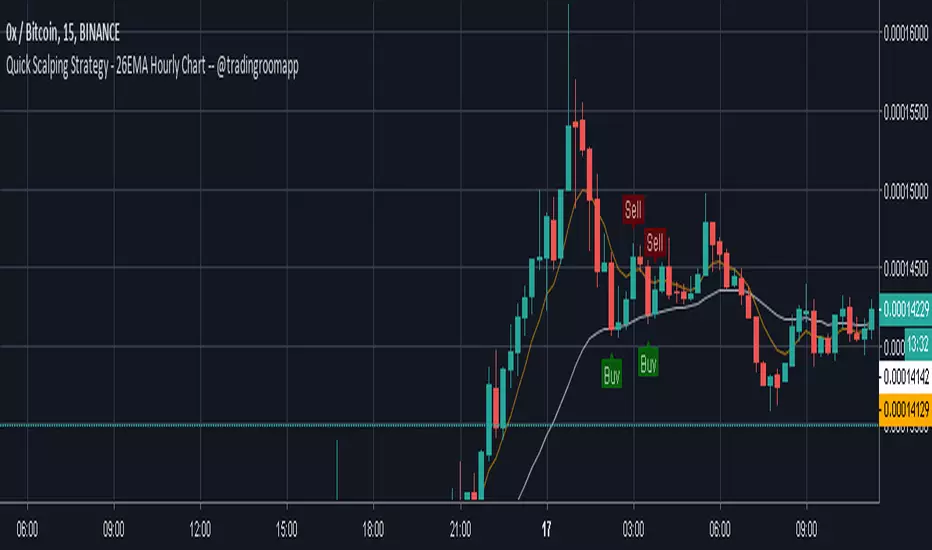
Quick Scalping Strategy - 26EMA Hourly Chart -- @tradingroomappQuick Scalping Strategy around 26EMA and 7EMA published by @TradingRoomApp twitter.com
and brought into TV by myself.
It will give you a quick Buy and Sell opportunity based on crypto price spikes.
If you want access to the tool feel free to send me a DM or contact me through twitter (@CryptoNTez)
Happy Trading!