Welles Wilder MAHow to trade:
Recommended for longer timeframes at least 4H.
Buy when the green dot appears.
Sell when the yellow dot appears.
Welles Wilder moving average by XOOOOOO
以太坊(加密貨幣)


RSI Fibonacci Levels StrategyRSI with Fibonacci Levels
Visually can be used as:
- Countertrend indicator at extreme green/red lines
- Follow trend indicator
- Fibonacci supports and resistantes zones
The strategy works as a follow trend
How to trade:
The indicator is more reliable in longer time frames, at least 4H
Choose a fibonacci level as reference
Buy when the RSI line turns green
Sell when the RSI line turns red

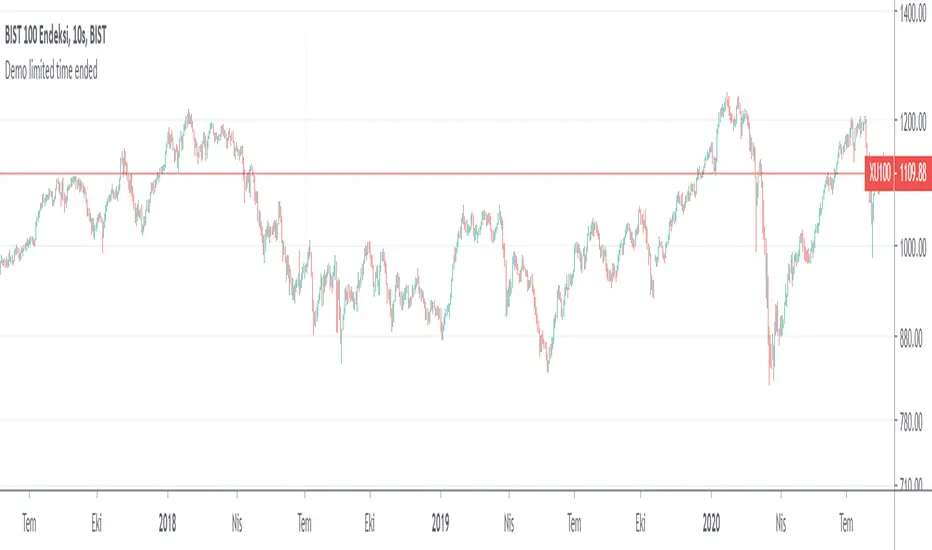
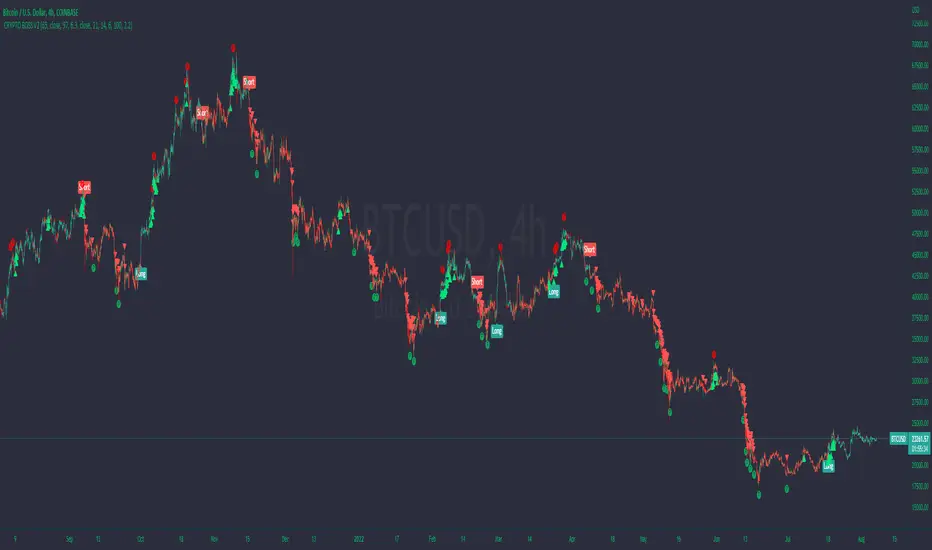
Borsaca Demo Limited Time OnlyThis indicator does NOT REPAINT. If the signal occurs it will be forever. Easy and profitable strategy optimized for Crypto, Foreks and Stock Markets...
This indicator gives you Long and Exit signals all timeframes...
BORSACA TRADER is optimized to catch trend movements as soon as possible and maximize profitability.
Strategy tester results. 96% Profitable on BTCUSD Daily scale. Test other markets you want.
WE RELY ON OUR INDICATOR TO THE END. AND WE ASSURE YOU THERE IS NOTHING BETTER THAN THE BORSACA TRADER INDICATOR.
Best regards and happy trading.
Herif's winning strategy option. Check the strategy tester results success than %96
Safe Mode as optional parameter. You can enable this to prevent some riskier trades to happen at the cost of some profitability. Use it if you are more conservative in trading.
Normal Mode signals for Buy and Sell. Trade Mode signals for buy and sell use with support and resistance levels.
Auto Support And Resistance ..
Auto Fibonacci Levels...
BORSACA TRADER indicator is the best option for everybody in financial markets. Check my Profile Page for more information and follow me, like and favorite my indicator and support your positive response and take a message for 10 days trial.
Happy trading. Good luck :)

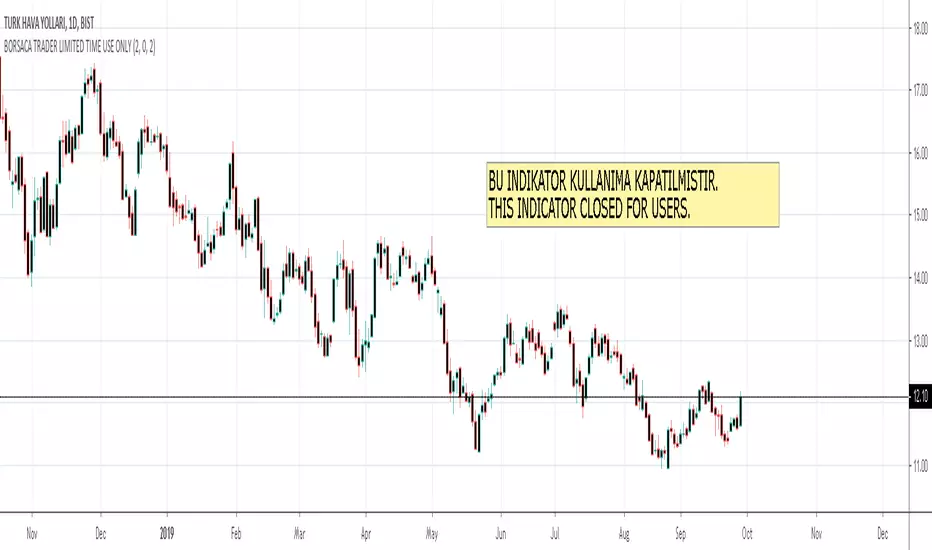
BORSACA TRADER LIMITED TIME USE ONLYThis indicator does NOT REPAINT. If the signal occurs it will be forever. Easy and profitable strategy optimized for Crypto, Foreks and Stock Markets...
This indicator gives you Long and Exit signals all timeframes...
BORSACA TRADER is optimized to catch trend movements as soon as possible and maximize profitability.
Strategy tester results. 96% Profitable on BTCUSD Daily scale. Test other markets you want.
WE RELY ON OUR INDICATOR TO THE END. AND WE ASSURE YOU THERE IS NOTHING BETTER THAN THE BORSACA TRADER INDICATOR.
Best regards and happy trading.
Herif's winning strategy option. Check the strategy tester results success than %96
Safe Mode as optional parameter. You can enable this to prevent some riskier trades to happen at the cost of some profitability. Use it if you are more conservative in trading.
Normal Mode signals for Buy and Sell.
Trade Mode signals for buy and sell use with support and resistance levels.
Auto Support And Resistance..
Auto Fibonacci Levels...
BORSACA TRADER indicator is the best option for everybody in financial markets. Check my Profile Page for more information and follow me, like and favorite my indicator and support your positive response and take a message for 10 days trial.
Happy trading. Good luck :)
₿OARWelcome to the ₿OAR!
This indicator is very simple to use. Simply apply it to any chart and you will see ₿ULL and ₿EAR signals! A ₿ULL signal is a buy and a ₿EAR signal is a sell.
Heikin ashi is recommended with this indicator.
You can also set alerts with this indicator. DM for access.

Borsaca StrategyThis indicator uses contrarian investment style. You can use Buy/Sell indicator and trade hibryd mentality. What do you say? Dont hear before what is mean?
Ok. Good Luck.

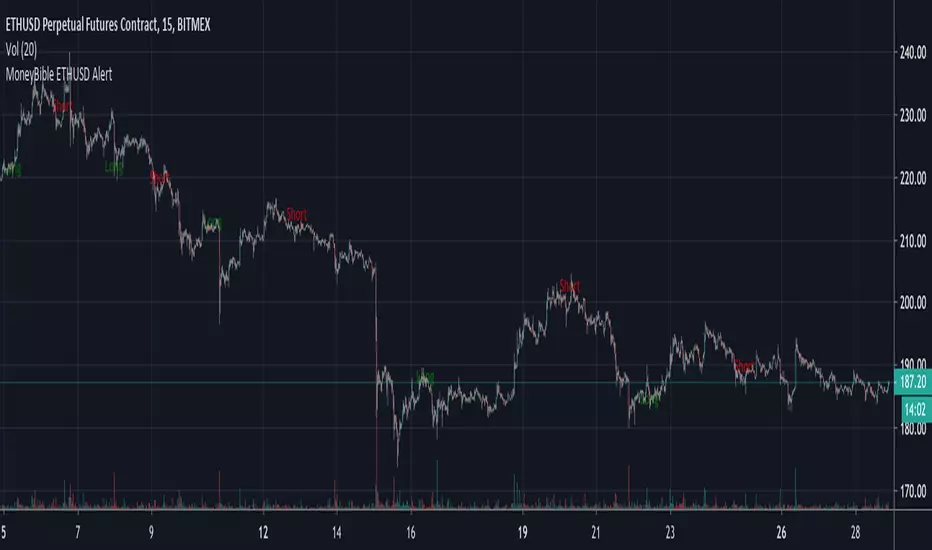
MoneyBible ETHUSD AlertMoneybible BITMEX:ETHUSD alert on 15m candlestick . It will be re-optimized monthly.
The script is written in PineScript V.3, makes no use of the security() function and does not use the Trailing Stop-Loss function from TradingView. No repainting issue.
Backtester here :
MoneyBible ETHUSD BacktesterMoneybible BITMEX:ETHUSD backtester on 15m candlestick . It will be re-optimized monthly.
The script is written in PineScript V.3, makes no use of the security() function and does not use the Trailing Stop-Loss function from TradingView. No repainting issue.
Alert script here :

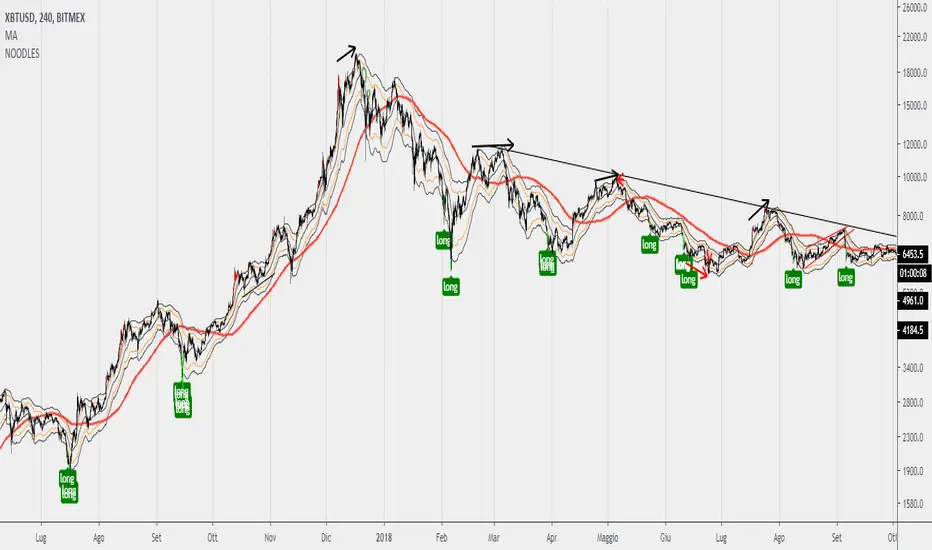
Noodles ema bands + BUY/SELL signal CandleEma bands as support and resistance based on 12/26.
+Buy and Sell signal candle (green and red)
This script work better on 1 hour timeframe. for altcoin change setup from source: ''LOW'' to ''OPEN''
Crypto InfoPanel (MD)Credits to Daveatt for helping me fix the momentum =)
This panel shows the following:
-BTC LTC ETH prices on different exchanges listed on the panel.
-EMA above/below price 10/20/30/40/50/60/100/200/400 in form of symbols ( based on the "Momentum lines" script)
-MTF Momentum direction in form of symbols 1/3/5/15/30/45/1h/2h/4h/8h/12h/1D/1W/1M (based on the Momentum Divergence script waves)
This script allows you to see every momentum direction of every time frame, put all together into one panel. Making your life easier when scalping with "Momentum divergence" script.
Notes:
If you want me to plot more data into the panel, post a comment what else to add or how to improve the panel.

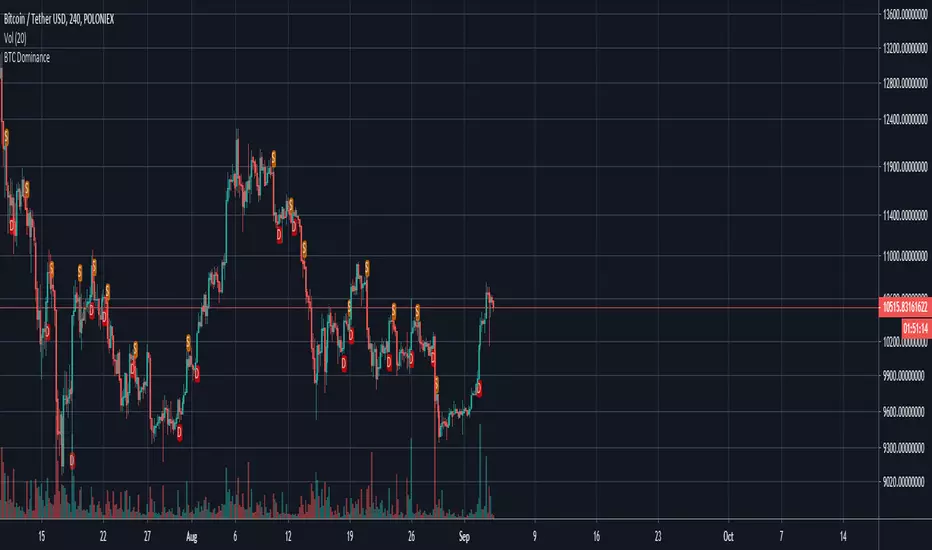
BTC Dominance IndicatorThis script calculates the BTC dominance and adds markers as overlays on top of your crypto chart.
A red "D" means "BTC dominating" and an orange "S" means "BTC submissive". In both cases further price actions are imminent.
You can use this script for any crypto asset to see how it performs while btc is dominating.
If you are for example trading a BTC paired asset, then this can give you a warning if BTC starts to dominate (BTC paired assets tend to dump if BTC dominates).
On the other hand, you can use this as signal on USD paired cryptos if BTC dominates as USD paired cryptos tend to go with BTC.
It is recommended to use additional indicators with this as it is not meant as buy/sell signalling tool.
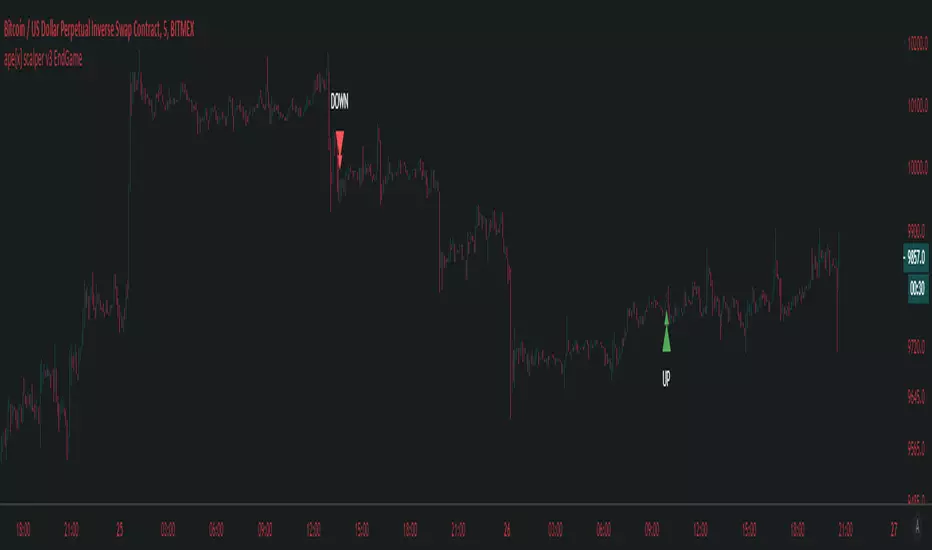
ape[x] gooseBangerPowered by apeX trading algorithm
Suitable for all 5m time frame and every market of this world including cryptocurrencies, forex, traditional stocks and options.
Discord for more info : discord.gg/3NXpFYB

Broly Returnsthis is a study created on pine v4, gives u a lot of usefull information about the trend, as u can see we have AVERAGE TRUE RANGE BANDS, also simple moving average, buy when green appears, and sell when the red come over, good trading bye.

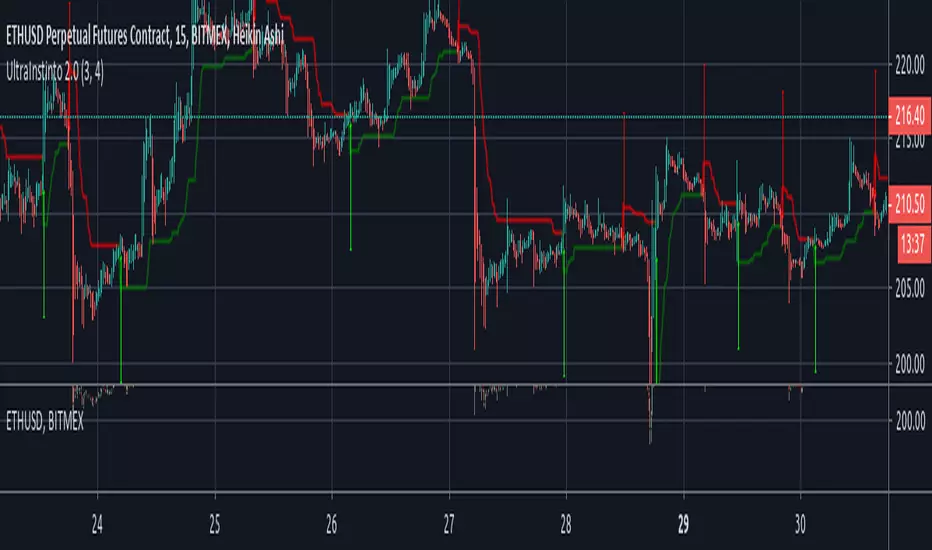
UltraInstinto 2.0BITMEX:ETHUSD
UltraInstinto 2.0 is a trend hunter tool, based on the latest artificial inteligence algorithms it can take decisions on real time, on any frametime, buy when the green arrow appears, and sell when the red arrow appears, easier than play fortnite, and returns you a lot of money
BitMEX Funding Visual by Mcrypt28This is a modified script originating from user m59 that better visually represents the BitMEX funding trend over time. Green indicates the funding is positive (longs pay shorts every 8 hours to maintain their position) and red indicates the funding is negative (shorts pay longs). The darker the color means the higher the rate. The unproven theory is that the funding helps to identify what retail investors are doing at a given time. Thus, in downtrends as the negative funding is drying up, a low may be near. In uptrends, as the funding remains negative, retail is generally bearish and continues to sell as institutional investors likely are absorbing. Vice versa for when the funding is positive. In any market in general, money flows from the many to the few. That means whatever retail is doing is generally the opposite of what will be the actual outcome. One more modifier to the m59 script is that volume is factored into the calculation which will impact which threshold (opacity on the chart) it falls within.
If you'd like to chart the BitMEX funding yourself, I'd recommend checking out the source from m59's indicator as that is more likely to stay up to date if BitMEX makes any changes to the way funding is calculated. The source if this is protected for that reason.

[astropark] 21 days EMAAre you tired to edit you EMA indicator to fit the 21-day settings for your timeframe?
Now you have it for free!
Enjoy!

ape[x] 5m scalperSmaller time frame trades and if ape confirms the move feather on the hat 🎩.
Also Helps to take profit/stop in ape swing trades.
Note this is a scalper and works only on 5min timeframe unlike ape (15min).
You can find ape 15m swing trader here :
BB - Study - CryptoFoudid.comHi everyone,
A new script transformed on a study from QuantNomad.
Based on the Bollinger Bands to catch the range market.
I filtered the consecutive signals to avoid a "funding" issue.
You can configure it as you want based on inputs.
The best way for crypto is to have about 45 to 55 length and 2 to 3.5 in multiplier but it's your choice :)
ENJOY !

OBV StochasticsThis indicator uses both a standard Stochastic Oscillator based on security prices and stochastically oscillated OBV values.
Explanation:
Stochastics measure momentum by comparing the current closing price to its lowest and highest price over a user-defined window of n periods. Without going too in depth, traders can view the K value as the current value for the stochastic indicator and the D value as a Simple Moving Average of K values. Users can adjust the length of that Simple Moving Average through modifying the smooth D parameter in the input option menu.
Traders can also define the upper and lower bounds for both sets of K and D values. These are plotted on the graph as the horizontal red (upper) line and horizontal green (lower) line. Generally, the upper line is viewed as the threshold at which a security can be considered overBought. Conversely, the lower green line is the threshold at which they can be viewed as overSold.
OBV, or On-Balance Volume, is a versatile momentum indicator that we discussed in our OBV Z-Scores open-source script. That is a good place to look if you're looking to gain a better understanding of the OBV indicator. By applying the stochastic formula to the OBV, it allows us to gain a better understanding of the current OBV value relative to its historical data and display the OBV in a {0.100} bounded range of values.
Plotting the standard price-based Stoch. K and D in combination with the Stoch. OBV K and D can help identify divergences and track the progression and direction of trends. For example, you can see that when the two move in opposite directions or when one significantly outpaces the other, it often hints towards an impending reversal.
The Graph:
As mentioned the upper and lower overbought and oversold thresholds can be adjusted by the trader and are plotted on the graph in red and green.
The green oscillating line represents the Stoch. K of OBV values, while the red line symbolizes the OBV D values.
The teal line is the standard Stoch. K and the orange line is the standard Stoch. D.
Users have two options for background highlights. The first option is to use green highlights to show entry signals and red highlights to show exit signals. These signals are based on the criteria we have set for identifying optimal entry and exit points. This is shown in the second pane.
The second option is to plot red highlights whenever Stoch. OBV K crosses the upper bound and green highlights whenever it crosses the lower bound. This is shown in the bottom pane. NOTE: Choosing this option means that signals will not be displayed in sequential entry-exit order (instead this is a good option if traders only want to identify when the security is overbought or oversold).
Input Options:
Traders can adjust the respective smooth K and smooth D values for both the standard stoch. and OBV stoch. Additionally, the lookback window length can be adjusted as well as the upper and lower bounds(in addition to the display options shown above).
Alerts:
Indicator sends alerts when entry and exit conditions are met, as well as alerts to inform traders when overbought/oversold conditions are met. Alerts can be tailored for GunBot / other automated trading platforms upon request.
~Happy Trading~

BOSS| Trade Like A Bitcoin and Ethereum WhaleTHE BEST BITCOIN AND ETHEREUM INDICATOR FOR TRADINGVIEW.COM
Quantum Technology – You won’t find any other indicator out there that predicts the probability of the next candle being bullish or bearish .
No Lag, No delay, No repaint!
Quality of Signals – The new Boss Quantum allows you to be in control of the outcome probability. Higher accuracy!
Buy/Long on Long Signal
Sell/Short on Short Signal
SET ALERTS TO ONCE PER BAR CLOSE
//////////////////////////////////////////////////////////////////////
Breakouts, Profit Points, and ReEntry's
This indicator will alert you of when to take profits, when to reenter a trade, and when a breakout occurs.
TAKING PROFITS
When in a long position take long profits on teal circle which, will be above candle.
When in a short position take short profits on purple circle which, will be below candle.
I typically exit 25-50% of position and reenter 25-50% on next candle.
If a Long or Short signal on BOSS quantum is still present the long or short trade is still active.
ReENTRY's
Long ReEntry's
If in a long position and a purple circle appears below candle this indicates a great place to either reenter trade or add more to position.
If a green triangle appears below candle you can either reenter or add more to long position as this signifies a long breakout/ strong upward movement.
Short ReEntry's
If in a short position and a teal circle appears above candle this indicates a great place to either reenter trade or add more to position.
If a red triangle appears below candle you can either reenter short or add more to short position as this signifies a short breakout/ strong downward movement.
Breakout's
Green Triangle
If a green triangle appears below candle you can either reenter or add more to long position as this signifies a long breakout/ strong upward movement.
Red Triangle
If a red triangle appears above candle you can either reenter short or add more to short position as this signifies a short breakout/ strong downward movement.
SET ALERTS TO ONCE PER BAR
Available At: Bosscripts.com
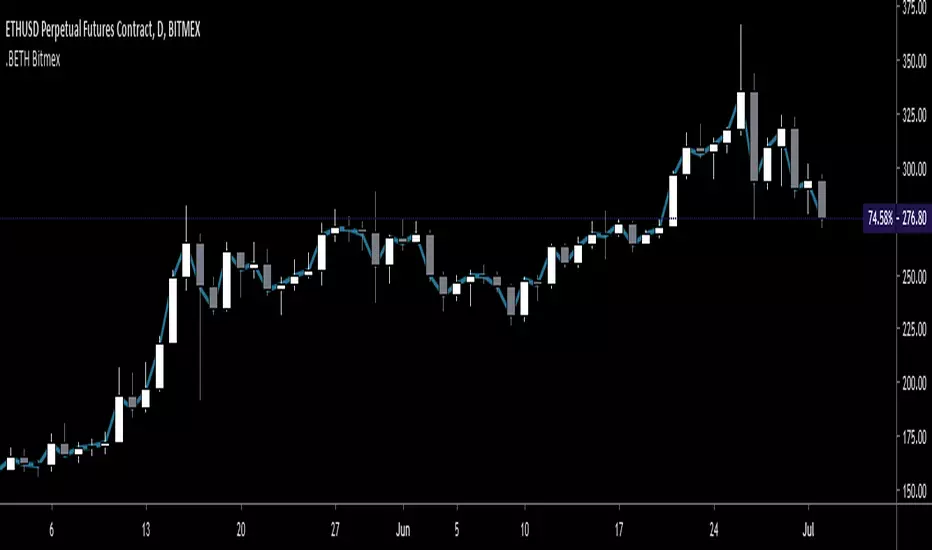
.BETH Ethereum Price Index - for BitMEX - Gyro.BETH script as seen on the BitMEX built-in chart.
This is not created by, authorized by or in any type of affiliation with BitMEX whatsoever.
This is not financial advice. Use at your own risk.
Tips are appreciated if you find this useful:
3BMEXty68scwEPfGGb4zkS23JdBCi3vtkh
See my other scripts for .BXBT!
Thanks