Multi EMA (up to 6) - JamilThis indicator plots six customizable Exponential Moving Averages (EMA 1 to EMA 6) designed to help traders quickly identify market direction, trend strength, and dynamic support/resistance levels.
🔹 Key Features
Plots six EMAs simultaneously for multi-timeframe trend clarity
Helps detect trend reversals, pullbacks, and continuation setups
Ideal for scalping, intraday, swing trading, and funded challenges
Works on all markets (Gold, Forex, Crypto, Indices)
Customizable lengths and colors
Clean and lightweight — doesn’t affect chart performance
🔹 How to Use
When all EMAs are aligned and fanning out → Strong Trend
EMA compression → Low volatility / possible breakout setup
Price above all EMAs → Bullish zone
Price below all EMAs → Bearish zone
Perfect for traders who want a simple yet powerful trend-reading tool.
Exponentialmovingaverage

The Trade Plan 9 & 15 EMA⭐ What Are EMAs?
An Exponential Moving Average (EMA) gives more weight to recent prices, making it more responsive than a simple moving average.
9-EMA = very fast, reacts quickly to price changes
15-EMA = slightly slower, smooths short-term noise
Together they help identify momentum shifts.
📈 How the 9/15 EMA Strategy Works
1. Buy Signal (Bullish Crossover)
You enter a long (buy) trade when:
➡ 9 EMA crosses above the 15 EMA
This suggests momentum is shifting upward and a new uptrend may be forming.
2. Sell Signal (Bearish Crossover)
You enter a short (sell) trade or exit long positions when:
➡ 9 EMA crosses below the 15 EMA
This suggests momentum is turning downward.
🔧 How Traders Typically Use It
Entry
Wait for a clear crossover.
Confirm with price closing on the same side of EMAs.
Some traders add confirmation using RSI, MACD, or support/resistance.
Exit
Several options:
Exit when the opposite crossover occurs.
Exit at predetermined risk-reward levels (e.g., 1:2).
Use trailing stop below/above EMAs.
👍 Strengths
Easy to follow
Good for fast-moving markets
Works well on trending markets
Minimal indicators needed
👎 Weaknesses
Whipsaws in sideways markets
Many false signals on very low timeframes
Works best with additional filters
🕒 Common Timeframes
Scalping: 1m, 5m
Day trading: 5m, 15m
Swing trading: 1H, 4H

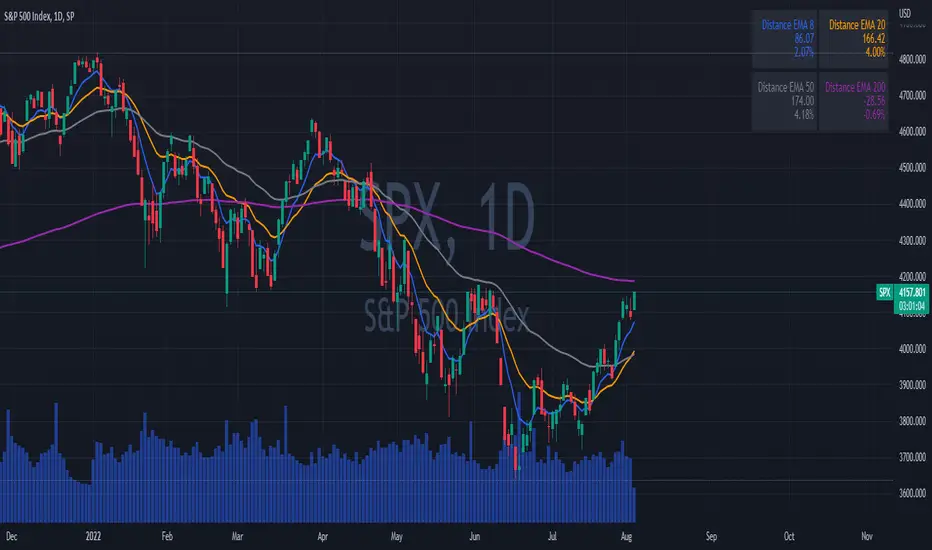
paigep.llc - SuperMA
SuperMA is a multi-layered moving-average and candle-coloring system that combines SMA, EMA, and optional HMA logic to help traders visualize trend shifts, pullbacks, and momentum changes in a clean, structured way.
The script includes multiple modules: trend-based moving averages, pullback signals, exit logic, and an optional HMA cross engine.
📌 Core Features
1. Full SMA + EMA Framework
The indicator plots multiple moving averages (8, 9, 13, 20, 50, 200) using both SMA and EMA calculations. Each line automatically colors bullish or bearish based on its relationship to the 200-period baseline. Users can toggle SMAs and EMAs independently for clearer chart control.
2. Main Trend Entry & Exit Logic (8×200 and 8×20)
Built-in crossover logic detects:
Main Entry: SMA 8 crossing above/below EMA 200
Main Exit: SMA 8 and SMA 20 cross (with an option to choose which SMA is treated as the “fast” leg)
A “first exit only” option allows the script to ignore additional exit signals until a new trend regime begins.
3. Pullback Module (20 SMA Interaction)
Pullback entries and exits occur when price crosses the 20 SMA during existing trend conditions.
This includes:
Pullback entries through the 20 SMA
Pullback exits back across the 20 SMA
Labels and candle colors are available for all pullback events.
4. Optional HMA Cross Module
A separate module allows traders to use two Hull Moving Averages (HMA) with customizable:
Lengths
Independent timeframes
Line colors
Cross-based entries and exits
This module has its own events, labels, and optional candle coloring.
5. Advanced Candle Coloring System
Candle coloring is layered in priority order, based on:
Main trend entries
Main exits
HMA entries
HMA exits
Pullback entries
Pullback exits
Trend-only candles (based on SMA 8 relative to EMA 200)
Users may also independently color wicks and borders.
6. Configurable Alerts (Fully Decoupled from Visuals)
Alerts are available for all major events, including:
Main Entries (8×200)
Main Exits (8×20)
Pullback Entries and Exits
HMA Entries and Exits
Bull or Bear Trend candles
Any colored candle event
Alerts can fire on bar close only or intrabar, depending on user preference.
Use Cases
SuperMA helps traders visualize:
Trend direction using SMA/EMA structure
Momentum shifts through HMA crosses
Pullback zones around the 20 SMA
Early regime transitions based on the 8×200 relationship
Candle-level context through color-coded bars
The indicator works across all markets and timeframes.
⚠️ Note
This tool is for visual and analytical assistance only. It does not guarantee future performance and should be combined with additional analysis and risk management.

Multi-Timeframe Multi-EMA StatusMultiple changeable EMAs and Timeframes to tell you if the stock price is above or below them. Can be used on any ticker where EMAs can be used.

[Pandora][Swarm] Rapid Exponential Moving AverageENVISIONING POSSIBILITY
What is the theoretical pinnacle of possibility? The current state of algorithmic affairs falls far short of my aspirations for achievable feasibility. I'm lifting the lid off of Pandora's box once again, very publicly this time, as a brute force challenge to conventional 'wisdom'. The unfolding series of time mandates a transcendental systemic alteration...
THE MOVING AVERAGE ZOO:
The realm of digital signal processing for trading is filled with familiar antiquated filtering tools. Two families of filtration, being 'infinite impulse response' (EMA, RMA, etc.) and 'finite impulse response' (WMA, SMA, etc.), are prevalently employed without question. These filter types are the mules and donkeys of data analysis, broadly accepted for use in finance.
At first glance, they appear sufficient for most tasks, offering a basic straightforward way to reduce noise and highlight trends. Yet, beneath their simplistic facade lies a constellation of limitations and impediments, each having its own finicky quirks. Upon closer inspection, identifiable drawbacks render them far from ideal for many real-world applications in today's volatile markets.
KNOWN FUNDAMENTAL FLAWS:
Despite commonplace moving average (MA) popularity, these conventional filters suffer from an assortment of fundamental flaws. Most of them don't genuinely address core challenges of how to preserve the true dynamics of a signal while suppressing noise and retaining cutoff frequency compliance. Their simple cookie cutter structures make them ill-suited in actuality for dynamic market environments. In reality, they often trade one problem for another dilemma, forsaking analytics to choose between distortion and delay.
A deeper seeded issue remains within frequency compliance, how adequately a filter respects (or disrespects) the underlying signal’s spectral properties according to it's assigned periodic parameter. Traditional MAs habitually distort phase relationships, causing delayed reactions with surplus lag or exaggerations with excessive undershoot/overshoot. For applications requiring timely resilience, such as algorithmic trading, these shortcomings are often functionally unacceptable. What’s needed is vigorous filters that can more accurately retain signal behaviors while minimizing lag without sacrificing smoothness and uniformity. Until then, the public MA zoo remains as a collection of corny compromises, rather than a favorable toolbelt of solutions.
P.S.: In PSv7+, in my opinion, many of these geriatric MAs deserve no future with ease of access for the naive, simply not knowing these filters are most likely creating bigger problems than solving any.
R.E.M.A.
What is this? I prefer to think of it as the "radical EMA", definitely along my lines of a retire everything morte algorithm. This isn't your run of the mill average from the petting zoo. I would categorize it as a paradigm shifting rampant economic masochistic annihilator, sufficiently good enough to begin ruthlessly executing moving averages left and right. Um, yeah... that kind of moving average destructor as you may soon recognize with a few 'Filters+' settings adjustments, realizing ordinary EMA has been doing us an injustice all this time.
Does it possess the capability to relentlessly exterminate most averaging filters in existence? Well, it's about time we find out, by uncaging it on the loose into the greater economic wilderness. Only then can we truly find out if it is indeed a radical exponential market accelerant whose time has come. If it is, then it may eventually become a reality erasing monolithic anomaly destined for greatness, ultimately changing the entire landscape of trading in perpetuity.
UNLEASHING NEXT-GEN:
This lone next generation exoweapon algorithm is intended to initiate the transformative beginning stages of mass filtration deprecation. However, it won't be the only one, just the first arrival of it's alien kind from me. Welcome to notion #1 of my future filtration frontier, on this episode of the algorithmic twilight zone. Where reality takes a twisting turn one dimension beyond practical logic, after persistent models of mindset disintegrate into insignificance, followed by illusory perception confronted into cognitive dissonance.
An evolutionary path to genuine advancement resides outside the prison of preconceptions, manifesting only after divergence from persistent binding restrictions of dogmatic doctrines. Such a genesis in transformative thinking will catalyze unbounded cognitive potential, plowing the way for the cultivation of total redesigns of thought. Futuristic innovative breakthroughs demand the surrender of legacy and outmoded understandings.
Now that the world's largest assembly of investors has been ensembled, there are additional tasks left to perform. I'm compelled to deploy this mathematical-weapon of mass financial creation into it's rightful destined hands, to "WE THE PEOPLE" of TV.
SCRIPT INTENTION:
Deprecate anything and everything as any non-commercial member sees desirably fit. This includes your existing code formulations already in working functional modes of operation AND/OR future projects in the works. Swapping is nearly as simple as copying and pasting with meager modifications, after you have identified comparable likeness in this indicators settings with a visual assessment. Results may become eye opening, but only if you dare to look and test.
Where you may suspect a ta.filter() is lacking sufficient luster or may be flat out majorly deficient, employing rema, drema, trema, or qrema configurations may be a more suitable replacement. That's up to you to discern. My code satire already identifies likely bottom of the barrel suspects that either belong in the extinction record or have already been marked for deprecation. They are ordered more towards the bottom by rank where they belong. SuperSmoother is a masterpiece here to stay, being my original go-to reference filter. Everything you see here is already deprecated, including REMA...
REMA CHARACTERISTICS
- VERY low lag
- No overshoot
- Frequency compliant
- Proper initialization at bar_index==0
- Period parameter accepts poitive floating point numerics (AND integers!)
- Infinite impulse response (IIR) filter
- Compact code footprint
- Minimized computational overhead

Moving Average Exponential (Daily Frozen EMA)This script plots an Exponential Moving Average (EMA) based on the daily timeframe, but with a unique twist:
✅ The EMA value is frozen for the entire current daily session, only updating when a new daily candle begins.
🔍 How it works:
The EMA is calculated using the 1-day timeframe, regardless of the chart's current timeframe.
This EMA value remains fixed throughout the day — it doesn't fluctuate intrabar.
It updates only once the daily candle has closed, providing a stable and reliable reference point during the trading day.
The default is the 5 day EMA but can be changed to any EMA timeframe you desire such as 9, 21, 50, 100. 200, etc.
✨ Additional Features:
✅ Optional smoothing with various moving average types (SMA, EMA, WMA, SMMA, VWMA).
✅ Optional Bollinger Bands on top of the smoothed EMA.
✅ Adjustable settings for EMA length, smoothing type, Bollinger Band deviation, and display options.
🛠️ Use Cases:
Ideal for traders who want a non-reactive EMA during intraday trading.
Helps reduce signal noise by anchoring EMA to higher timeframe structure.
Useful for strategy development where EMA should represent confirmed daily bias only.
Hope this helps, happy trading!

CLS Patterns + Price Action Levels📌 Key Features:
✅ CLS Candle Patterns Detection:
CLS Type 1 (Sweeps & Closes Opposite) – Confirms liquidity sweeps with opposite direction close.
CLS Type 2 (Sweeps but No Opposite Close) – Identifies liquidity traps without full reversal.
CLS Type 3 (Engulfing Candles) – Strong momentum shifts with engulfing price action.
CLS Type 4 (Order Block Reversals) – Institutional order flow recognition.
✅ Institutional & Price Action Levels:
250 Pip Institutional Levels – Major S&R zones for Forex & Indices.
Minor Quarter Points (25 Pips) – Intraday precision for refined entries.
✅ Liquidity Imbalance & Order Flow Gaps:
Detects early impulse moves & liquidity voids
Highlights areas of market inefficiency & potential reversals
✅ Higher Timeframe EMA for Trend Confirmation:
Customizable Weekly 3 EMA Overlay
Dynamic color change based on price action
✅ Built-in Alerts for CLS Patterns:
Real-time alerts for CLS buy/sell signals
Configurable notifications for trade execution
🎯 How to Use:
1️⃣ Enable CLS Pattern Signals to spot liquidity sweep candles with directional confirmation.
2️⃣ Use Institutional & QP Levels to identify key areas where price is likely to react.
3️⃣ Monitor Liquidity Imbalances to detect inefficient price moves that may fill.
4️⃣ Confirm Trend with HTF EMA to trade with momentum.
5️⃣ Set Alerts for CLS patterns and key price levels to stay ahead of the market.
This indicator is ideal for Forex, Indices, and Crypto traders looking to refine their entries with precise price action confirmations.

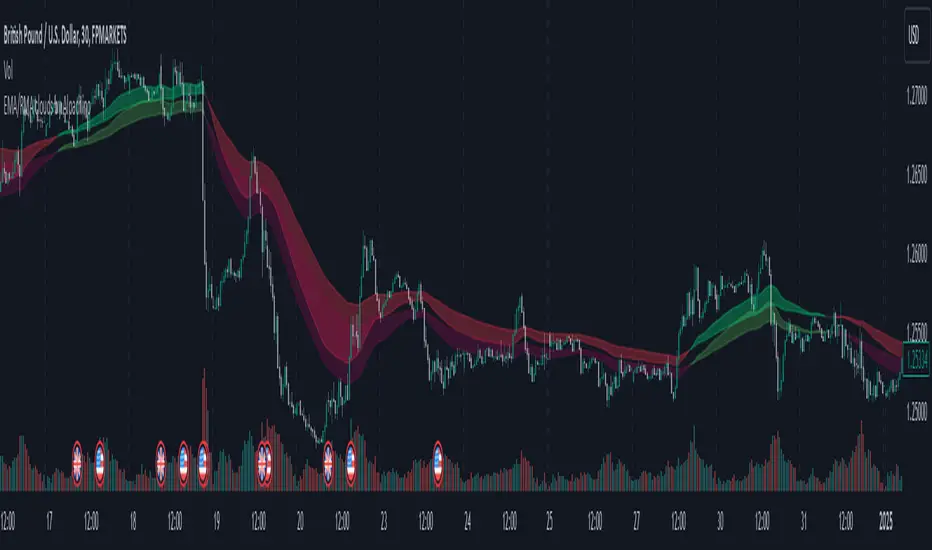
EMA/RMA clouds by AlpachinoRE-UPLOAD
The indicator is designed for faster trend determination and also provides hints about whether the trend is strong, weaker, or if a range is expected.
It consists of an exponential moving average (EMA) and a slower smoothed moving average (RMA). I chose these because EMA is the fastest and is respected by the market, while I discovered through practice that the market often respects RMA, and in some cases, even more than EMA. Their combination is necessary because I want to take advantage of the best qualities of both averages. Displaying averages based solely on the close values creates a simple line that the market might respect. However, this is often not the case. Market makers know that many traders still believe in the theory that closing above/below an EMA signals a valid new trend. They commonly apply this belief to EMA200. Traders think that if the market closes below EMA, it signals a downtrend. That’s not necessarily true. This misconception often traps inexperienced traders.
For this reason, my indicator does not include a separate line.
I use what are called envelopes. In other words, for both EMA and RMA, the calculation uses the high and low of the selected period, which can be chosen as an input in the indicator.
Why did I choose high and low?
To stabilize price fluctuations as much as possible, especially to allow enough space for the price to react to the moving average. This reaction occurs precisely between the high and low.
Modes:
EMA Cloud – This is the most common envelope in terms of averages. It shows the best reactions with a period of 50.
What should you observe: the alignment of the envelope or its slope.
Usage:
Breakouts through the entire envelope tend to be strong, which signals that the trend may change. However, what interests you most is that the first test of the envelope after a breakout is the most successful entry point for trades in the breakout direction.
In an uptrend, the first support will be the high of the envelope, and the second (let’s call it the "ultimate support") will be the low of the envelope.
If, during an uptrend, the market closes below the low, be cautious, as the trend may reverse.
If the envelope is broken, trade the retest of the envelope.
In general, if the price is above the envelope, focus on long trades; if it’s below the envelope, focus on short trades.
Double Cloud – Since we already know that highs and lows are more relevant for price respect, I utilized this in the double cloud. Here, I use calculations for EMA and RMA highs and EMA and RMA lows.
The core idea is that since the price often reacts more to RMA than EMA, I wanted to eliminate attempts by market makers to lure you into incorrect directions. By creating more space for the price to react to the highs or lows, I made the cloud fill the area between EMA and RMA highs. This serves as the last zone where the price can hold. If the price breaks above this high cloud during a return, this doesn’t happen randomly—you should pay attention, as it’s likely signaling a range or a trend change.
The same applies to the low cloud for EMA and RMA.
The advantage of the double cloud is that you can see two clouds that may move sideways. This can resemble two walls—and they really act as such.
Usage:
Let’s say we have a downtrend. The market seems to be experiencing a downtrend exhaustion. Here's the behavior you might observe:
The price returns to the EMA/RMA low; the first reaction may still have some strength, but each subsequent return will move higher and higher into the cloud with increasingly smaller rejections downward. This indicates the absorption of selling pressure by bullish pressure. Eventually, the price may close above the cloud, significantly disrupting the downtrend and potentially signaling a reversal.
A confirmation of the reversal is usually seen with a retest of the cloud and a bounce upward into an uptrend.
The second scenario, which you’ll often see, involves sharp and significant moves through both envelopes. This kind of move is the strongest signal of a trend change. However, do not jump into trades immediately—wait for the first retest, which is usually successful. Additional tests may not work, as the breakout might not signify a trend change but rather a range.
When the clouds are far apart, it signals a weak trend or that the market is in a range. You will see that this is generally true. When the clouds cross or overlap, their initial point of contact signals the start of a stronger trend. The steeper the slope, the stronger the trend.
Filtered MACD with Backtest [UAlgo]The "Filtered MACD with Backtest " indicator is an advanced trading tool designed for the TradingView platform. It combines the Moving Average Convergence Divergence (MACD) with additional filters such as Moving Average (MA) and Average Directional Index (ADX) to enhance trading signals. This indicator aims to provide more reliable entry and exit points by filtering out noise and confirming trends. Additionally, it includes a comprehensive backtesting module to simulate trading strategies and assess their performance based on historical data. The visual backtest module allows traders to see potential trades directly on the chart, making it easier to evaluate the effectiveness of the strategy.
🔶 Customizable Parameters :
Price Source Selection: Users can choose their preferred price source for calculations, providing flexibility in analysis.
Filter Parameters:
MA Filter: Option to use a Moving Average filter with types such as EMA, SMA, WMA, RMA, and VWMA, and a customizable length.
ADX Filter: Option to use an ADX filter with adjustable length and threshold to determine trend strength.
MACD Parameters: Customizable fast length, slow length, and signal smoothing for the MACD indicator.
Backtest Module:
Entry Type: Supports "Buy and Sell", "Buy", and "Sell" strategies.
Stop Loss Types: Choose from ATR-based, fixed point, or X bar high/low stop loss methods.
Reward to Risk Ratio: Set the desired take profit level relative to the stop loss.
Backtest Visuals: Display entry, stop loss, and take profit levels directly on the chart with
colored backgrounds.
Alerts: Configurable alerts for buy and sell signals.
🔶 Filtered MACD : Understanding How Filters Work with ADX and MA
ADX Filter:
The Average Directional Index (ADX) measures the strength of a trend. The script calculates ADX using the user-defined length and applies a threshold value.
Trading Signals with ADX Filter:
Buy Signal: A regular MACD buy signal (crossover of MACD line above the signal line) is only considered valid if the ADX is above the set threshold. This suggests a stronger uptrend to potentially capitalize on.
Sell Signal: Conversely, a regular MACD sell signal (crossunder of MACD line below the signal line) is only considered valid if the ADX is above the threshold, indicating a stronger downtrend for potential shorting opportunities.
Benefits: The ADX filter helps avoid whipsaws or false signals that might occur during choppy market conditions with weak trends.
MA Filter:
You can choose from various Moving Average (MA) types (EMA, SMA, WMA, RMA, VWMA) for the filter. The script calculates the chosen MA based on the user-defined length.
Trading Signals with MA Filter:
Buy Signal: A regular MACD buy signal is only considered valid if the closing price is above the MA value. This suggests a potential uptrend confirmed by the price action staying above the moving average.
Sell Signal: Conversely, a regular MACD sell signal is only considered valid if the closing price is below the MA value. This suggests a potential downtrend confirmed by the price action staying below the moving average.
Benefits: The MA filter helps identify potential trend continuation opportunities by ensuring the price aligns with the chosen moving average direction.
Combining Filters:
You can choose to use either the ADX filter, the MA filter, or both depending on your strategy preference. Using both filters adds an extra layer of confirmation for your signals.
🔶 Backtesting Module
The backtesting module in this script allows you to visually assess how the filtered MACD strategy would have performed on historical data. Here's a deeper dive into its features:
Backtesting Type: You can choose to backtest for buy signals only, sell signals only, or both. This allows you to analyze the strategy's effectiveness in different market conditions.
Stop-Loss Types: You can define how stop-loss orders are placed:
ATR (Average True Range): This uses a volatility measure (ATR) multiplied by a user-defined factor to set the stop-loss level.
Fixed Point: This allows you to specify a fixed dollar amount or percentage value as the stop-loss.
X bar High/Low: This sets the stop-loss at a certain number of bars (defined by the user) above/below the bar's high (for long positions) or low (for short positions).
Reward-to-Risk Ratio: Define the desired ratio between your potential profit and potential loss on each trade. The backtesting module will calculate take-profit levels based on this ratio and the stop-loss placement.
🔶 Disclaimer:
Use with Caution: This indicator is provided for educational and informational purposes only and should not be considered as financial advice. Users should exercise caution and perform their own analysis before making trading decisions based on the indicator's signals.
Not Financial Advice: The information provided by this indicator does not constitute financial advice, and the creator (UAlgo) shall not be held responsible for any trading losses incurred as a result of using this indicator.
Backtesting Recommended: Traders are encouraged to backtest the indicator thoroughly on historical data before using it in live trading to assess its performance and suitability for their trading strategies.
Risk Management: Trading involves inherent risks, and users should implement proper risk management strategies, including but not limited to stop-loss orders and position sizing, to mitigate potential losses.
No Guarantees: The accuracy and reliability of the indicator's signals cannot be guaranteed, as they are based on historical price data and past performance may not be indicative of future results.

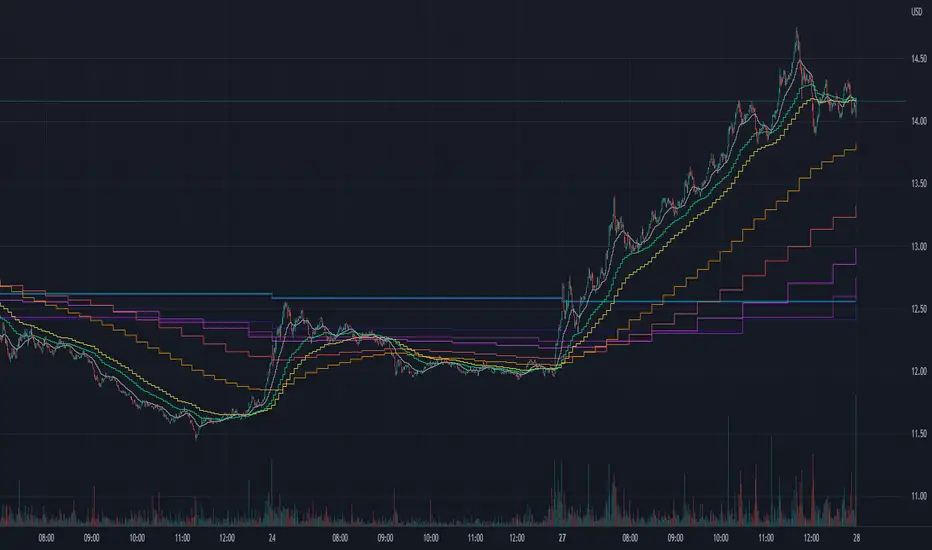
Daily TrendDescription:
The "Daily Trend" script is a powerful technical analysis tool designed for TradingView. This indicator helps traders identify key support and resistance levels based on daily price data. It offers a visual representation of these levels, along with other technical indicators like Exponential Moving Averages (EMA), Supertrend, and Parabolic SAR.
Features:
Past Candle Price Levels: This script calculates and displays past daily candle price levels, including R1, R2, R3, R4, S1, S2, S3, and S4. These levels are vital for identifying potential reversals and breakout points.
Exponential Moving Average (EMA): The script includes an EMA indicator with a customizable period to help traders spot the trend direction and potential crossovers.
Supertrend Indicator: The Supertrend indicator is used to identify trend changes. It plots the Supertrend line and highlights the trend direction with color-coded regions.
Parabolic SAR: The Parabolic SAR indicator is integrated into the script to assist traders in identifying potential entry and exit points in the market.
Customizable Alerts: Traders can customize the indicator by choosing which past candle price levels and other features to display on the chart.
How to Use:
Apply the "Daily Trend" script to your TradingView chart.
Customize the indicator by enabling or disabling specific features, such as past candle price levels and EMA.
Pay attention to the color-coded regions for Supertrend and Parabolic SAR to determine the current trend direction.
Look for potential reversal or bounce signals based on the indicator's signals and the price action.
Consider using this script in conjunction with your trading strategy for enhanced technical analysis.
Risk Warning: Trading involves significant risk, and past performance is not indicative of future results. Always practice proper risk management and consider the broader context of the market before making trading decisions.

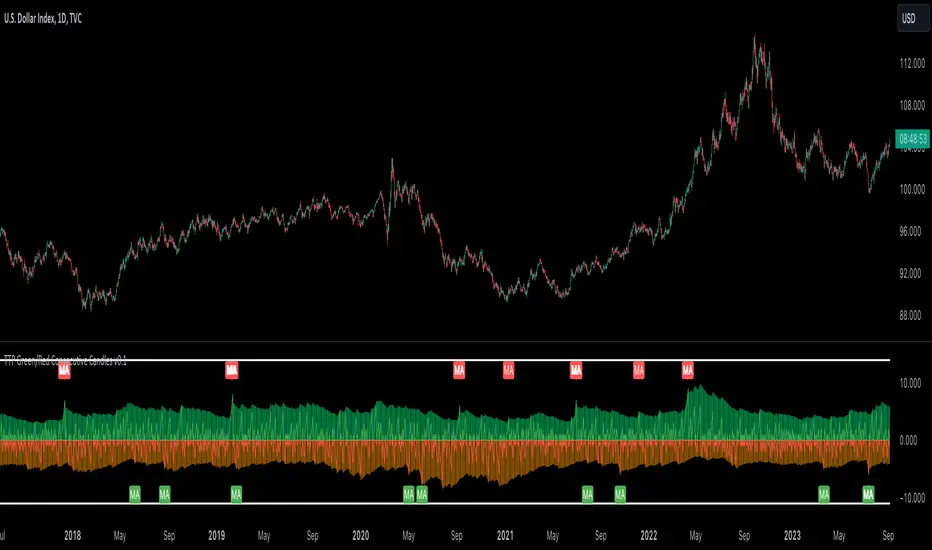
TTP Green/Red Consecutive CandlesThis indicator counts consecutive green/red candles offering some basic statistics and signals/alerts.
Features
- Counts consecutive green/red candles in an oscillator chart
- Moving average of the counting helps spotting when the consecutive candles are away from the mean. MA length and multiplier to adjust the signal sensitivity.
- Thresholds can be set to backtest and send alerts on any number of arbitrary consecutive candles of the same color.
- All time highs: the indicator keeps track of when the maximum has been reached
- Distribution data: the number of times each number of consecutive color candles has been reached is offered
Signals
- Threshold signal triggers when the number of candles of the same color is above the specified threshold.
- MA cross signal triggers when the number of candles of the same color is above the MA.
MultiMovesCombines 3 different moving averages together with the linear regression. The moving averages are the HMA, EMA, and SMA. The script makes use of two different lengths to allow the end user to utilize common crossovers in order to determine entry into a trade. The edge of each "cloud" is where each of the moving averages actually are. The bar color is the average of the shorter length combined moving averages.
-The Hull Moving Average (HMA), developed by Alan Hull, is an extremely fast and smooth moving average. In fact, the HMA almost eliminates lag altogether and manages to improve smoothing at the same time. A longer period HMA may be used to identify trend.
-The exponential moving average (EMA) is a technical chart indicator that tracks the price of an investment (like a stock or commodity) over time. The EMA is a type of weighted moving average (WMA) that gives more weighting or importance to recent price data.
-A simple moving average (SMA) is an arithmetic moving average calculated by adding recent prices and then dividing that figure by the number of time periods in the calculation average.
-The Linear Regression Indicator plots the ending value of a Linear Regression Line for a specified number of bars; showing, statistically, where the price is expected to be. Instead of plotting an average of past price action, it is plotting where a Linear Regression Line would expect the price to be, making the Linear Regression Indicator more responsive than a moving average.
The lighter colors = default 50 MA
The darker colors = default 200 MA

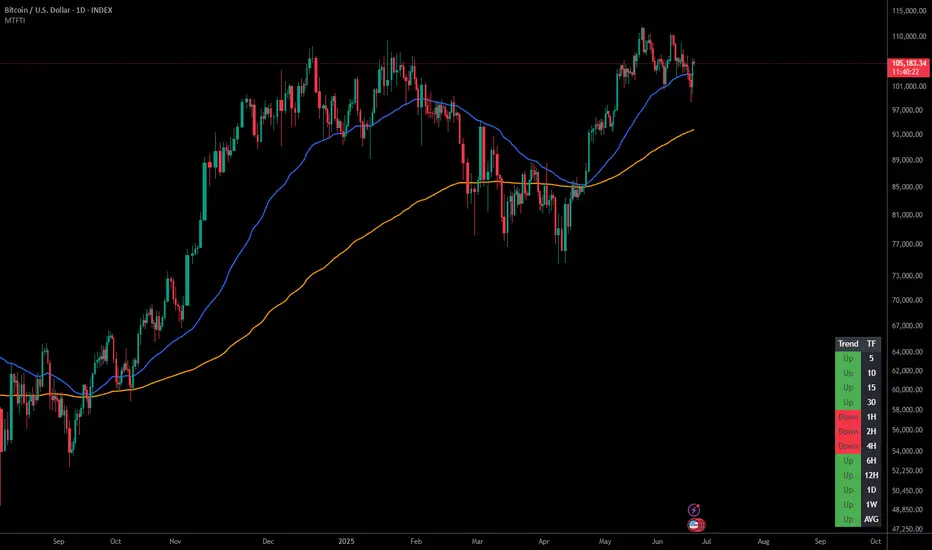
Multi-Timeframe Trend IndicatorThe Multi-Timeframe Trend Indicator (MTFTI) is a trend analysis tool designed to help traders quickly and easily assess the market direction across multiple timeframes. With the help of a table to visualize the trends on different timeframes.
Key features:
Multi-timeframe trend indicator for the following timeframes: 5 minutes, 15 minutes, 30 minutes, 1 hour, 2 hours, 4 hours, 6 hours, 12 hours, 1 day, and 1 week and average.
Displays trends for selected timeframes in a table.
Considers short and long-term exponential moving averages (EMAs) to determine trends.
Calculation of the average trend for all timeframes.
Display of trends with appropriate coloring for better readability (green for "Up", red for "Down", and intermediate shades for neutral or strong trends).
List of Parameters
Customization of the table's position on the screen (top-left, top-right, middle-left, middle-right, bottom-left, bottom-right).
Setting the lengths of the short and long-term exponential moving averages.
Option to activate or deactivate the display of EMAs for better customization (true by default).
Please note that the MTFTI is not a guarantee of future market performance and should be used in conjunction with proper risk management. Always ensure that you have a thorough understanding of the indicator’s methodology and its limitations before making any investment decisions. Additionally, past performance is not indicative of future results.
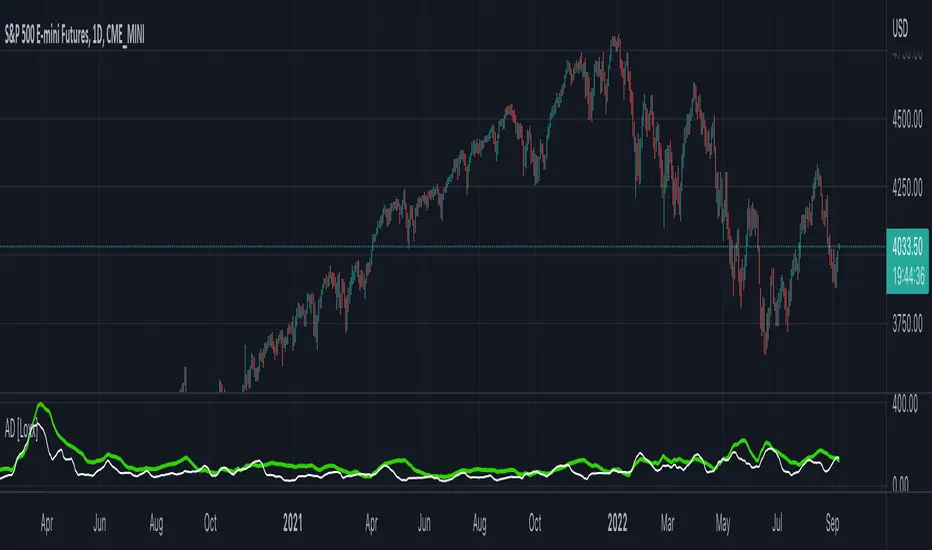
Adaptive Deviation [Loxx]Adaptive Deviation is an educational/conceptual indicator that is a new spin on the regular old standard deviation. By definition, the Standard Deviation (STD, also represented by the Greek letter sigma σ or the Latin letter s) is a measure that is used to quantify the amount of variation or dispersion of a set of data values. In technical analysis we usually use it to measure the level of current volatility.
Standard Deviation is based on Simple Moving Average calculation for mean value. This version of standard deviation uses the properties of EMA to calculate what can be called a new type of deviation, and since it is based on EMA, we can call it EMA deviation. And added to that, Perry Kaufman's efficiency ratio is used to make it adaptive (since all EMA type calculations are nearly perfect for adapting).
The difference when compared to standard is significant--not just because of EMA usage, but the efficiency ratio makes it a "bit more logical" in very volatile market conditions.
The green line is the Adaptive Deviation, the white line is regular Standard Deviation. This concept will be used in future indicators to further reduce noise and adapt to price volatility.
Included
Loxx's Expanded Source Types
Synthetic EMA Momentum w/ DSL [Loxx]Synthetic EMA Momentum w/ DSL is a momentum indicator that is calculated with 5 different EMAs of increasing period to derive a final momentum value. This helps reduce noise and improve signal quality. Discontinued signal lines are uses to calculate signal values.
What are DSL Discontinued Signal Line?
A lot of indicators are using signal lines in order to determine the trend (or some desired state of the indicator) easier. The idea of the signal line is easy : comparing the value to it's smoothed (slightly lagging) state, the idea of current momentum/state is made.
Discontinued signal line is inheriting that simple signal line idea and it is extending it : instead of having one signal line, more lines depending on the current value of the indicator.
"Signal" line is calculated the following way :
When a certain level is crossed into the desired direction, the EMA of that value is calculated for the desired signal line
When that level is crossed into the opposite direction, the previous "signal" line value is simply "inherited" and it becomes a kind of a level
This way it becomes a combination of signal lines and levels that are trying to combine both the good from both methods.
In simple terms, DSL uses the concept of a signal line and betters it by inheriting the previous signal line's value & makes it a level.
Included:
Loxx's Expanded Source Types
Alerts
Signals
Bar coloring
Related indicators
Smoother Momentum MACD w/ DSL
T3 Velocity

EMAs DistancesThis indicator shows 4 configurable EMAs and the distances (values and percentages) to the last price of the stock, etf or index.
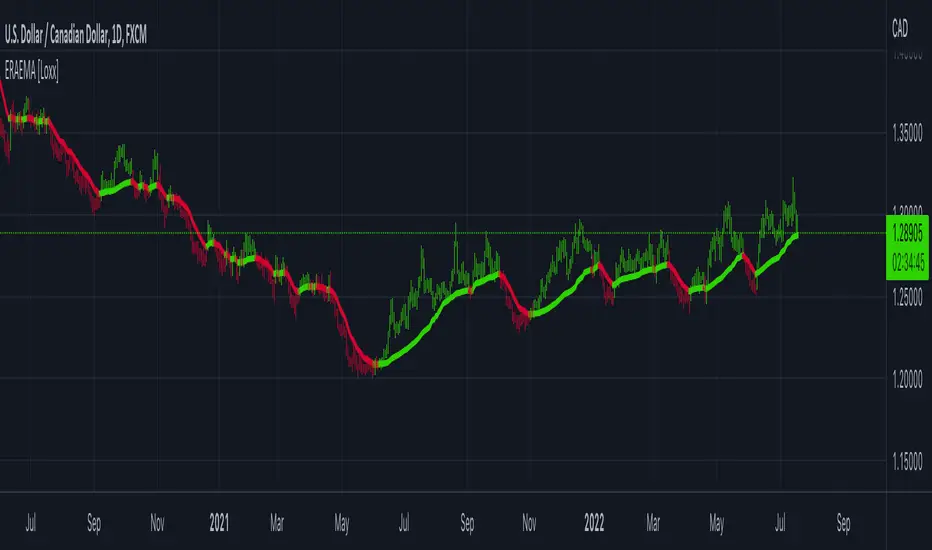
Efficiency-Ratio-Adaptive EMA [Loxx]Efficiency ratio was invented by Perry Kaufman as a measure of volatility and as a way of making some calculations adaptive. In his adaptive moving average he uses 3 periods for calculation which makes it a bit "cryptic" and, by all means, not so simple to use. This version is simplifying the whole thing without an intention to clone the KAMA indicator--but with the intention to use the efficiency ratio for adapting the average calculations and to use only two parameters for that:
period
price
Included:
Bar coloring
Multi-timeframe EMAThe Multi-timeframe exponential moving average (EMA) indicator visualizes EMAs from 1 minute to 1 quarter on a single chart using the request.security function. Standard and Fibonacci timeframes are available as well as the ability to hide high-timeframe EMAs to keep the chart clean. Cross-overs and arrangement of the EMAs indicate sentiment.
Much love to DumpCap! The script is presented sans secret sauce.
Fibonacci RibbonThe Fibonacci Ribbon (FibRib) creates two Fibonacci moving averages: essentially a Fibonacci WMA and a Fibonacci EMA.
The ribbon colors based on which is higher and where PA is relative to the ribbon.
Optional colored candles shades candles the same color as the ribbon.
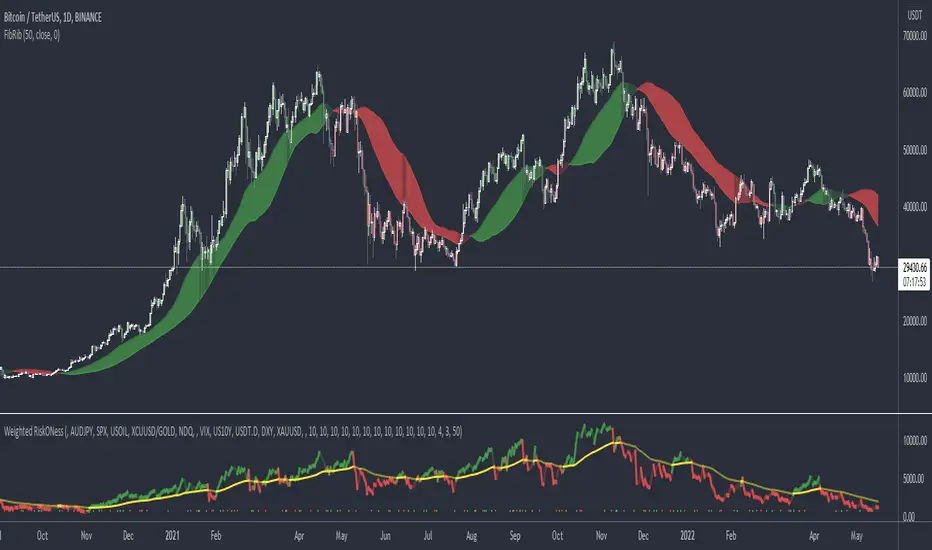
Relative Strength Volume Adjusted Exponential Moving Avg [CC]The Relative Strength Volume Adjusted Exponential Moving Average was created by Vitali Apirine (Stocks and Commodities Feb 2022 pgs 14-18) and this is very similar of course to the last Relative Strength Exponential Moving Average . It works under the same concept with using overbought and oversold methods to adjust the moving average and with this particular version you will notice that sudden drops or increases won't follow super closely so this can be useful along with the other as a good complementary indicator to use with each other to determine the short and medium term trend and to give good entry and exit points. I have strong buy and sell signals in addition to normal ones so darker colors are strong and lighter colors are normal. Buy when the indicator line turns green and sell when it turns red.
Let me know if there are any other indicators or scripts you would like to see me publish!
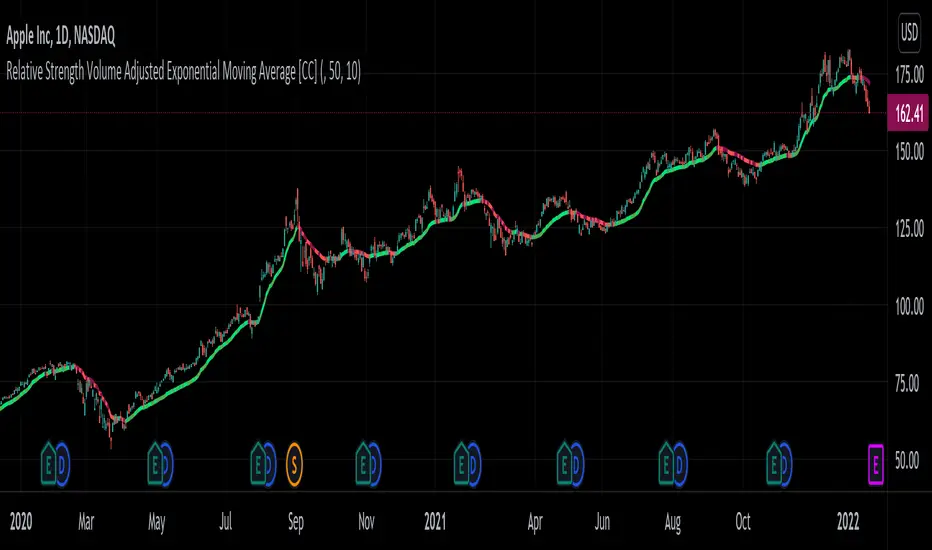
Relative Strength Exponential Moving Average [CC]The Relative Strength Exponential Moving Average was created by Vitali Apirine (Stocks and Commodities Jan 2022 pgs 22-25) and this is a handy moving average that combines a typical overbought/oversold mechanic with an overall trend indicator. Even though the typical length is so large it reacts extremely quickly when the stock becomes overbought or oversold. Because of this the indicator by itself doesn't work as well during choppy periods so Vitali recommends using a moving average crossover system during choppy so do one indicator with the default length of 50 and use a different length of 10 so when the shorter length crosses over the longer length then buy and vice versa you would sell. Generally speaking buy when the line turns green and sell when it turns red. I have used strong buy and sell signals in addition to normal signals so strong signals are darker in color and normal signals are lighter in color.
Let me know if there are any other scripts or indicators you would like me to publish!

EMA Index Cross by Hassonya
While the indicator is working on any stock chart, it shows the two ema average breakdown/breakup of the index or any other stock with an arrow. In this way, you will be able to follow the ema intersections of the index chart while working on a normal stock chart.
I will add other moving average options if you like it.
I hope you will be satisfied using it.
TURKISH
------------
Gösterge, herhangi bir hisse senedi grafiği üzerinde çalışırken, endeksin veya başka bir hisse senedinin iki ema ortalama dağılımını/dökülmesini bir okla gösterir.
Bu sayede normal bir hisse senedi grafiği üzerinde çalışırken endeks grafiğinin ema kesişimlerini takip edebileceksiniz.
Eğer beğenirseniz başka ortalama seçenekleri de ekleyeceğim.
Güle güle kullanın.

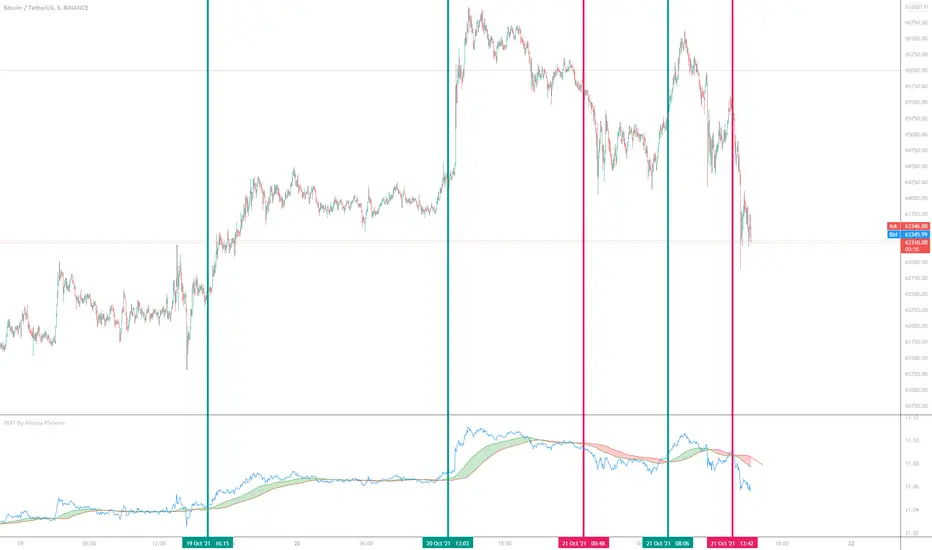
Price Movement Trend By Alireza Phoenix (Logarithmic)hi Traders
This logarithmic indicator shows the price movement trend, which is designed based on logarithmic functions and moving averages.
The Price Movement Trend Display Composed By :
A leading line consisting of the natural logarithm of Running Moving Average with length 60 and Offset 20 , and is displayed in red line.
A signal line consisting of a natural logarithm of an exponential moving average of length 90 , and is displayed in green line.
A price line consisting of the natural logarithm of a simple moving average along 1 whose source is price close , and is displayed in blue line.
A hidden price line consisting of the natural logarithm of a simple moving average along 1 and its source being the highest and lowest average prices , and is displayed in maroon line.
Learning how to get a signal from the price Movement trend indicator:
Moving the signal line and breaking the leading line upwards to form a green cloud is a buy signal.
Moving the signal line and breaking the leading line downwards that forms a red cloud is a sell signal.
Moving the price line and breaking the trend cloud upward , is a buy signal
Moving the price line and breaking the trend cloud downwards , is a sell signal
My instagram id : @pnxf6
ترجمه فارسی :
سلام تریدرها
این اندیکاتور لگاریتمی ، نمایش دهنده روند حرکتی قیمت است ، که بر اساس توابع لگاریتمی و میانگین های متحرک قیمت طراحی شده است
این اندیکاتور تشکیل شده از :
یک خط پیشرو متشکل از لگاریتم طبیعی متحرک وزنی نمایی مورد استفاده درآر اس آی به طول 60 و انحراف 20 است
یک خط سیگنال متشکل از لگاریتم طبیعی میانگین متحرک نمایی با طول 90
یک خط قیمت که متشکل از لگاریتم طبیعی میانگین متحرک ساده در طول 1 که منبع آن بسته شدن قیمت است.
یک خط قیمت مخفی که متشکل از لگاریتم طبیعی میانگین متحرک ساده در طول 1 و منبع آن میانگین بالاترین و پایین ترین قیمت است
یک فضای ابری مابین خط پیشرو و خط سیگنال که که با "نمایش روند حرکت قیمت" مشخص شده و در رنگ های سبز و قرمز قابل مشاهده میباشد.
آموزش گرفتن سیگنال ازاندیکاتور نمایش روند قیمت :
حرکت خط سیگنال و شکستن خط پیشرو رو به بالا که تشکیل ابر سبز رنگ میدهد یک سیگنال خرید میباشد .
حرکت خط سیگنال و شکستن خط پیشرو رو به پایین که تشکیل ابر قرمز رنگ میدهد یک سیگنال فروش میباشد .
حرکت خط قیمت و شکستن ابر روند حرکت قیمت رو به بالا سیگنال خرید میباشد
حرکت خط قیمت و شکستن ابر روند حرکت قیمت رو به پایین سیگنال فروش میباشد.