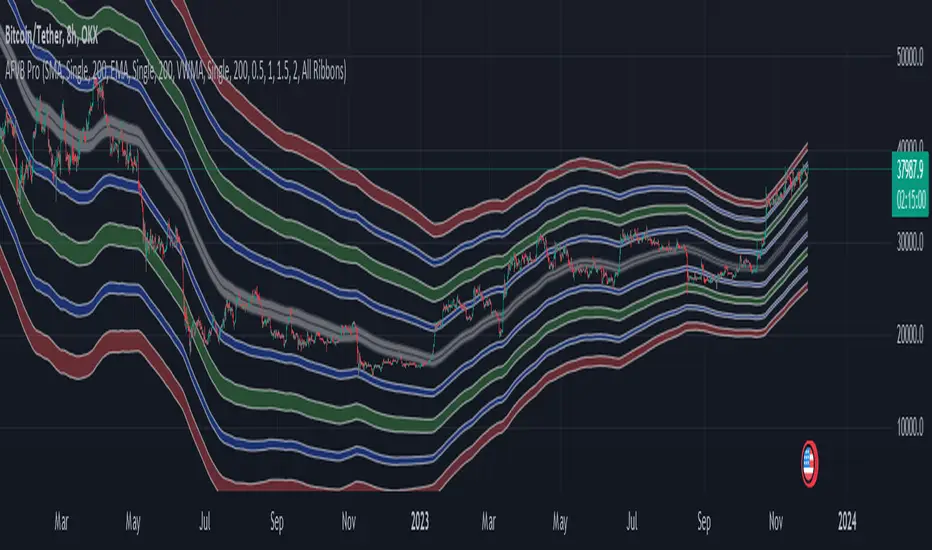
Apeiron Fair Value BandsThe Apeiron Fair Value Bands take into account a given MA and determine a Fair Value Area (FVA) for the price of a certain asset. The script plots a MA and a tolerance ribbon for it, as well as 2 bands (preset to 1 Standard deviations and 2 Standard deviations respectively, which can be manually changed) with a tolerance ribbon as well.
This creates 3 areas of interest:
The MA ribbon
The inside of the first upper and lower band (1 standard deviation) where price should stay within around 68% percent of the time according to the normal distribution
The inside of the second upper and lower band (2 standard deviations) where price should stay within around 95% percent of the time according to the normal distribution
Taking this into account, Fair Value analysis can be done:
Premium and Discount Prices: From a very simplistic point of view, when price is below a MA it can be considered to be at a discount and when it is above at a premium. Combining that idea with the levels given by the bands, we can determine if we are buying at premium or at a discount, specially on HTF and when considering investing, thus allowing to enter or exit the market with a higher probability of being on the right side of the trend and at a good level. As seen on the example, buying or selling at the highlighted levels would have been profitable with little drawdown.
VAH & VAL: (1 Standard Deviation Bands) Same as a Market Profile, price will stay in here "most" of the time. And particularly during ranging periods, they will provide potential revesal levels. As well, once prices breaks out of it, depending of the reaction to the second band, we can consider it a deviation or the beggining of a new trend. During strong trends, the bands can also serve as a correction support as the MA would do
New Fair Vaue Range: Once a new trend has begun, it will often slide on or break through Band 2, which can be interpreted as price creating a new Fair Value Range low or high. As seen on the chart, once price breaks out, those levels tend to be respected and relevant during corrections. I must make it very clear that this is just an analytical feature meant to be used in confluence with S/R, Supply & Demand, FVGs, Fibs or others. While it can be accurate sometimes, it might not be other times and be only "close".
Exhaustions: I call exhaustions to the scenarios when price keeps going up/down but it fails to keep pushing the fair value area with it. This indicates weakness in the trend and a potential reversal or correction. These appear on all Timeframes and symbols and are very good indications of tops and bottoms, specially after strong rallies or crashes. In the latter cases, waiting for price to re-enter it's FVA, provides great entries at the Bands levels.
Other features / Suggested Uses:
Middle levels: On the setup menu you can select different Standard deviation settings for each band including: 0.5, 1, 1.5, 2, 2.5 and 3. While the most relevant settings are 1 & 2, having their middle levels on the chart can provide extra levels for very tight ranges or just in general potential reversal levels.
Multi Timeframe & Multi symbol: The bands work on very low TF as well as High TF, though on HTF it might be limited by the MA length settings and the historical data of the symbol. It is important to note that each symbol and market type will have its own ideal MA and Bands settings.
Multi Bands Confluence: Same as you would use a short and long MA in a single setup, you can do the same with the bands and the confluence of levels can be very accurate.
Multi Timeframe Confluence: One of the best ways to use the bands so far is by using it in confluence with itself in other TFs, when price moves sharply into a confluent level given by multiple TFs, it is more likely for price to reverse there.
Most of the examples show a 200 SMA, but depending on what and how you are trading a shorter or longer MA might be a better fit for you. As well, if you are trading ranges, a VWMA might be much better, and if you are following a trend the EMA could be the better option.
I also want to make it clear that the bands can but are NOT meant to be a standalone indicator. They are meant to be used for confluence with other strategies, systems or indicators.
Fairvalue
Fair Value Gap (FVG) UnderlayBy analyzing the size and characteristics of candlestick patterns, the Fair Value Gap indicator helps traders spot potential opportunities where the price of a currency or financial asset deviates from its fair value. The FVG is represented as a percentage and displayed as columns in an underlay on the chart.
Calculation and Interpretation:
The calculation of the FVG involves evaluating the body-to-wick ratio of a candlestick. This ratio compares the size of the body (the difference between the open and close prices) to the length of the wicks (the high and low prices). A high body-to-wick ratio indicates a significant price move within the candlestick, potentially signaling a strong market sentiment. The FVG indicator compares the size of the current candlestick with the previous candlesticks over a specified lookback period, typically the last 20 to 40 candlesticks. If the current candlestick meets the criteria for a fair value gap, it is classified as either a Bearish FVG or Bullish FVG, depending on the direction of the price movement.
Interpreting the FVG is relatively straightforward. When a Bearish FVG is detected, it suggests that the price is currently lower than its fair value, indicating a potential upward price movement in the future. This could be an opportunity to consider long positions or buying opportunities. On the other hand, when a Bullish FVG is identified, it implies that the price is higher than its fair value, signaling a possible downward price correction. Traders may consider short-selling or taking profits on long positions in such scenarios.
Coloration:
The coloration of the Fair Value Gap (FVG) indicator plays a crucial role in enhancing its visual representation and aiding interpretation. When a Bearish FVG is identified, the indicator utilizes the color scheme of lime green. This color signifies the potential for an upward price movement as the current price is considered lower than its fair value. On the other hand, a Bullish FVG is represented by the vibrant color of fuchsia, indicating a potential downward price correction as the price exceeds its fair value. The coloration serves as a visual cue, making it easier for traders to quickly identify and differentiate between different types of fair value gaps on the chart. Additionally, the barcolor is aligned with the respective FVG color, providing a comprehensive view of price inefficiencies and aiding traders in their decision-making process.
Potential Applications/Strategies:
The FVG indicator can be applied in various trading strategies and situations. One possible application is in price reversion strategies. Traders can use the FVG to identify overbought or oversold conditions in the market. When a Bullish FVG occurs, it may indicate an opportunity to consider short-selling or taking profits on long positions. Similarly, a Bearish FVG can suggest a potential buying opportunity, expecting the price to revert back to its fair value.
Another application is in confirming existing trends. The FVG can act as a confirmation tool for trends identified by other indicators or analysis techniques. When a Bullish FVG aligns with an uptrend, it may strengthen the bullish bias and provide more confidence in the upward momentum. Conversely, a Bearish FVG in conjunction with a downtrend may reinforce the bearish sentiment and support the idea of further downside potential.
Parameters:
Adjusting the parameters of the FVG indicator can be beneficial based on the trader's trading style and time frame. The body-to-wick ratio threshold and lookback period can be modified to capture different types of fair value gaps and adapt to different market conditions. Shorter lookback periods may help identify more recent FVGs, which could be suitable for short-term traders, while longer periods may capture larger price inefficiencies and cater to longer-term traders.
Limitations:
However, it's important to note that the FVG indicator, like any technical analysis tool, has its limitations. It relies on historical price patterns and may not always accurately predict future price movements. The interpretation of FVGs requires careful analysis and should be used in conjunction with other indicators, technical analysis tools, and fundamental factors to make well-informed trading decisions. Traders should also exercise proper risk management and consider the overall market context when using the FVG indicator.
In conclusion, the Fair Value Gap (FVG) indicator provides traders with valuable insights into price inefficiencies and deviations from fair value. By identifying Bearish and Bullish FVGs, traders can potentially uncover trading opportunities and make more informed decisions. However, it is crucial to combine the FVG indicator with other analysis tools, conduct thorough analysis, and exercise proper risk management to achieve consistent trading success.

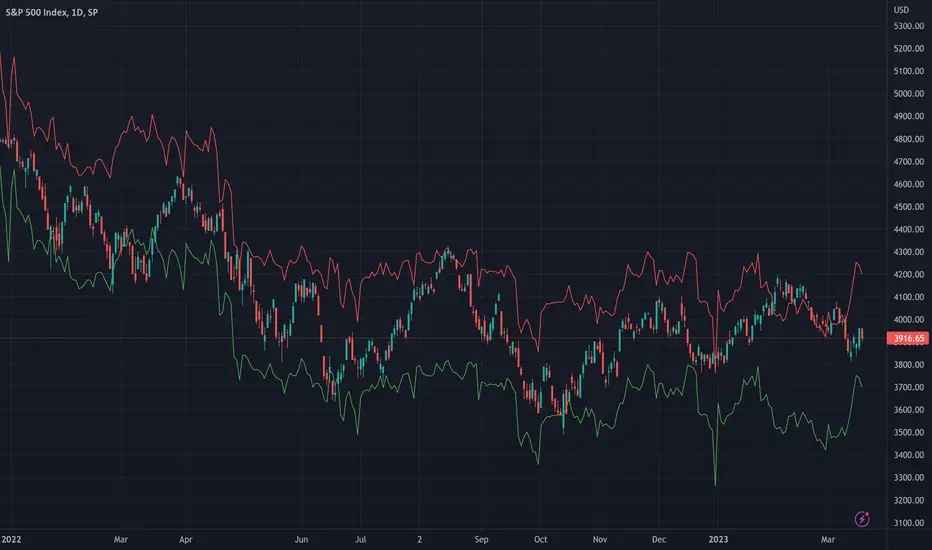
SPX Fair Value Bands WSHOSHOThis is a variation of the SPX Fair Value Bands indicator which uses WSHOSHO instead of WALCL.
WSHOSHO only includes the 'Securities Held Outright' portion of the Fed balance sheet. This effectively eliminates the portions related to BTFP (Bank Term Funding Program).
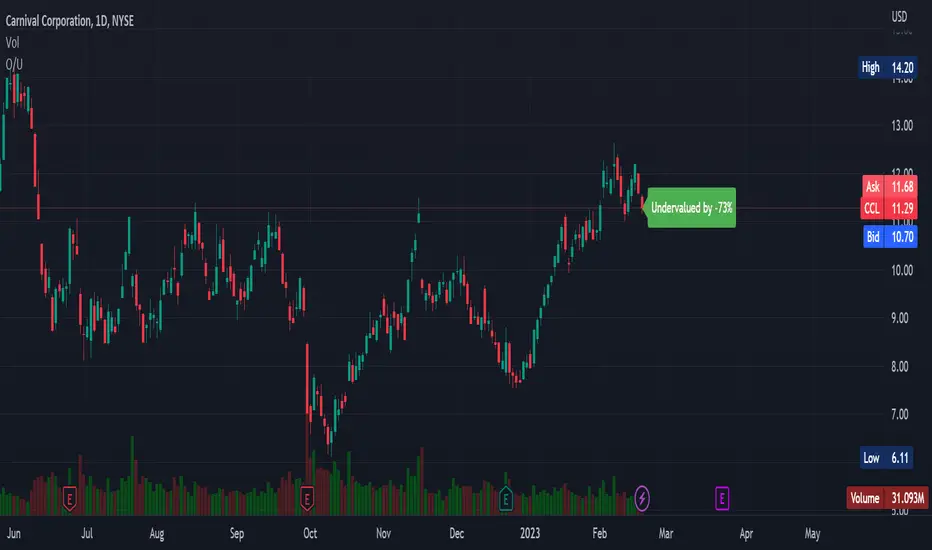
Overvalued/Undervalued OverlayThis indicator will tell you whether the security you are looking at is overvalued or undervalued using a company's total assets and their market cap. In theory, a company's total assets is everything that they own, which then should technically be how much the company is worth. Therefore, if the company's market cap is higher than their total assets, the indicator will read "Overvalued by X%". However, if the company's market cap is lower than their total assets, the indicator will read "Undervalued by X%". If you have any questions, feel free to let me know. Keep in mind that this indicator should be only used for long-term investing.
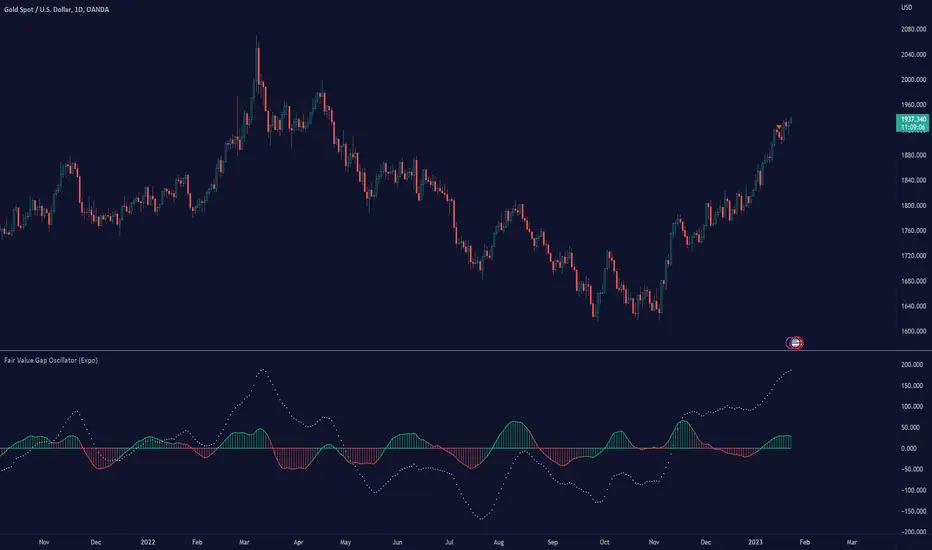
Fair Value Gap Oscillator (Expo)█ Overview
The Fair Value Gap Oscillator (Expo) is an indicator based on the concept of Fair Value Gaps. It is a momentum indicator that helps traders identify mispricings in the market over time. The indicator also incorporates volume and volatility to increase its accuracy further. The indicator can be used in both trending and range-bound markets.
FVG occurs when there is an insufficient amount of buyers and sellers in the market for a particular asset. This can cause a sudden and large gap in the asset price, creating an imbalance in the price. This gap can be large enough to prevent traders from entering the market to take advantage of the price discrepancy. This, in turn, leads to a lack of liquidity and further price volatility.
█ How is the Fair Value Gap Oscialltor calculated?
The Fair Value Gap Oscillator is calculated by using historical Fair Value Gapa, volume, and volatility to determine if the market is trading at a discount or premium relative to its historical fair value. It is based on the idea that prices move in fair value cycles and that by looking at the oscillations of FVG data over time, traders can get a deeper insight into how imbalances impact the price over time.
█ Oscillator Trading
Oscillators are technical indicators that are used to measure momentum within a given market. These indicators measure the speed and magnitude of price movements. Traders use oscillators to identify potential entry and exit points in the market. They may look for overbought and oversold conditions, or they may look for divergence between the price of an asset and its oscillator. When these signals are identified, traders can then enter or exit positions accordingly.
█ How to use
It is a momentum indicator that helps traders identify mispricings in the market over time. In addition, the FVG Oscialltor can be used to identify overbought and oversold conditions in the market, as well as trends and leading trend changes.
Trending Indicator
The Fair Value Gap Oscillator can also be used to identify trends in the market. By tracking the FVG over time, investors can identify whether the market is trending up or down.
Leading Indicator
This indicator can be used to identify leading changes in the market’s momentum and price action. It will indicate beforehand when the momentum decreases and a potential trend change is about to come.
Divergences
Leading Indicators are great for identifying divergences. This Fair Value Gap Oscillator is a powerful yet simple tool to spot divergences in the market.
It is important to remember that the Fair Value Gap Oscillator is just one tool in your investment toolbox. It should be used in conjunction with other smart money concept indicators to identify excellent trading opportunities.
█ Indicator Features
Trend FVG
A Trend FVG feature is added to help Trend Traders get a long-term overview of the FVG trend. This feature can be used for the leading FVG calculation to get a predictive FVG trend.
Leading FVG Calculation
The leading calculation makes the Fair Value Gap oscillator sensitive to fair value changes and becomes more leading.
Trend Line
The Trend line feature is a combination of the leading and the long-term trend that can be used as trend confirmation.
-----------------
Disclaimer
The information contained in my Scripts/Indicators/Ideas/Algos/Systems does not constitute financial advice or a solicitation to buy or sell any securities of any type. I will not accept liability for any loss or damage, including without limitation any loss of profit, which may arise directly or indirectly from the use of or reliance on such information.
All investments involve risk, and the past performance of a security, industry, sector, market, financial product, trading strategy, backtest, or individual's trading does not guarantee future results or returns. Investors are fully responsible for any investment decisions they make. Such decisions should be based solely on an evaluation of their financial circumstances, investment objectives, risk tolerance, and liquidity needs.
My Scripts/Indicators/Ideas/Algos/Systems are only for educational purposes!
Fair value bands / quantifytools— Overview
Fair value bands, like other band tools, depict dynamic points in price where price behaviour is normal or abnormal, i.e. trading at/around mean (price at fair value) or deviating from mean (price outside fair value). Unlike constantly readjusting standard deviation based bands, fair value bands are designed to be smooth and constant, based on typical historical deviations. The script calculates pivots that take place above/below fair value basis and forms median deviation bands based on this information. These points are then multiplied up to 3, representing more extreme deviations.
By default, the script uses OHLC4 and SMA 20 as basis for the bands. Users can form their preferred fair value basis using following options:
Price source
- Standard OHLC values
- HL2 (High + low / 2)
- OHLC4 (Open + high + low + close / 4)
- HLC3 (High + low + close / 3)
- HLCC4 (High + low + close + close / 4)
Smoothing
- SMA
- EMA
- HMA
- RMA
- WMA
- VWMA
- Median
Once fair value basis is established, some additional customization options can be employed:
Trend mode
Direction based
Cross based
Trend modes affect fair value basis color that indicates trend direction. Direction based trend considers only the direction of the defined fair value basis, i.e. pointing up is considered an uptrend, vice versa for downtrend. Cross based trends activate when selected source (same options as price source) crosses fair value basis. These sources can be set individually for uptrend/downtrend cross conditions. By default, the script uses cross based trend mode with low and high as sources.
Cross based (downtrend not triggered) vs. direction based (downtrend triggered):
Threshold band
Threshold band is calculated using typical deviations when price is trading at fair value basis. In other words, a little bit of "wiggle room" is added around the mean based on expected deviation. This feature is useful for cross based trends, as it allows filtering insignificant crosses that are more likely just noise. By default, threshold band is calculated based on 1x median deviation from mean. Users can increase/decrease threshold band width via input menu for more/less noise filtering, e.g. 2x threshold band width would require price to cross wiggle room that is 2x wider than typical, 0x erases threshold band altogether.
Deviation bands
Width of deviation bands by default is based on 1x median deviations and can be increased/decreased in a similar manner to threshold bands.
Each combination of customization options produces varying behaviour in the bands. To measure the behaviour and finding fairest representation of fair and unfair value, some data is gathered.
— Fair value metrics
Space between each band is considered a lot, named +3, +2, +1, -1, -2, -3. For each lot, time spent and volume relative to volume moving average (SMA 20) is recorded each time price is trading in a given lot:
Depending on the asset, timeframe and chosen fair value basis, shape of the distributions vary. However, practically always time is distributed in a normal bell curve shape, being highest at lots +1 to -1, gradually decreasing the further price is from the mean. This is hardly surprising, but it allows accurately determining dynamic areas of normal and abnormal price behaviour (i.e. low risk area between +1 and -1, high risk area between +-2 to +-3). Volume on the other hand is typically distributed the other way around, being lowest at lots +1 to -1 and highest at +-2 to +-3. When time and volume are distributed like so, we can conclude that 1) price being outside fair value is a rare event and 2) the more price is outside fair value, the more anomaly behaviour in volume we tend to find.
Viewing metric calculations
Metric calculation highlights can be enabled from the input menu, resulting in a lot based coloring and visibility of each lot counter (time, cumulative relative volume and average relative volume) in data window:
— Alerts
Available alerts are the following:
Individual
- High crossing deviation band (bands +1 to +3 )
- Low crossing deviation band (bands -1 to -3 )
- Low at threshold band in an uptrend
- High at threshold band in a downtrend
- New uptrend
- New downtrend
Grouped
- New uptrend or downtrend
- Deviation band cross (+1 or -1)
- Deviation band cross (+2 or -2)
- Deviation band cross (+3 or -3)
— Practical guide
Example #1 : Risk on/risk off trend following
Ideal trend stays inside fair value and provides sufficient cool offs between the moves. When this is the case, fair value bands can be used for sensible entry/exit levels within the trend.
Example #2 : Mean reversions
When price shows exuberance into an extreme deviation, followed by a stall and signs of exhaustion (wicks), an opportunity for mean reversion emerges. The higher the deviation, the more volatility in the move, the more signalling of exhaustion, the better.
Example #3 : Tweaking bands for desired behaviour
The faster the length of fair value basis, the more momentum price needs to hit extreme deviation levels, as bands too are moving faster alongside price. Decreasing fair value basis length typically leads to more quick and aggressive deviations and less steady trends outside fair value.

Fair Value Gap [LuxAlgo]Fair value gaps (FVG) highlight imbalances areas between market participants and have become popular amongst technical analysts. The following script aims to display fair value gaps alongside the percentage of filled gaps and the average duration (in bars) before gaps are filled.
Users can be alerted when an FVG is filled using the alerts built into this script.
🔶 USAGE
In practice, FVG's highlight areas of support (bullish FVG) and resistances (bearish FVG). Once a gap is filled, suggesting the end of the imbalance, we can expect the price to reverse.
This approach is more contrarian in nature, users wishing to use a more trend-following approach can use the identification of FVG as direct signals, going long with the identification of a bullish FVG, and short with a bearish FVG.
🔹 Mitigation
By default, the script highlights the areas of only unmitigated FVG's. Users can however highlight the mitigation level of mitigated FVG's, that is the lower extremity of bullish FVG's and the upper extremity of bearish FVG's.
The user can track the evolution of a mitigated FVG's using the "Dynamic" setting.
🔹 Threshold
The gap height can be used to determine the degree of imbalance between buying and selling market participants. Users can filter fair value gaps based on the gap height using the "Threshold %" setting. Using the "Auto" will make use of an automatic threshold, only keeping more volatile FVG's.
🔶 DETAILS
We use the following rules for detecting FVG's in this script:
Bullish FVG
low > high(t-2)
close(t-1) > high(t-2)
(low - high(t-2)) / high(t-2) > threshold
Upper Bullish FVG = low
Lower Bullish FVG = high(t-2)
Bearish FVG
high < low(t-2)
close(t-1) < low(t-2)
(low(t-2) - high) / high < -threshold
Upper Bearish FVG = low(t-2)
Lower Bearish FVG = high
🔶 SETTINGS
Threshold %: Threshold percentage used to filter our FVG's based on their height.
Auto Threshold: Use the cumulative mean of relative FVG heights as threshold.
Unmitigatted Levels: Extent the mitigation level of the number of unmitigated FVG's set by the user.
Mitigation Levels: Show the mitigation levels of mitigated FVG's.
Timeframe : Timeframe of the price data used to detect FVG's.

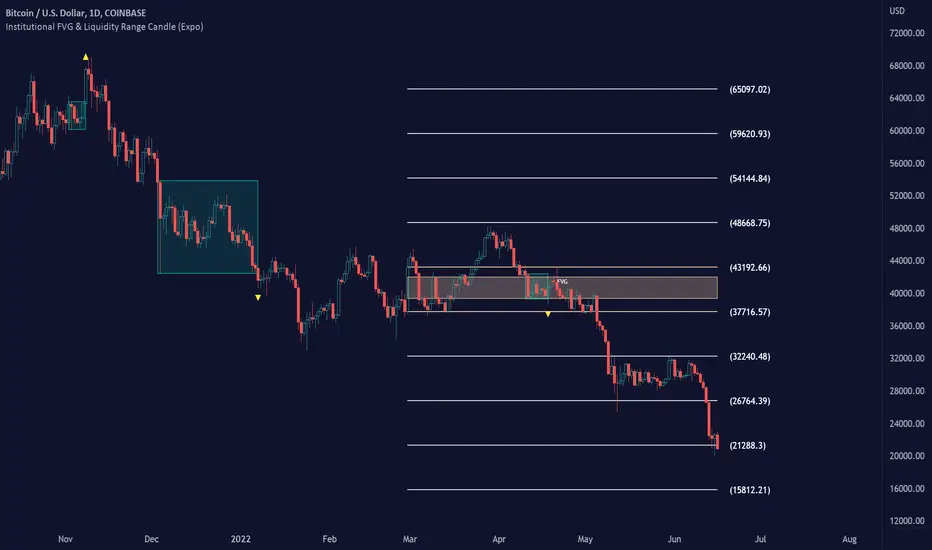
Institutional FVG & Liquidity Range Candle (Expo)█ Institutional FVG with predicted SR levels & Liquidity Range Candle is an indicator that uses Smart Money Concepts to give you the insights needed to make informed decisions based on the theory in SMC. This premium toolkit work in any market and timeframe.
█ Institutional Fair Value Gap , also known as imbalance, inefficiencies, and Liquidity void, identifies the most significant FVG within the lookback period. This is often referred to as Institutional Fair Value Gap since only big players can cause these liquidity voids.
Fair Value Gap, Liquidity voids are sudden price changes without enough liquidity at a stable price, and the price jumps from the originating price level to the final price level, creating an imbalance in price.
The price tends to fill or retest the FVG area, and traders understand at which price level institutional players have been active. FVG is a valuable concept in trading, as they provide insights about where many orders were injected, creating this inefficiency in the market. The price tends to restore the balance.
This indicator highlights the most significant Fair Value Gap on the chart and plots predicted future support and resistance levels based on the price action created at the FVG. A super simple and yet effective way to get solid market levels that acts as a magnet for the price.
█ Liquidity Range Candle is another trading concept used by large market players where they manipulate the price to stay inside a specific market area, creating a tight consolidation zone. Once the price breaks the liquidity range, liquidity flows into the market. It's an easy way to grab liquidity from retail traders. Stop losses are triggers, breakout traders jump into the market, and institutional traders absorb the liquidity.
If you don't see the liquidity, you become the liquidity!
A break of a liquidity range is a sign of a breakout, potential continuation, retracement, or reversal. Use it together with an overall market analysis. It's common that traders also mark the previous 1-3 liquidity ranges and plot them into the future. These zones can act as a future magnet for the price, and we can get a retest of the zones, or if we break above/below a previous range can be a sign of a trend change. We also know that these liquidity ranges have been important levels for institutional players, who may be willing to accumulate or distribute more orders at these levels.
█ HOW TO USE
Use the indicator to identify several important and commonly used trading concepts taught within the SMC.
Find Significant FVG
Find Significant liquidity ranges
-----------------
Disclaimer
Copyright by Zeiierman.
The information contained in my Scripts/Indicators/Ideas/Algos/Systems does not constitute financial advice or a solicitation to buy or sell any securities of any type. I will not accept liability for any loss or damage, including without limitation any loss of profit, which may arise directly or indirectly from the use of or reliance on such information.
All investments involve risk, and the past performance of a security, industry, sector, market, financial product, trading strategy, backtest, or individual’s trading does not guarantee future results or returns. Investors are fully responsible for any investment decisions they make. Such decisions should be based solely on an evaluation of their financial circumstances, investment objectives, risk tolerance, and liquidity needs.
My Scripts/Indicators/Ideas/Algos/Systems are only for educational purposes!
OGT Intrinsic Value IndicatorOGT Intrinsic Value Indicator
This indicator will show you visually the intrinsic value of a stock. Intrinsic value aims to measure of what an asset is worth. There are a number of intrinsic valuation models where this TradingView indicator uses an earnings valuation model.
There are 4 inputs to the model:
1) EPS trailing 12 months (ttm) - the first step is to know what the current EPS is for a stock. The indicator calculates this for you
2) Annual EPS Growth Next 5 Years - You need to input what you think the annual growth rate is going to be for the stock. You can use you annual estimates which you can obtain by searching "stock name - eps growth forecast"
3) Earnings Multiple (PE Ratio) - The next step is to input the earnings multiple in year 5. You can get this from analyst estimates or looking at the average PE ratio of the asset over the past 3 / 5 / 10 years.
4) Desired Rate Of Return - The last input is your rate of return. I personally use 12.5% as you can invest in an S&P ETF and get 8-10% return. So I prefer a higher rate of return for the risk I am taking.
You will need to input your low, medium and high assumptions so you can see the different price ranges.

Fair Value Gap█ OVERVIEW
This indicator displays the Fair Value Gap of the current timeframe and an additional higher timeframe. For each FVG the gaps act as targets creating bullish and bearish gaps that are often filled.
█ FEATURES
MTF Options
MidPoint FIll
Delete Old On Fill
Label FVG Timeframe
MTF Options
Enabling the MTF Options will allow the user to use the "MTF Timeframe" setting to choose what HTF Fair Value Gap to display
MidPoint FIll
A line plot at the Half way point will be included in the Fair Value Gap, this will be used to delete the gap when reached instead of a full fill.
Delete Old On Fill
Deletes historical Fair Value Gaps when filled.
Label FVG Timeframe
Labels Every Fair Value gap with there relevant timeframe to make it easier to determine which gap is being filled.
█ HOW TO USE IT
The indicator is quite straight forward in its application, providing users with targets that are often filled as they are seen as market imbalance.
Just applying it to your chart will provide the existing Fair Value Gaps. MTF Confluence is helpful in seeing what is happening on the macro perspective.
█ SUGGESTION
My suggestion for clarity is to use a different color to some degree between the MTF and Current TF as Opposed to text, keeps the chart clear.
█ LIMITATIONS OF PINE (Please read)
I see many users going on different indicators with MTF in mind and trying to use it for LTF data e.g. 1hour chart, and selecting 5min in chart settings.
This is not recommended by the team themselves and should be noted for use always use HTF: www.tradingview.com
To understand how to use fair value gaps I recommend learning about the subject some more, searching online will provide you resources. The internet is your friend when learning. All the best.

Silen's Financials Fair ValueIt is finally here! 🔥 My 3rd and most important script in my Financial series! 🚀
Ever imagined to see all fundamentals (or many that is) combined into one indicator that is right on your chart, showing you how your favorite stock is trading compared to its fundamentals?
Well, here is your answer! 📡
____________________________________________________________________________________________
This script shows you my own personal interpretation of fair value, based solely on the financial fundamentals of a company compared to market averages.
I don't believe that certain sectors of the market should be priced higher than others. If you look at historical data you'll see that favored sectors always rotate - placing insanely high P/E multiples on some sectors. Once they are "out" and people rotate away from those sectors you're left with nothing but the naked fundamentals that matter. So, you'll see many companies, that have been doing well on paper, see their share price decline by 70-90% for no other reasons than people favoring other sectors.
That's why it's even more important to focus on fair value that is solely fundamentals-based. Know when your stock gets to expensive. 🤯
____________________________________________________________________________________________
To give you some examples:
- Most Megacaps trade at historically high valuations, several times my fair value. Those include AAPL, MSFT, NVDA, AMZN, TSLA, JPM, TSM, V and so on. And no, in the past they partially traded below (my) fair value.
- Most Cybersecurity / Cloud companies are trading at truly massive multiples of my fair value. (NET, DDOG, etc)
- Many Smallcaps & Midcaps are trading several multiples (OESX, CODX, QFIN) below my fair value. And no, in the past they partially traded above (my) fair value.
Ok, so much about the market. You ultimately decide how much you want to orientate on fair value. 👨🏫
____________________________________________________________________________________________
This fair value indicator (purple line):
Takes the P/E rate of the company and compares it to the market (50% weight)
Takes the P/S rate of the company and compares it to the market (50% weight)
Then adds boni and mali f or debt/equity rates and debt and equity itself
Also looks at past growth and calculates future P/E and P/S rates which adds , in some cases, value to the fair value (green line)
Also compares how historical valuations have behaved compared to fair value and simulates a fair value guideline (dark blue line)
____________________________________________________________________________________________
This script is part 3️⃣ of a series of indicators that work well together.
Script 1️⃣ of the series is:
P/E & P/S Rates
Script 2️⃣ of the series is:
Debt & Equity
If you use all 3 scripts together it will look like this, giving you truly deep and simple information about the fundamentals of a company:
Example 1 - AMD
Example 2 - HZO
Example 3 - APPS
I hope this script makes your investing and stock picks a lot easier! 🔆💹🕗
Disclaimer: Fair value is always subjective. There are many different approaches to fair value. This one is only my personal interpretation.
Disclaimer 2: This script works only for the Day-Timeframe.
Disclaimer 3: This script uses 17,5 P/E and 3,0 P/S as market averages. The actual average keeps changing but, historically speaking, these seemed to be good numbers.
Feel free to share your thoughts and feedback! 🙃

Stock Fair Value (SFV)Stock Fair Value (SFV) is an indicator that displays an estimated fair value per share price for the business. It uses fundamental data including future consensus earnings estimates from Wall Street analysts, how fast the business is growing, and the balance sheet to come up with a number that approximates what a fair price would be to pay for the stock. In the top right hand corner of the Indicator is a highlighted box showing the % difference from the current price and the Fair Value price, if the box is green it means the stock is currently undervalued by that much % below the Fair Value price, if the box is red it means the stock is currently overvalued by that much % above the Fair Value price.
The indicator formula also uses the current market price as an input, as there is information about the business baked into the current stock price that isn't apparent in fundamental data that I believe deserves to affect the fair value price. This indicator uses my own unique formula, it is not a standard Discounted Cash flow (DCF) model nor is it based on any other published valuation formula or model. As this indicator uses fundamental data there isn't any changeable settings for the user.
This indicator is designed for stocks only and isn't applicable on other markets like forex, futures or crypto. It can be used on the daily, weekly or monthly time frames as the value doesn't change. It's designed to be part of an overall investment process for stock investors with medium to long term timeframes, it's not suited for short term trading like most valuation strategies.
Please note like any indicator it's not perfect as there's only so much input that can go into it, therefore use it as a rough guide as to what the fair value of a stock could be, there are of course many other factors that can and will affect what a fair price of a business should be. As value investors, we ideally want to buy safe quality growing businesses that are at least 30% below fair value then hold them until the stock trades back up to fair value or above. This indicator can help with what all value investors are trying to do, that is buy low and sell high. It can also be used to avoid expensive stocks as they may have more downside risk with less upside potential.
If you see the Stock Fair Value price make a drastic and significant move overnight that's because some new fundamental data has come into the system, it could be new consensus earnings estimates or a change in business growth rates that causes a sudden and significant shift in the calculated fair value.
As you can see from the chart above of Alibaba NYSE:BABA the Stock Fair Value indicator is showing a current reading of $385.12 per share. At the current date of this writing, 11th January 2021, the current price of BABA is $132.19 which is 65.68% below the Stock Fair Value price of $385.12 and makes this stock one of the most undervalued large cap stocks listed on the New York Stock Exchange according to this indicator.
It's also worth noting that Charlie Munger, Vice Chairman of Berkshire Hathaway NYSE:BRK.B and long term business partner of Warren Buffett, has recently been accumulating a large position in NYSE:BABA which as a lifelong devotee of value investing suggests he sees great value in Alibaba at current prices just as the Stock Fair Value Indicator is suggesting too.
Other examples of large cap stocks that are currently significantly undervalued according to this indicator are;
AT&T NYSE:T (40.72% undervalued)
Citigroup NYSE:C (51.97% undervalued)
Fedex NYSE:FDX (41.94% undervalued)
To get access to this indicator PM or email me to my address shown below.
Enjoy :)
Disclaimer: All my scripts and content are for educational purposes only. I'm not a financial advisor and do not give personal finance advice. Past performance is no guarantee of future performance. Please trade at your own risk.

[astropark] Fair Value GapsDear Followers,
today a new epic tool, the "Fair Value Gap (FVG) Finder" .
Fair Value Gaps are quite important to trade, as they represent both volume and trading unfilled gaps, which most of the time are filled and then price reverse .
This indicator will let you set alerts on when a new FVG is found and when it is filled.
Traded together with Breaker Blocks (BB) and Supply/Demand Order Blocks (OB) , you can easily spot important points where to start a short or a long trade.
Here my Breaker Blocks (BB) and Supply/Demand Order Blocks (OB) indicator
Here below some examples on how to use the indicator.
On Bitcoin
On EURUSD

Bitcoin Energy Value OscillatorBitcoin Energy Value as an oscillator against price.
Calculated as: (Bitcoin Price / Bitcoin Energy Value - 1) * 100

Metcalfes Law - Bitcoin Fair PriceMetcalfe's Law has been successfully used to value a variety of network effect technologies and businesses, including Facebook and Tencent.
Applying Metcalfe's Law to Bitcoin, using "Daily Active Addresses" (DAA) as the "n" value, yields interesting results.
Historically, Bitcoin has tracked the Metcalfe Law Fair Price reasonably well. A number of studies have been performed over recent years which validate this and have used various derivations of Metcalfe’s Law. Note: this indicator sticks to the original Metcalf’s Law.
Prior to 2018, every time Bitcoin was above the Metcalfe’s Law fair price (calculated using a default “A” of 0.5 here), a bubble had formed, and price quickly reverted back down to the mean.
Nonetheless, since February 2018, Metcalfe's Law Fair Price has remained below the actual Bitcoin price, suggesting Bitcoin is currently overvalued.
There may be a few reasons for this:
1. Possibility A: Bitcoin may still be extremely overvalued. Since the December 2017 peak, Bitcoin has only reverted to the Metcalfe’s Law Fair Price briefly during the December 2018 bottom. If this case is true, there could be further to fall unless DAA numbers pick up to fill the gap.
2. Possibility B: The introduction of side-chains, private transactions and the Lightning Network may have fundamentally altered the effectiveness of using DAA to value Bitcoin. As more daily transactions are completed off-chain, or on large platforms/exchanges which use fewer addresses, the relative number and growth of DAA may be misrepresented and artificially low. In this case, DAA as it is reported today is no longer useful in assessing the fair value of Bitcoin with Metcalfe’s Law and this Indicator is effectively useless.
3. Possibility C: Neither of the above are true. We are just in an anomalous period in which price and Metcalfe’s Law Fair Price have deviated from the mean for an extended period (and will meet again in the future, potentially at a higher price).
4. Possibility D: Metcalfe’s Law doesn’t really work for Bitcoin.
I am inclined to believe Possibilities “C” and “D” are unlikely. Given the way Bitcoin infrastructure is being developed and used in 2019, Possibility “B” seems the most likely, as this case is supported by the fact that a number of other metrics indicate that Bitcoin is currently on the lower side of “fair value” (including Dynamic Range NVT Signal).
Regardless, Possibility “A” remains a strong candidate. Only time will tell. It will be interesting to check back on this indicator in 12-24 months time. Hopefully this indicator has been proven redundant by then.
