Fear Greed zones and Money Waves FusedThis indicator, named "Fear Greed zones and Money Waves" combines a smoothed Money Flow Index (MFI)-based wave and the Relative Strength Index (RSI) to visualize market sentiment through fear and greed zones and generate buy/sell signals.
Core Functions
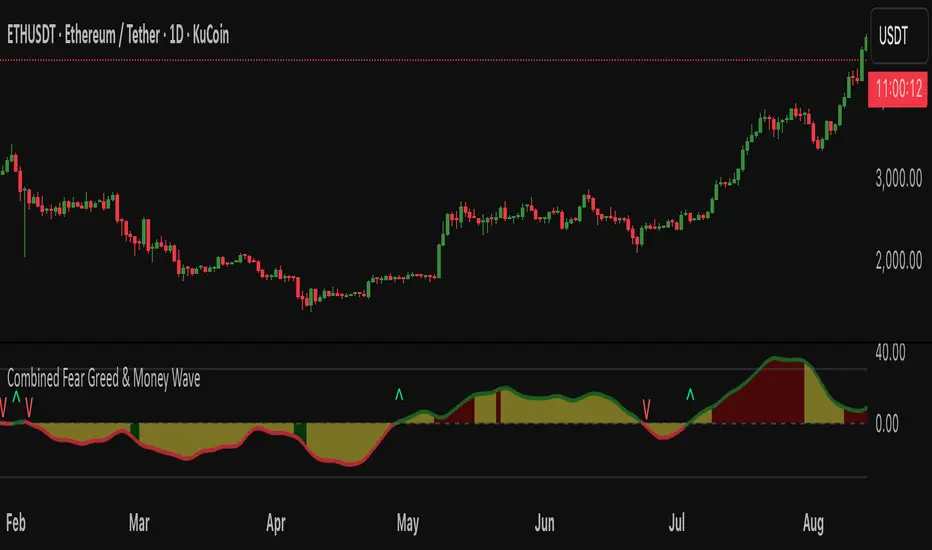
- It calculates a zero-centered and smoothed version of the MFI (MoneyWave) using configurable smoothing methods (SMA, EMA, RMA) with parameters for length and smoothing intensity.
- It uses RSI to define fear and greed zones based on user-defined thresholds (e.g., RSI below 30 indicates fear, above 70 indicates greed).
- The MoneyWave area is color-coded based on these fear/greed RSI zones: dark green for fear, dark red for greed, and yellow neutral.
- The edge line of the MoneyWave shows bullish (lime) when above zero and bearish (red) when below zero.
Visual Elements
- Plots the MoneyWave as a colored area with an edge line.
- Displays horizontal lines representing the zero line and upper/lower bounds derived from MFI thresholds.
- Optionally shows direction change arrows when the MoneyWave sign changes and labels indicating BUY or SELL signals based on MoneyWave crossing zero combined with fear/greed conditions.
Trading Signals and Alerts
- Buy signal triggers when MoneyWave crosses upward through zero while in the fear zone (RSI low).
- Sell signal triggers when MoneyWave crosses downward through zero while in the greed zone (RSI high).
- Alerts can be generated for these buy/sell events.
In summary, this indicator provides a combined measure of money flow momentum (MoneyWave) with market sentiment zones (fear and greed from RSI), helping identify potential market entry and exit points with visual markers and alerts .
Fearandgreedindex
Fear and Greed Index (Crypto & Stock)The Fear and Greed Index utilizes various metrics to gauge the overall sentiment of the stock and crypto market.
It's divided into two categories:
Extreme Fear (0-25) -> Red background
Extreme Greed (75-100) -> Green background
When the index is in the Extreme Fear zone, the indicator background changes to red, while in the Extreme Greed zone, it changes to green.
The blue line represents the Fear and Greed Index for the overall stock or crypto market. The index automatically switches between the crypto and stock depending on the active chart, providing insights into both markets.
The histogram represents Price Momentum for the current active symbol on the chart.
How is the Crypto Fear and Greed Index calculated?
The index is calculated using three factors including momentum of stable coin (safe haven), momentum of major coins, and the balance of unique addresses holding the major coins. The index tracks how much these individual indicators deviate from their averages compared to how much they normally diverge. The index gives each factor equal weighting in calculating a score from 0 to 100, with 100 representing maximum greediness and 0 signaling maximum fear.
The main factors used in the calculation are:
1. Momentum of Stable Coins
The index calculates the momentum of three major stable coins, including USDT, USDC and DAI. The index looks at the stable coins’ levels compared to where they’ve been over the past two months. When the stable coin is below its moving average of the prior 60 trading days, that’s a sign of positive momentum. But if the index is above this average, it shows investors are getting skittish. The Fear & Greed Index uses the growing momentum of stable coin as a signal for Fear and a slowing momentum for Greed.
During a market sell-off, investors may anticipate a decline in the value of their cryptocurrency investments and may transition into stable coins as a safe haven. This is because stable coins are designed to maintain a stable value, often pegged to a fiat currency like the US Dollar.
By analyzing the overall trend of stable coins' movement, the index can help determine whether the market sentiment leans towards greed or fear. If stable coins are experiencing a significant increase in momentum, it may suggest that investors are moving away from riskier assets (like cryptocurrencies) and into safer assets (like stable coins), indicating a fear-driven market sentiment. Conversely, if stable coins are experiencing a decrease in momentum, it may suggest that investors are more confident in the market and are less concerned about potential declines in the value of their cryptocurrency investments, indicating a greed-driven market sentiment.
2. Momentum of major coins
The index calculates the momentum of 16 major cryptocurrencies, including Bitcoin, Ethereum, and BNB. This index assesses the overall trend of these cryptocurrencies' movement, which can provide insights into market sentiment. The index checks how many coins are doing well versus those that are struggling. This shows the number of coins on the market at 2-months highs compared to those at 2-months lows. When there are many more highs than lows, that’s a bullish sign and signals Greed.
By analyzing the momentum of these 16 major cryptocurrencies, the index can help determine whether there's more bullish or bearish sentiment prevailing in the market over the given period. If the overall momentum is positive, it may suggest that investors are more optimistic about the market, leading to increased buying activity and higher prices. Conversely, if the overall momentum is negative, it may suggest that investors are more pessimistic about the market, leading to increased selling activity and lower prices.
3. Balance of unique addresses holding major coins
The index is tracking the number of unique addresses holding Bitcoin and Ethereum. This measure looks at the amount of investors holding Bitcoin or Ethereum and compares the amount to its 2-month moving average.
The logic behind this assessment is that when there are more unique addresses holding Bitcoin and Ethereum, it suggests that more individuals are interested in holding these cryptocurrencies, which may indicate bullish sentiment. Conversely, when there are fewer unique addresses holding Bitcoin and Ethereum, it suggests that fewer individuals are interested in holding these cryptocurrencies, which may indicate bearish sentiment.
How is the Stock Fear and Greed Index calculated?
The Stock Fear & Greed Index is a compilation of two indicators that measure some aspect of stock market behavior. They are market momentum and stock price strength. The Stock Fear & Greed Index calculates how much these individual indicators deviate from their averages and compares this divergence to their typical variations. Both indicators receive equal weighting in calculating a score ranging from 0 to 100.
A score of 100 indicates maximum greediness, suggesting that market momentum and stock prices are significantly above their historical averages.
Conversely, a score of 0 signals maximum fear, indicating that market momentum and stock prices are significantly below their historical averages.
1. Market Momentum
The Stock Fear & Greed index looks at stock market levels compared to where they’ve been over the past few months. When the S&P 500, DJI and NASDAQ is above its moving average of the prior 180 trading days, that’s a sign of positive momentum. But if the index is below this average, it shows investors are getting skittish. The Fear & Greed Index uses slowing momentum as a signal for Fear and a growing momentum for Greed.
2. Momentum of major stocks
The index calculates momentum by analyzing the price levels of major stocks relative to their moving averages over the past six months. When a stock's price is above its moving average of the prior 180 trading days, it indicates positive momentum. Conversely, if the stock's price is below this moving average, it suggests that investors are becoming skittish, or there is a loss of momentum.
How to use the Fear and Greed Index?
The Fear & Greed Index ranges from 0 to 100, a reading of 0-25 indicates extreme fear, while a reading of 75-100 indicates extreme greed. The index can help investors and traders identify market trends and potential turning points. By understanding the sentiment of the market, investors can avoid making decisions based on emotions and biases.
When the Fear and Greed Index is at an extreme level of fear (0-25), it can indicate that investors are overly worried and selling their assets out of fear. This could present a buying opportunity for investors who believe in the long-term potential of the market.
Conversely, when the Fear and Greed Index is at an extreme level of greed (75-100), it can indicate that investors are overly optimistic and buying assets out of greed. This could be a sign that the market is due for a correction.
How is the Price Momentum (Histogram) calculated?
Momentum focuses on the rate of change in stock prices over a specific period. It assesses how quickly prices are moving in a particular direction, whether upward or downward. A momentum value above 50 indicates that prices are fueled by strength to move upward. This suggests that buying pressure is dominant in the market, driving prices higher. Conversely, a momentum value below 50 indicates that prices are fueled by strength moving downward. This suggests that selling pressure is dominant, pushing prices lower.
Our momentum indicator can help investors identify trends and potential turning points in the market. Rising momentum values may indicate an upward trend, while declining momentum values may suggest a weakening trend or a potential reversal.
Extreme momentum values may indicate overbought or oversold conditions in the market. Overbought conditions occur when momentum values are excessively high, suggesting that prices may be due for a correction. Conversely, oversold conditions occur when momentum values are excessively low, indicating potential buying opportunities.
How to use our Fear & Greed Indicator
Using price momentum and the Fear and Greed Index together can provide valuable confirmation signals for investors in the stock or crypto market. Here's how you can use them together:
Identify Trends: Start by identifying the overall trend in the market using price momentum. Rising momentum values often indicate an uptrend, while declining momentum values suggest a downtrend.
Monitor Fear and Greed Index: Simultaneously, monitor the Fear and Greed Index to gauge market sentiment. In an uptrend, high readings on the Fear and Greed Index (75-100) may indicate excessive greed among investors, potentially signaling that the uptrend is becoming overextended and due for a correction. Conversely, in a downtrend, low readings on the Fear and Greed Index (0-25) may indicate extreme fear, potentially signaling capitulation and a possible reversal.
Look for Confirmation Signals: Look for confirmation signals between price momentum and the Fear and Greed Index. For example:
In an uptrend, if momentum is declining while the Fear and Greed Index is at a high level, it may suggest weakening buying pressure and potential exhaustion in the uptrend.
In a downtrend, if momentum is reducing while the Fear and Greed Index is at a low level, it may indicate that selling pressure is subsiding, potentially signaling a reversal in the downtrend.

Fear & Greed Index (Zeiierman)█ Overview
The Fear & Greed Index is an indicator that provides a comprehensive view of market sentiment. By analyzing various market factors such as market momentum, stock price strength, stock price breadth, put and call options, junk bond demand, market volatility, and safe haven demand, the Index can depict the overall emotions driving market behavior, categorizing them into two main sentiments: Fear and Greed.
Fear: Indicates a market scenario where investors are scared, possibly leading to a sell-off or a stagnant market. In such conditions, the indicator helps in identifying potential buying opportunities as assets may be undervalued.
Greed: Represents a state where investors are overly confident and buying aggressively, which can lead to inflated asset prices. The indicator in such cases can signal overbought conditions, advising caution or potential short opportunities.
█ How It Works
The Fear & Greed Index is an aggregate of seven distinct indicators, each gauging a specific dimension of stock market activity. These indicators include market momentum, stock price strength, stock price breadth, put and call options, junk bond demand, market volatility, and safe haven demand. The Index assesses the deviation of each individual indicator from its average, in relation to its typical fluctuations. In compiling the final score, which ranges from 0 to 100, the Index assigns equal weight to each indicator. A score of 100 denotes the highest level of Greed, while a score of 0 represents the utmost level of fear.
S&P 500's Momentum: The Index monitors the S&P 500's position relative to its 125-day moving average. Positive momentum (price above the average) signals growing confidence among investors (Greed), while negative momentum (price below the average) indicates rising fear.
Stock Price Strength: By comparing the number of stocks hitting 52-week highs to those at 52-week lows on the NYSE, the Index gauges market breadth. An extreme number of highs indicates Greed, whereas an extreme number of lows suggests Fear.
Stock Price Breadth (Market Volume): Using the McClellan Volume Summation Index, which considers the volume of advancing versus declining stocks, the Index assesses whether the market is broadly participating in a trend, or if a smaller subset of stocks is driving it.
Put and Call Options: The put/call ratio helps gauge investor sentiment. A rising ratio, particularly above 1, indicates increasing fear, as more investors are buying puts to protect against a decline. A falling ratio suggests growing confidence.
Market Volatility (VIX): The VIX measures expected market volatility. Higher values generally indicate Fear, while lower values point to Greed. The Fear & Greed Index compares the VIX to its 50-day moving average to understand its trend.
Safe Haven Demand: The performance of stocks versus bonds over a 20-day period helps understand where investors are putting their money. Bonds outperforming stocks is a sign of Fear, while the opposite suggests Greed.
Junk Bond Demand: By comparing the yields on junk bonds to safer investment-grade bonds, the Index gauges risk appetite. A narrower yield spread suggests Greed (investors are taking more risk), while a wider spread indicates Fear.
The Fear & Greed Index combines these components, scales, and averages them to produce a single value between 0 (Extreme Fear) and 100 (Extreme Greed).
█ How to Use
The Fear & Greed Index serves as a tool to evaluate the prevailing sentiments in the market. Investors, often driven by emotions, can react impulsively, and sentiment indicators like the Fear & Greed Index aim to highlight these emotional states, helping investors recognize personal biases that might impact their investment choices. When integrated with fundamental analysis and additional analytical instruments, the Index becomes a valuable resource for understanding and interpreting market moods and tendencies.
The Fear & Greed Index operates on the principle that excessive fear can result in stocks trading well below their intrinsic values,
while uncontrolled Greed can push prices above what they should be.
-----------------
Disclaimer
The information contained in my Scripts/Indicators/Ideas/Algos/Systems does not constitute financial advice or a solicitation to buy or sell any securities of any type. I will not accept liability for any loss or damage, including without limitation any loss of profit, which may arise directly or indirectly from the use of or reliance on such information.
All investments involve risk, and the past performance of a security, industry, sector, market, financial product, trading strategy, backtest, or individual's trading does not guarantee future results or returns. Investors are fully responsible for any investment decisions they make. Such decisions should be based solely on an evaluation of their financial circumstances, investment objectives, risk tolerance, and liquidity needs.
My Scripts/Indicators/Ideas/Algos/Systems are only for educational purposes!

Stochastic Vix Fix SVIX (Tartigradia)The Stochastic Vix or Stochastic VixFix (SVIX), just like the Williams VixFix, is a realized volatility indicator, and can help in finding market bottoms as well as tops without requiring bollinger bands or any other construct, as the SVIX is bounded between 0-100 which allows for an objective thresholding regardless of the past.
Mathematically, SVIX is the complement of the original Stochastic Oscillator, with such a simple transform reproducing Williams' VixFix and the VIX index signals of high volatility and hence of market bottoms quite accurately but within a bounded 0-100 range. Having a predefined range allows to find markets bottoms without needing to compare to past prices using a bollinger band (Chris Moody on TradingView) nor a moving average (Hesta 2015), as a simple threshold condition (by default above 80) is sufficient to reliably signal interesting entry points at bottoming prices.
Having a predefined range allows to find markets bottoms without needing to compare to past prices using a bollinger band (Chris Moody on TradingView) nor a moving average (Hesta 2015), as a simple threshold condition (by default above 80) is sufficient to reliably signal interesting entry points at bottoming prices.
Indeed, as Williams describes in his paper, markets tend to find the lowest prices during times of highest volatility, which usually accompany times of highest fear.
Although the VixFix originally only indicates market bottoms, the Stochastic VixFix can also indicate good times to exit, when SVIX is at a low value (default: below 20), but just like the original VixFix and VIX index, exit signals are as usual much less reliable than long entries signals, because: 1) mature markets such as SP500 tend to increase over the long term, 2) when market fall, retail traders panic and hence volatility skyrockets and bottom is more reliably signalled, but at market tops, no one is panicking, price action only loses momentum because of liquidity drying up.
Compared to Hesta 2015 strategy of using a moving average over Williams' VixFix to generate entry signals, SVIX generates much fewer false positives during ranging markets, which drastically reduce Hesta 2015 strategy profitability as this incurs quite a lot of losses.
This indicator goes further than the original SVIX, by restoring the smoothed D and second-level smoothed D2 oscillators from the original Stochastic Oscillator, and use a 14-period ZLMA instead of the original 20-period SMA, to generate smoother yet responsive signals compared to using just the raw SVIX (by default, this is disabled, as the original raw SVIX is used to produce more entry signals).
Usage:
Set the timescale to daily or weekly preferably, to reduce false positives.
When the background is highlighted in green or when the highlight disappears, it is usually a good time to enter a long position.
Red background highlighting can be enabled to signal good exit zones, but these generate a lot of false positives.
To further reduce false positives, the SVIX_MA can be used to generate signals instead of the raw SVIX.
For more information on Williams' Vix Fix, which is a strategy published under public domain:
The VIX Fix, Larry Williams, Active Trader magazine, December 2007, web.archive.org
Fixing the VIX: An Indicator to Beat Fear, Amber Hestla-Barnhart, Journal of Technical Analysis, March 13, 2015, ssrn.com
For more information on the Stochastic Vix Fix (SVIX), published under Creative Commons:
Replicating the CBOE VIX using a synthetic volatility index trading algorithm, Dayne Cary and Gary van Vuuren, Cogent Economics & Finance, Volume 7, 2019, Issue 1, doi.org
Note: strangely, in the paper, the authors failed to mention that the SVIX is the complement of the original Stochastic Oscillator, instead reproducing just the original equation. The correct equation for the SVIX was retroengineered by comparing charts they published in the paper with charts generated by this pinescript indicator.
For a more complete indicator, see:

Trendmaster - Crypto Social Sentiment OscillatorWhat it is:
The Crypto Social Sentiment Oscillator looks at several social metrics for both Bitcoin and Ethereum more deeply than a simple Fear and Greed Indicator,
to produce a general market sentiment for cryptocurrency.
What it does:
Social Sentiment tries to gain insight into the current retail opinion and mindset on the Crypto sector.
Analyzing multiple social networks and the positive/negative posts and engagement throughout,
we can establish a broad overview of the underlying emotion in reaction and anticipation of price movement.
How to use it:
A value of 100 can indicate extreme market greed, with 0 indicating extreme fear.
Generally, the more Greedy a market is, the more it is punished to the downside.
The more Fearful a market is, the more it is surprised by the upside.

Fear and Greed Intraday IndexThis script uses all of the sub-components of my 'Fear and Greed Index' which can be used on intraday timeframes. Most of the components of this script are based on the popular fear and greed index website and are briefly described in the code comments.
Several of the subcomponents have been recalculated to use RSIs instead of being compared to moving averages, which means as opposed to being used a contrarian timing indicator as the daily timeframe Fear and Greed Index is, this indicator now may potentially be used more like a momentum indicator.
It's up to you!
Enjoy!

Fear and Greed IndexI couldn't find one based on the original, so I made my own, it's not quite identical, but it does the job.
Red = greed
Green = fear
I updated a lot of the subcomponents and fixed a bug. I've reduced the smoothing to 1, it was previously 5 if you prefer smoother signals. Also added a McClellan oscillator.
I've commented out the plotting of individual sub-components, just uncomment them to see what they do. Some look like pretty useful indicators on their own.
Enjoy!
