Intrinsic value calculation Intrinsic value calculator based on Warren Buffet's and Ben Graham's work
In value investing determing the true value of a COMPANY instead of a stock price is crucial.
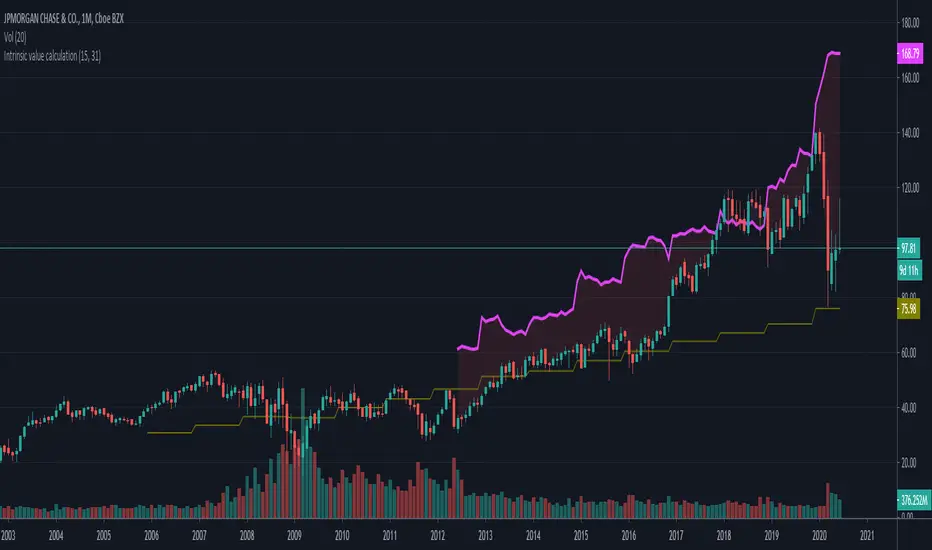
This little indicator shows the "Intrinsic value" of the choosen stock meaning the value of the stock in 10 years time. Calculation is based on historical book value's average annual growth rate and dividends paid.
Since this is about long therm investing, use monthly charts.
"Intrinsic value can be defined simply: It is the discounted value of the cash that can be taken out of a business during its remaining life.”
– Warren Buffett
One way to calculate that is by the growth in per share book value and dividends taken in the forseeable future (10 years) than discount it with the prevailing 10 year note's rate.
In the inputs you have to set 2 variables:
1. How many years back you have the first data for book value per share available?
2. What was the per share book value that year?
(Bookvalue is ploted in olive colour and you can get the oldest one if you move your cursor over the latest data on the left)
CAUTION! You have to reenter it for every stock you analyse as this is stock-specific data!
After setting the input data, you will see the "Intrinsic Value"'s pink curve ploted over the price chart.
If the price is well below the pink line, the company is undervalued and can be a possible applicant for long therm investment.
Margin of safety: when the current price is 50% below the intrinsic value that means a 10% yearly growth potential (100% growth in 10 years) or a 100% margin of safety.
I am a beginer in Pine so please excuse my coding...
If anybody knows hot to extract historical data from 15 years ago, please share it with me, so I can automate the whole calculation without inputs necessary.
Financials
Funamental and financialsEarnings and Quarterly reporting and fundamental data at a glance.
A study of the financial data available by the "financial" functions in pinescript/tradingview
As far as I know, this script is unique. I found very few public examples of scripts using the fundamental data. and none that attempt to make the data available in a useful form
as an indicator / chart data. The only fitting category when publishing would be "trend analysis" We are going to look at the trend of the quarterly reports.
The intent is to create an indicator that instantly show the financial health of a company, and the trends in debt, cash and earnings
Normal settings displays all information on a per share basis, and should be viewed on a Daily chart
Percentage of market valuation can be used to compare fundamentals to current share price.
And actual to show the full numbers for verification with quarterly reporting and debuggging (actual is divided by 1.000.000 to keep numbers readable)
Credits to research study by Alex Orekhov (everget) for the Symbol Info Helper script
without it this would still be an unpublished mess, the use of textboxes allow me to remove many squiggly plot lines of fundamental data
Known problems and annoyances
1. Takes a long time to load. probably the amount of financial calls is the culprit. AFAIK not something i can to anything about in the script.
2. Textboxes crowd each other. dirty fix with hardcoded offsets. perhaps a few label offset options in the settings would do?
3. Only a faint idea of how to put text boxes on every quarter. Need time... (pun intended)
Have fun, and if you make significant improvements on this, please publish, or atleast leave a comment or message so I can consider adding it to this script.
© sjakk 2020-june-08

TwP: Financials on ChartsWith this indicator, you can see the following on a chart:
> An Info Panel , with the financial snapshot of the company, such as its market capitalization, annual & quarterly financials, Y/Y growth numbers, profitability margins, RoE & RoCE, and valuation ratios.
> EBITDA and PAT margins over a period of time.
> RoE and RoCE ratios over a period of time.
> Valuation multiples over a period of time.
> A comparison of margins, return ratios, and valuation multiples with any peer-group company .
Info Panel
This gives a quick snapshot of the financials of the company, which includes annual & quarterly Revenue, EBITDA, PAT, margins with Y/Y changes, Debt-Equity ratio, ROE, ROCE, and valuation multiples.
Profitability & Return Ratios
You can view quarterly as well as annual EBITDA & PAT margins and annual RoE, RoCE. You can choose to see these ratios either only for the company or can also add a peer company to compare.
Valuation Ratios
You can view TTM valuation ratios such as EV/Sales, EV/EBITDA, P/BV & P/E multiples. You can choose to see these valuation multiples either only for the company or can also add a peer company to compare.

Fundamentals LabelThis is a script that will pull some of the financial data of the stock and show on the chart for quick reference. It also shows selected financial ratios.
Regards
