SuperTrend Logistic Regression | Flux ChartsGENERAL OVERVIEW
The SuperTrend Logistic Regression indicator combines the classic SuperTrend trend-following tool with a self-training logistic regression model that assigns a probability percentage to every SuperTrend flip. Each time the SuperTrend changes direction, the indicator evaluates the market conditions at the flip across 14 features spanning candle structure, trend context, and technical indicators, then outputs a probability score between 0% and 100% representing how similar the current setup is to past flips that resolved profitably on the same chart.
The model trains itself in real time using past SuperTrend signals as labeled examples. Each historical flip becomes a training example: the features captured at the flip are paired with the outcome at the next opposite flip, producing a continuously growing dataset that the model uses to refine its weights. The probability displayed on each new flip reflects what the model has learned about this specific instrument and timeframe, not a universal assumption about what makes a good signal.
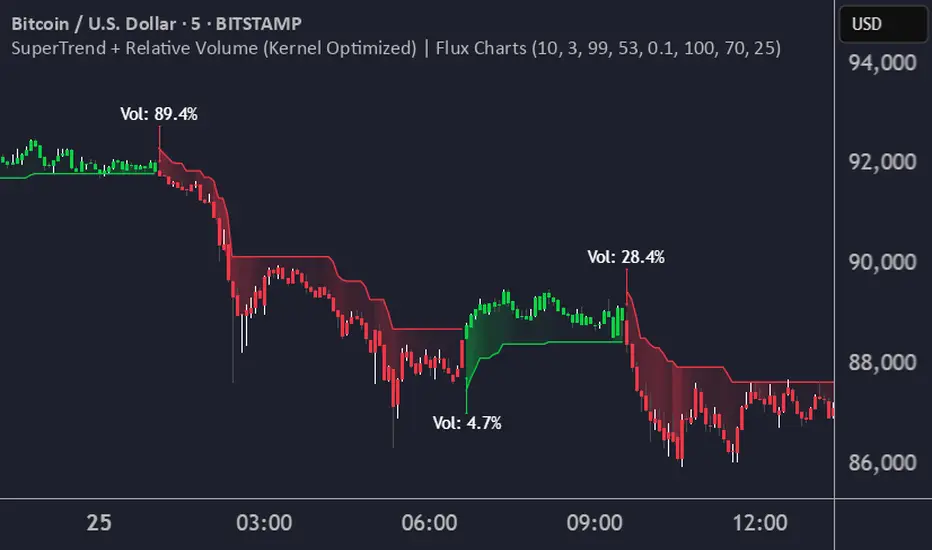
screenshot: Full chart showing SuperTrend line with multiple flips and probability labels
🔹What is the purpose of the indicator?
The indicator addresses a common problem with SuperTrend: not every flip leads to a sustained trend. Many flips occur during choppy or transitional conditions and reverse quickly, producing losing signals. By scoring each flip with a probability, traders get a quantitative sense of how much confidence the model has in that specific signal based on similar past setups. The indicator does not change the SuperTrend calculation itself, so every flip is still detected and visualized. The probability score adds a filtering layer that helps traders separate high-confidence flips from low-confidence ones.
🔹What is the theory behind the indicator?
The indicator is built on the idea that market behavior around trend reversals is not random. Certain combinations of candle structure, volatility conditions, volume patterns, and prior trend context tend to precede trends that follow through, while different combinations tend to precede trends that reverse quickly. Logistic regression is a statistical method well-suited to learning these relationships. Given a set of input features and historical outcomes, it produces a set of weights that map feature combinations to probability estimates.
In this indicator, each SuperTrend flip becomes a data point. The features at the flip are recorded, and the outcome is determined at the next opposite flip. If price moved in the signal's direction (higher for bull, lower for bear), the signal is labeled as a win. Otherwise, it is labeled as a loss. The model continuously retrains on this growing dataset, adjusting weights so that feature patterns historically associated with wins produce higher probabilities, and feature patterns associated with losses produce lower probabilities.
SUPERTREND LOGISTIC REGRESSION FEATURES
SuperTrend Core
Logistic Regression Model
Candle Features
Trend Context Features
Technical Features
Separate Bull and Bear Models
Exponential Decay Weighting
Minimum Sample Gating
Probability Labels and Filtering
Gradient-Colored SuperTrend Visualization
Optional Momentum Dots
Alerts
SUPERTREND CORE
The SuperTrend is the foundation of every signal. All detection, training, and prediction is tied to SuperTrend flips. The core SuperTrend calculation in this indicator is standard: ATR multiplied by a user-defined factor produces the trailing line, and a flip occurs when price crosses through the line, changing the direction state.
🔹How SuperTrend is calculated
The SuperTrend is derived from Average True Range (ATR) with a user-configurable period and factor. When the calculated line is below price, the indicator is in an uptrend state and the line acts as dynamic support. When the line is above price, the indicator is in a downtrend state and the line acts as dynamic resistance. A flip occurs at the exact bar where price crosses through the line, changing the direction from bullish to bearish or vice versa.
🔹Why SuperTrend was chosen
SuperTrend is one of the most widely used trend-following tools on TradingView. It produces clean, deterministic signals with well-understood behavior. Rather than reinventing or modifying the underlying calculation, this indicator treats SuperTrend as a signal source and adds a separate statistical layer on top. This keeps the core behavior familiar to traders already using SuperTrend and ensures that every flip is still detected, regardless of the probability score.
🔹SuperTrend Inputs
Two inputs control the SuperTrend calculation: Factor (the ATR multiplier, default 3.0) and ATR Period (the number of bars in the ATR calculation, default 10). These correspond to the standard SuperTrend parameters. Changing these values affects where flips occur, which in turn affects what signals the model trains on.
LOGISTIC REGRESSION MODEL
Logistic regression is a statistical model that predicts binary outcomes from a set of input features. It takes each feature, multiplies it by a learned weight, sums the results, adds a bias term, and passes the total through a sigmoid function that maps the output to a probability between 0 and 1. The model learns the weights by comparing its predictions against actual outcomes and adjusting through gradient descent.
🔹What is Logistic Regression?
Logistic regression works by finding the set of weights that best separates winning signals from losing signals in feature space. A large positive weight on a feature means that higher values of that feature are associated with winning outcomes. A large negative weight means higher values are associated with losing outcomes. A weight near zero means the feature does not discriminate between winners and losers on this chart.
The sigmoid function is what turns the weighted sum into a probability. It outputs values near 0 when the weighted sum is very negative, values near 1 when the weighted sum is very positive, and values near 0.5 when the weighted sum is near zero. This gives the output a natural probability interpretation.
🔹How the model is trained
Training happens every time a new SuperTrend flip occurs. The indicator looks at all past resolved signals (signals that have already seen their next opposite flip and therefore have a known outcome) and runs gradient descent over them. Gradient descent calculates how much each weight should change to reduce the model's prediction error, then applies those changes iteratively. The indicator runs multiple training epochs on each update to ensure the weights converge reasonably well to the current data.
L2 regularization is applied to prevent any single weight from becoming extreme. Weight clipping further constrains weights to a reasonable range, avoiding instability when training data is thin or features are noisy. Together, these make the model more robust on small sample sizes.
🔹Outcome evaluation
For training to work, every historical signal needs a win/loss label. The indicator uses flip-to-flip evaluation: a bull signal is considered a win if the close at the next bear flip is higher than the close at the bull flip. A bear signal is considered a win if the close at the next bull flip is lower than the close at the bear flip. This matches the natural lifecycle of a SuperTrend trade, where entry and exit are both on flips.
🔹A Winning Signal Example
A winning bull signal forms when a bull flip occurs and, by the time the next bear flip occurs, the close at the bear flip is higher than the close at the bull flip. The probability label on the bull flip reflects the model's confidence at entry, while the outcome is confirmed at the next flip.
🔹A Losing Signal Example
A losing signal forms when price fails to move in the signal's direction by the next opposite flip. For example, a bull flip where price immediately reverses and ends lower than entry when the next bear flip occurs.
CANDLE FEATURES
Candle features describe the shape and volume of the flip candle itself, compared against recent averages. These are the most direct, local features the model uses. All candle features are toggleable in the "Candle Features" input group and are normalized to a range centered at zero, where zero means the feature value matches the recent average.
🔹Body
Body measures the size of the flip candle's body (the absolute distance from open to close) relative to the average body size over the recent lookback window. A value above zero means the flip candle had a larger body than recent candles, suggesting stronger conviction. A value below zero means the body was smaller than usual, suggesting indecision. The model learns whether strong-bodied flips tend to produce winning trends on this chart.
🔹Upper Wick
Upper Wick measures the length of the upper wick (the distance from the body top to the high) relative to recent average upper wicks. Long upper wicks can indicate rejection at highs, while short upper wicks suggest price accepted the top of the candle cleanly. The model learns how upper wick behavior at flips correlates with outcomes.
🔹Lower Wick
Lower Wick measures the length of the lower wick (the distance from the body bottom to the low) relative to recent average lower wicks. Long lower wicks can indicate rejection at lows, while short lower wicks suggest clean acceptance. This feature is disabled by default because it historically showed the weakest predictive signal across tested instruments.
🔹Range
Range measures the total high-to-low range of the flip candle relative to the recent average range. A wide-range flip candle indicates volatility expansion, while a tight-range candle suggests contraction. The model learns whether flips during volatility expansion tend to perform differently from flips during contraction.
🔹Volume
Volume compares the flip candle's volume to the average volume over the recent lookback window. Higher than average volume at a flip generally indicates stronger participation, while lower than average volume suggests weak conviction. The model learns how volume conviction at flips relates to trend outcomes.
🔹Delta Volume
Delta Volume estimates the net buying versus selling pressure within the flip candle by sampling 1-minute lower timeframe bars. The indicator distributes each 1-minute bar's volume to either the bullish or bearish side based on whether that bar closed up or down, then outputs the net direction as a feature value from fully bearish to fully bullish. This gives the model a finer-grained view of what happened inside the flip candle beyond the aggregate close.
TREND CONTEXT FEATURES
Trend context features describe the market conditions leading into the flip, not just the flip candle itself. These are calculated from the lookback window before the flip. All trend context features are toggleable in the "Trend Features" input group.
🔹Momentum
Momentum counts consecutive candle direction leading into the flip. Each bullish candle increments the streak in the positive direction, and each bearish candle increments it in the negative direction. The value is capped so very long streaks do not dominate. A strongly positive momentum value before a bull flip indicates buying was already building; a strongly negative value before a bull flip indicates a sharp reversal from recent selling. The model learns which regime tends to produce better bull outcomes.
🔹Pre-Flip Trend
Pre-Flip Trend averages the signed candle bodies (close minus open) over the recent lookback window, normalized by the average range. This gives a broader picture of whether the market was drifting up, drifting down, or chopping sideways before the flip. Unlike momentum, which only counts direction, pre-flip trend captures the magnitude of the directional bias.
🔹ATR Slope
ATR Slope compares the current ATR value to the ATR value from the lookback period ago. A positive slope means volatility is expanding into the flip, often associated with stronger follow-through. A negative slope means volatility is contracting, often associated with weaker signals. The model learns whether volatility expansion at the flip is a positive or negative factor for the specific instrument.
🔹Volume Trend
Volume Trend compares the average volume of recent bars to the average volume of bars further back. A positive value means participation is increasing; a negative value means it is fading. This feature is disabled by default because it historically showed weak signal across tested instruments.
🔹ST Distance
ST Distance measures how far price was from the SuperTrend line before the flip, normalized by ATR. A value near zero means the flip was a tight cross; a larger absolute value means price was well above or below the line and had to travel significantly to trigger the flip. The model learns whether tight crosses or aggressive breaks produce better outcomes.
🔹Trend Duration
Trend Duration measures how many bars the previous trend lasted before flipping. Short previous trends might indicate choppy conditions where flips come and go quickly. Longer previous trends might signal genuine exhaustion at reversal. The model learns how previous trend length relates to the success of the current flip.
TECHNICAL FEATURES
Technical features bring in classic technical indicator readings at the flip point. These are toggleable in the "Technical Features" input group.
🔹RSI
RSI (Relative Strength Index) is calculated with the same lookback as the other features and then centered around the 50 level. Values near the oversold end push the feature toward -1, values near the overbought end push it toward +1, and values near 50 are near zero. The model learns whether overbought or oversold RSI readings at flips correlate with different outcomes on the specific chart. On some instruments, flips at extreme RSI readings perform well; on others, they perform poorly. The model discovers this from the data.
🔹BB Position
BB Position measures where price sits within Bollinger Bands at the flip. Price at the lower band gives a value of -1, price at the basis gives 0, and price at the upper band gives +1. The Bollinger Bands are calculated with the same lookback as the other features. This feature captures mean-reversion versus breakout context: a flip near the lower band is different from a flip near the upper band, and the model learns which band positions tend to precede successful trends.
SEPARATE BULL AND BEAR MODELS
The indicator maintains completely independent models for bull signals and bear signals. Each has its own set of weights, its own training dataset, and its own prediction logic.
🔹Why separate models?
A single model that assumes features mean opposite things for opposite directions would be an oversimplification. For example, a long lower wick on a bull flip might indicate strong buyer defense, while a long lower wick on a bear flip might indicate weak sellers. These are different setups with different implications, and forcing them into one model with flipped signs would blur the signal.
By training separate bull and bear models, the indicator gives each direction room to learn its own relationships. A feature that strongly predicts bull wins might be irrelevant or even negatively correlated for bear wins, and the separate models can capture this without interference.
🔹Implementation
Each direction has its own array of signals and its own weights array. When a bull flip occurs, the bull signals array is updated and the bull model is retrained. When a bear flip occurs, the bear signals array and bear model are updated separately. The two models never share state, and their predictions are based only on their own training data.
EXPONENTIAL DECAY WEIGHTING
Not all training examples are equally relevant. Recent signals reflect current market conditions, while older signals may reflect regimes that no longer apply. The indicator addresses this with exponential decay weighting during training.
🔹How decay works
Each resolved signal is assigned a weight based on its age. The newest resolved signal gets the highest weight (1.0 after normalization), and older signals get progressively smaller weights based on a decay factor. A decay factor close to 1 means old and new signals are weighted roughly equally. A decay factor close to 0 means recent signals dominate and old signals are effectively ignored.
🔹Why decay is important
Markets change. A feature that strongly predicted wins six months ago might have weak or reversed predictive power now. Without decay weighting, the model would be slow to adapt to new conditions because old data would dilute the influence of recent outcomes. With decay weighting, the model naturally updates its weights to reflect the most recent dynamics while still using historical data to maintain stability.
PROBABILITY LABELS AND FILTERING
When a new flip passes the minimum sample gate, the indicator calculates the probability from the current feature values and the trained weights. This is displayed as a colored triangle label at the flip bar.
🔹Label Appearance
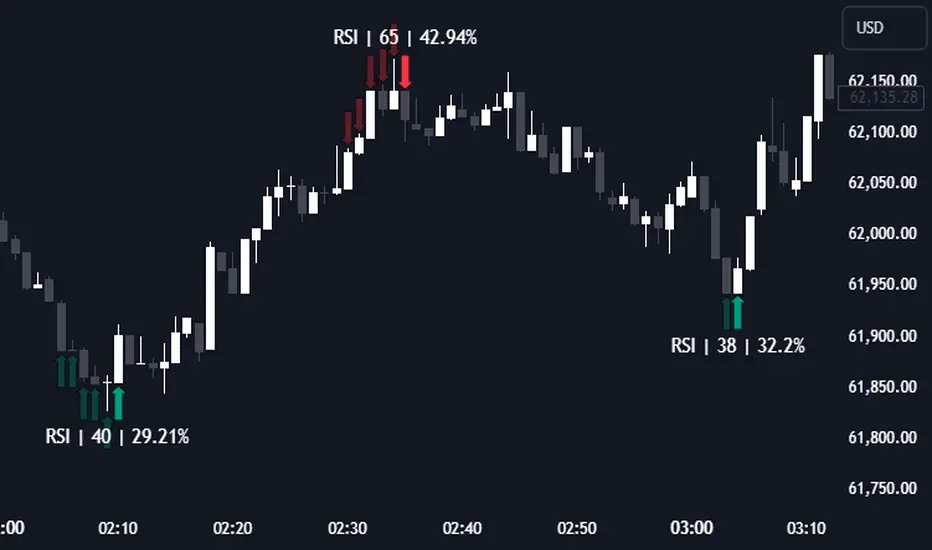
Bull flip labels appear below the bar as upward-pointing green triangles with the probability percentage inside. Bear flip labels appear above the bar as downward-pointing red triangles with the probability percentage inside. The colors are partially transparent so the labels do not obscure price action.
🔹High Probability Example
A high probability label means the model found the current flip's features similar to past flips that resolved as wins. For example, a bull flip with strong pre-flip momentum, expanding volatility, positive delta volume, and price well above the SuperTrend line might receive a probability above 65% if those conditions have historically preceded successful bull trends.
🔹Low Probability Example
A low probability label means the model found the current flip's features similar to past flips that resolved as losses. Low probability signals might share characteristics with flips that occurred during choppy conditions or weak momentum regimes.
🔹Min Probability Filter
A Min Probability input lets users hide labels below a confidence threshold. Setting it to 0 shows every signal. Setting it to 60 only shows labels where the model estimates at least 60% probability of a profitable outcome. This filter only affects visual display and alerts. The SuperTrend line and color change still appear on every flip, and the model still trains on every signal regardless of the filter.
🔹Interpreting the probability
The probability represents the model's estimate that the current flip will resolve profitably by the next opposite flip, based on how similar past flips performed. A 70% label does not guarantee a win; it means the model finds this flip's conditions more similar to past winners than past losers. Probabilities should be interpreted relative to the base rate (the overall percentage of past flips that won) rather than as absolute guarantees.
VISUAL CUSTOMIZATION
The indicator includes several visual elements that help traders see the SuperTrend state and the probability labels clearly.
🔹Gradient-Colored SuperTrend
The SuperTrend line is plotted with a color gradient based on how far current price has moved from the line since the most recent flip. The color intensifies as price extends further in the trend direction, giving a visual indication of how developed the trend is at any point. Fills between the body midpoint and the SuperTrend line reinforce this gradient effect.
🔹Momentum Dots
An optional momentum dots display overlays circles on the SuperTrend line with colors that shift between yellow and the trend color (green or red) based on price position. This provides a secondary visual cue for trend strength. The Enable Momentum Dots input toggles this display on or off.
INPUTS
🔹SuperTrend
Factor: ATR multiplier used in the SuperTrend calculation. Default is 3.0. Increasing this value makes the SuperTrend less sensitive and produces fewer, wider flips. Decreasing it makes the SuperTrend more sensitive and produces more frequent flips.
ATR Period: Number of bars used in the ATR calculation. Default is 10. Larger periods smooth the ATR, while smaller periods make it more reactive.
🔹Display
Enable Momentum Dots: Toggles the momentum dots overlay on the SuperTrend line. Default is on.
🔹Filters
Min Probability %: Minimum probability required for a signal label to appear on the chart. Default is 0 (show all signals). Setting this to a higher value hides lower-confidence signals.
🔹Candle Features
Body: Enable body size feature. Default is on.
Upper Wick: Enable upper wick feature. Default is on.
Lower Wick: Enable lower wick feature. Default is off.
Range: Enable candle range feature. Default is on.
Volume: Enable volume feature. Default is on.
Delta Vol: Enable delta volume feature using 1-minute LTF data. Default is on.
🔹Trend Features
Momentum: Enable consecutive candle direction feature. Default is on.
Pre-Flip Trend: Enable average directional body feature. Default is on.
ATR Slope: Enable volatility expansion feature. Default is on.
Volume Trend: Enable volume building feature. Default is off.
ST Distance: Enable distance from SuperTrend line feature. Default is on.
Trend Duration: Enable previous trend length feature. Default is on.
🔹Technical Features
RSI: Enable RSI feature. Default is on.
BB Position: Enable Bollinger Band position feature. Default is on.
ALERTS
The indicator includes alert conditions for the following events:
Bull Flip: Fires on a confirmed bullish SuperTrend flip that passes the Min Probability filter.
Bear Flip: Fires on a confirmed bearish SuperTrend flip that passes the Min Probability filter.
Users can configure alerts from the TradingView alerts menu and choose which condition to subscribe to.
IMPORTANT NOTES
🔹Non-Repainting Behavior
Signals are detected and probability labels are calculated on the bar where the SuperTrend flip confirms. The probability value is based only on feature values at the time of the flip and the model weights as of that bar. The outcome label used for training is only recorded after the next opposite flip has occurred, so the current bar's prediction never uses future data.
🔹Probability Interpretation
The probability represents the model's learned estimate from past data on the current chart. It is not a guaranteed win rate. Markets can shift in ways the model has not yet seen, and sample size is always a limitation. Probabilities should be used as one input among many in a trading decision, not as a standalone signal.
UNIQUENESS
The SuperTrend Logistic Regression indicator takes a distinct approach to SuperTrend enhancement. Rather than altering the SuperTrend calculation itself, it preserves the classic SuperTrend behavior and adds a statistical layer on top that scores each flip independently. Every flip is still detected, so users never miss signals; the probability only determines what gets visually emphasized. The logistic regression implementation uses proper gradient descent with L2 regularization, weight clipping, and exponential decay weighting, making the training process stable and adaptive. Weights persist across bars and are refined with each new resolved signal rather than being recalculated from scratch. Separate bull and bear models learn direction-specific feature relationships independently, avoiding the oversimplification of assuming features have opposite meanings for opposite directions. All 14 features are toggleable, spanning candle structure, trend context, and technical indicators, so users can customize which market characteristics feed into the model. The probability is backed by a concrete, testable definition: the likelihood that the current flip will resolve profitably by the time the next opposite flip occurs, based on how similar past flips performed. This matches how SuperTrend is naturally traded on flip-to-flip cycles. Minimum sample gating ensures that probability labels only appear once the model has enough training data to make meaningful predictions, preventing misleading early signals. Together, these choices make the indicator a disciplined, data-driven extension of SuperTrend that adapts to each instrument and timeframe it runs on, rather than applying a one-size-fits-all scoring system.
Pine Script®指標