Greater Currency Correlation Matrix (Forex)Other available matrixes I found have a limited number of forex symbols. Consequentially, you need to keep switching them if you want to do a proper analysis. As a result of that, I produced my own currency matrix.
Correlation studies relationships between different price charts.
High correlation may be completely random in the short term, but it may signify a fundamental relationship between the two symbols if calculated over the long term.
For example, the currency of an oil-producing country may rally along with oil, whereas the importer's currency may drop. This means that watching the oil price chart may be worth it for such pairs.
The script includes all Major and Minor pairs with the addition of Gold (XAUEUR) and two optional symbols.
▬▬▬▬
To avoid too frequent use of security(), I decided to calculate all symbol values from EUR pairs. It should improve performance and keep room for some additional symbols in the future.
Please report any bugs.
外匯
Neo's Divergence FractalsDivergence Fractals combine divergence candlestick patterns with concepts pioneered by Bill Williams and George Lane to create a precise trend following tool that responds very well to the FX market. This indicator is built off of my Neo Fractal data set, which unlike traditional Williams fractals, track highest and lowest closes instead of higher highs and lower lows. Through my own research, I've found Neo Fractals to be a much more accurate way of pinpointing %K and RSI extremes than Williams fractals, especially in scenarios where markets make higher highs or lower lows, but fail to close higher or lower. This can lead to false divergence signals because the stochastic and RSI values aren't referenced at their highest or lowest point.
If divergence is detected between the previous close and the closest fractal above or below the close, the script then waits for a close above (bullish), or below (bearish) the close where divergence was present, at which point, an up (bullish) or down (bearish) fractal will appear on the chart. Divergence signals followed by engulfing candles are also colored, so they're easy to spot. These are the highest quality reversal or in some cases trend continuation signals! Divergence Fractals can be a great entry tool, but can also be great for managing and closing active trades as well. This indicator was designed to work in tandem with my %K as well as my proprietary Lucky7 indicator, mainly on the 1HR chart.

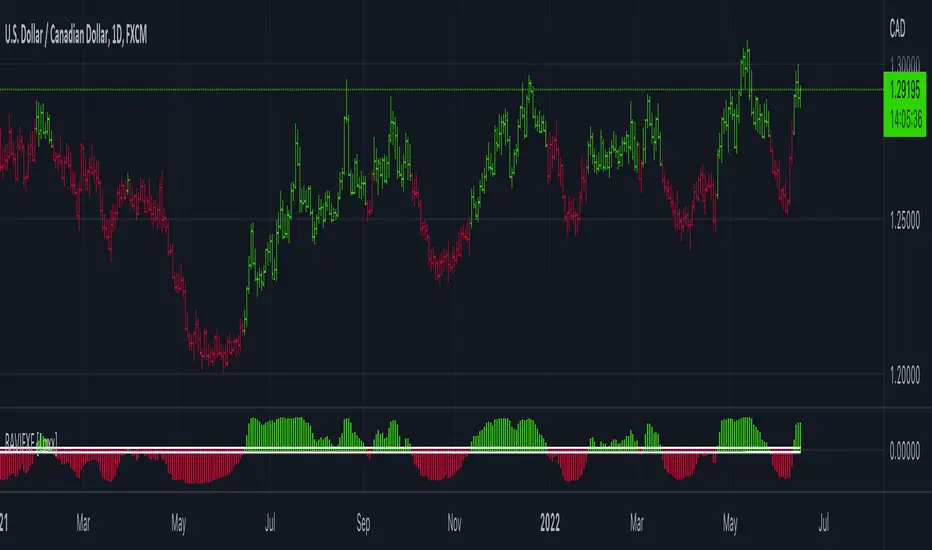
RAVI FX Fisher [Loxx]RAVI FX Fisher is a special implementation of RAVI using WMA moving averages and ATR and then normalized like Fisher Transform. If the histogram falls between the white lines, the market is too choppy to trade. This indicator is tuned for Forex.
What is RAVI?
The Range Action Verification Index (RAVI) indicator shows the percentage difference between current prices and past prices to identify market trends. It is calculated based on moving averages of different lengths.
Included:
-Change bar colors
Multi Exchange Relative Volume - FOREXHello traders! This is my first script that I will publish here. This script calculates the relative volume based on the average volume at that time of the day across different brokers.

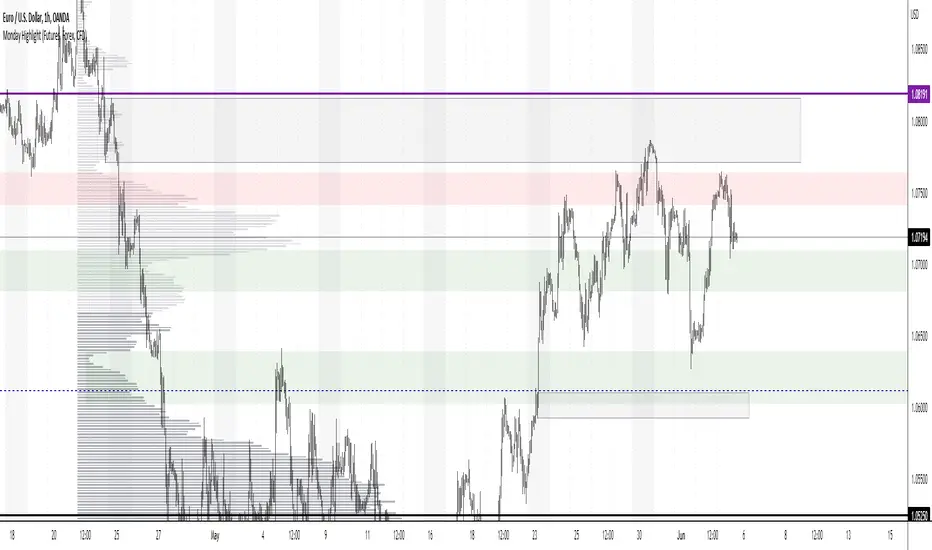
Monday Highlight (Futures, Forex, CFD)Hello Traders
This is a very simple indicator that will highlight the background vertically over every Monday for Futures, Forex and CFD markets. I use this indicator in all my technical analysis as it lets me very quickly see where each week begins without being too distracting. It can be easily customizable to whatever color, transparency level and visibility you want. Because of the way closing times are processed in different markets I could not make a single indicator to include all markets, but check out my second Monday Highlight indicator for Crypto and Stock markets.
Hope you find them useful and don't forget to add them to your "favorites" list for easy access.
MACD Volume S2 By Gammaprod>> How to use this indicator :
1. Set your teadingview theme to dark theme.
2. My indicator is valid for forex, stock and but more valid for crypto.
3. Use three timeframe for more validation (choose between those, that fit to your trading style) :
- Timeframe 1m, 5m, and 15m for Scalping
- Timeframe 30m, 1h and 4h for Intraday
- Timeframe 4h, 1D and 1W for Swing Trading
4 . Always use THREE INDICATORS FROM GAMMAPROD, those three indicators is back to back each other, by the way, I only made those three indicators only (for now) :
- Trendlines Boll Ichi Crypto by Gammaprod
- Stoch RSI Divs Zone Crypto by Gammaprod
- MACD Volume Crypto by Gammaprod
>> How to setting :
1. Trendlines Boll Ichi Crypto by Gammaprod
A. Support and Resistence
- Well if you familiar with this indicator you can add it, but recommended for Timeframe 30m or more
B. Trendlines Primary or Trendlines Secondary
- Timeframe 1m you DON'T NEED Trendlines Primary or Trendlines Secondary
- Timeframe 5m you DON'T NEED Trendlines Secondary, but you CAN ADD Trendlines Primary if you fell it helpful (for me, it is helpful to find where the candles start or the end trend or a consolidation or where the candles will surpass a resistance or a support).
- Timeframe 15m you DON'T NEED Trendlines Secondary, DEFENITELY add Trendlines Primary it will help to find where the candles stop or a consolidation or where the candles will surpass a resistance or a support).
- Timeframe 30m or more, DEFENITELY NEED BOTH Trendlines Primary and Secondary Trendlines, it will help to find where the candle stop or consolidation or where the candle will surpass a resistance or support).
C. Bolinger, Ichimoku Cloud and Lagging Span
- Please DON'T CHANGE IT at all, it's really helpful to know when and where to make an entry decesion or a trend or a consolidation, if you don't understand how to read it, you better to learn it first (on "how to read" section and "How to OPEN position" the section below)
2. Stoch RSI Divs Zone Crypto by Gammaprod (DON'T CHANGE IT)
3. MACD Volume Crypto by Gammaprod (DON'T CHANGE IT)
>> How to read :
1. Sell or Buy Priority :
A. Buy Priority
- Color background on macd and stoch rsi is pink or purple sell is the priority, (if you're not sure to buy, just wait until the best moment to sell)
B. Buy Priority
- Color background on macd and stoch rsi Teal or light green buy is the priority, (if you're not sure to sell, just wait until the best moment to buy)
C. Indecision / Golden Moment
- Color background on stoch rsi yellow is indecision / golden moment of reversal pattern (wait until it formed background only on Stoch RSI), please becareful at this moment.
2. Trend / Consolidation :
A. BULLISH trend
- When Stoch RSI and MACD have teal or light green background that's means BULLISH trend, better to confirm by the candle is above green cloud and lagging span (red line) is also above the candle.
B. BEARISH trend
- When Stoch RSI and MACD have the Pink or purple background that's means BEARISH trend, better to confirm by the candle is above purple cloud and lagging span (red line) is also below the candle.
C. CONSOLIDATION
- When Stoch RSI have the mix background that's means CONSOLIDATION, better to confirm by the candle is in or near to green / purple cloud and lagging span (red line) is also on the candle.
3. Special Mark
A. Ideal Bullish :
- Near line 20 and green / teal background = When Stoch RSI have the char R / H on lime color label, that's means divergence or hidden divergence for buy position, if you not see this label that's means just a standard confirmation for buy
B. Not an Ideal Bullish :
- Near line 80 and green / teal background = if this happens make sure you know what happen, it could be a false signal or bullish continual pattern
C. Ideal Bearish :
- Near line 80 and pink / purple background = When Stoch RSI have the char R / H on lime color label, that's means divergence or hidden divergence for buy position, if you not see this label that's means just a standard confirmation for sell position.
D. Not an Ideal Bearish:
- Near line 20 and pink / purple background = if this happens make sure you know what happen, it could be a false signal or bearish continual pattern
E. The Beginning of Reversal (from BEARISH to BULLISH) :
- When Stoch RSI line shaping GREEN position is near 20.
- MACD lines still PINK, position lines is UNDER the HISTOGRAM, but the HISTOGRAM start to SHAPE FALL PINK (light pink) and the BACKGROUND still PINK / PURPLE.
- Position CANDLES NEAR BLUE line, NEAR PURPLE CLOUD, and lagging span (red line) STILL ON the area candle. (it used to be confirmed with the golden moment).
F. The Beginning of Reversal (from BULLISH to BEARISH) :
- When Stoch RSI line shaping PINK position is near 80.
- MACD lines still GREEN, position lines is ABOVE the HISTOGRAM, but the HISTOGRAM start to SHAPE FALL GREEN (light green) and the BACKGROUND still TEAL / GREEN.
- Position CANDLES NEAR WHITE line, NEAR TEAL CLOUD, and lagging span (red line) STILL ON the area candle. (it used to be confirmed with the golden moment).
G. False Signals, or It could be a Golden Moment (better to see it on TF 15 or bigger):
- Near line 20 or 80 and yellow background = When Stoch RSI have the char R / H on color label, that's means divergence or hidden divergence for buy / sell position, if you not see this label that's means just a standard confirmation for buy / sell depends on where the Stoch RSI line if near 20 that's means buy, near 80 means sell
>> How to OPEN position:
A. Bullish
1. Trendlines Boll Ichi Crypto by Gammaprod
- The candles above the green cloud.
- Lagging span (red line) above the candles.
- then open buy near yellow line (the first option) / blue line (the second option) (always confirm the position with two other indicators below).
2. Stoch RSI Divs Zone Crypto by Gammaprod
- Teal or Green background.
- The lines is shaping green.
- Better if on the bottom (at a range 20).
3. MACD Volume Crypto by Gammaprod
- Teal or Green background.
- The lines is shaped or shaping green.
- Better if at the green histogram.
B. Bearish
1. Trendlines Boll Ichi Crypto by Gammaprod
- The candles below the purple cloud.
- Lagging span (red line) below the candles.
- then open buy near yellow line (the first option) / white line (the second option) (always confirm the position with two other indicators below).
2. Stoch RSI Divs Zone Crypto by Gammaprod
- Pink or purple background.
- The lines are shaping pink.
- Better if the line on the top (at a range 80).
3. MACD Volume Crypto by Gammaprod
- Pink or purple background.
- The lines are shaped or shaping green.
- Better if at the pink histogram.
C. Consolidation
1. Trendlines Boll Ichi Crypto by Gammaprod
- The candles on the cloud (green or purple).
- Lagging span (red line) on the candles.
- then open buy near the white or blue line (always confirm the position with two other indicators below).
2. Stoch RSI Divs Zone Crypto by Gammaprod
- Mix background specially on a timeframe 15m or more.
- The line move fast up and down.
- Better if on the bottom or the top of the lines (at a range 20 or 80).
3. MACD Volume Crypto by Gammaprod
- Changing the background.
- The line is near the middle line.
- Have small Histogram.
>> The secret ingridient is comparing the timeframe :
The example scalping (Timeframe 1m, 5m and 15m)
- TF 1m is for making an open position.
- TF 5m is for making a judgement of the trend market.
- TF 15m is to confirm that judgement from TF 5m, be careful if it not similar then it used to be a consolidation or the beginning of the reversal.
There's a lot a way to open the position than above information that i gave it to you, but consider there are a limit char on this column, I hope it will help your trading and make a more profit on it.

Stoch RSI, Div, Zone S3 by Gammaprod>> How to use this indicator :
1. Set your teadingview theme to dark theme.
2. My indicator is valid for forex, stock and but more valid for crypto.
3. Use three timeframe for more validation (choose between those, that fit to your trading style) :
- Timeframe 1m, 5m, and 15m for Scalping
- Timeframe 30m, 1h and 4h for Intraday
- Timeframe 4h, 1D and 1W for Swing Trading
4 . Always use THREE INDICATORS FROM GAMMAPROD, those three indicators is back to back each other, by the way, I only made those three indicators only (for now) :
- Trendlines Boll Ichi Crypto by Gammaprod
- Stoch RSI Divs Zone Crypto by Gammaprod
- MACD Volume Crypto by Gammaprod
>> How to setting :
1. Trendlines Boll Ichi Crypto by Gammaprod
A. Support and Resistence
- Well if you familiar with this indicator you can add it, but recommended for Timeframe 30m or more
B. Trendlines Primary or Trendlines Secondary
- Timeframe 1m you DON'T NEED Trendlines Primary or Trendlines Secondary
- Timeframe 5m you DON'T NEED Trendlines Secondary, but you CAN ADD Trendlines Primary if you fell it helpful (for me, it is helpful to find where the candles start or the end trend or a consolidation or where the candles will surpass a resistance or a support).
- Timeframe 15m you DON'T NEED Trendlines Secondary, DEFENITELY add Trendlines Primary it will help to find where the candles stop or a consolidation or where the candles will surpass a resistance or a support).
- Timeframe 30m or more, DEFENITELY NEED BOTH Trendlines Primary and Secondary Trendlines, it will help to find where the candle stop or consolidation or where the candle will surpass a resistance or support).
C. Bolinger, Ichimoku Cloud and Lagging Span
- Please DON'T CHANGE IT at all, it's really helpful to know when and where to make an entry decesion or a trend or a consolidation, if you don't understand how to read it, you better to learn it first (on "how to read" section and "How to OPEN position" the section below)
2. Stoch RSI Divs Zone Crypto by Gammaprod (DON'T CHANGE IT)
3. MACD Volume Crypto by Gammaprod (DON'T CHANGE IT)
>> How to read :
1. Sell or Buy Priority :
A. Buy Priority
- Color background on macd and stoch rsi is pink or purple sell is the priority, (if you're not sure to buy, just wait until the best moment to sell)
B. Buy Priority
- Color background on macd and stoch rsi Teal or light green buy is the priority, (if you're not sure to sell, just wait until the best moment to buy)
C. Indecision / Golden Moment
- Color background on stoch rsi yellow is indecision / golden moment of reversal pattern (wait until it formed background only on Stoch RSI), please becareful at this moment.
2. Trend / Consolidation :
A. BULLISH trend
- When Stoch RSI and MACD have teal or light green background that's means BULLISH trend, better to confirm by the candle is above green cloud and lagging span (red line) is also above the candle.
B. BEARISH trend
- When Stoch RSI and MACD have the Pink or purple background that's means BEARISH trend, better to confirm by the candle is above purple cloud and lagging span (red line) is also below the candle.
C. CONSOLIDATION
- When Stoch RSI have the mix background that's means CONSOLIDATION, better to confirm by the candle is in or near to green / purple cloud and lagging span (red line) is also on the candle.
3. Special Mark
A. Ideal Bullish :
- Near line 20 and green / teal background = When Stoch RSI have the char R / H on lime color label, that's means divergence or hidden divergence for buy position, if you not see this label that's means just a standard confirmation for buy
B. Not an Ideal Bullish :
- Near line 80 and green / teal background = if this happens make sure you know what happen, it could be a false signal or bullish continual pattern
C. Ideal Bearish :
- Near line 80 and pink / purple background = When Stoch RSI have the char R / H on lime color label, that's means divergence or hidden divergence for buy position, if you not see this label that's means just a standard confirmation for sell position.
D. Not an Ideal Bearish:
- Near line 20 and pink / purple background = if this happens make sure you know what happen, it could be a false signal or bearish continual pattern
E. The Beginning of Reversal (from BEARISH to BULLISH) :
- When Stoch RSI line shaping GREEN position is near 20.
- MACD lines still PINK, position lines is UNDER the HISTOGRAM, but the HISTOGRAM start to SHAPE FALL PINK (light pink) and the BACKGROUND still PINK / PURPLE.
- Position CANDLES NEAR BLUE line, NEAR PURPLE CLOUD, and lagging span (red line) STILL ON the area candle. (it used to be confirmed with the golden moment).
F. The Beginning of Reversal (from BULLISH to BEARISH) :
- When Stoch RSI line shaping PINK position is near 80.
- MACD lines still GREEN, position lines is ABOVE the HISTOGRAM, but the HISTOGRAM start to SHAPE FALL GREEN (light green) and the BACKGROUND still TEAL / GREEN.
- Position CANDLES NEAR WHITE line, NEAR TEAL CLOUD, and lagging span (red line) STILL ON the area candle. (it used to be confirmed with the golden moment).
G. False Signals, or It could be a Golden Moment (better to see it on TF 15 or bigger):
- Near line 20 or 80 and yellow background = When Stoch RSI have the char R / H on color label, that's means divergence or hidden divergence for buy / sell position, if you not see this label that's means just a standard confirmation for buy / sell depends on where the Stoch RSI line if near 20 that's means buy, near 80 means sell
>> How to OPEN position:
A. Bullish
1. Trendlines Boll Ichi Crypto by Gammaprod
- The candles above the green cloud.
- Lagging span (red line) above the candles.
- then open buy near yellow line (the first option) / blue line (the second option) (always confirm the position with two other indicators below).
2. Stoch RSI Divs Zone Crypto by Gammaprod
- Teal or Green background.
- The lines is shaping green.
- Better if on the bottom (at a range 20).
3. MACD Volume Crypto by Gammaprod
- Teal or Green background.
- The lines is shaped or shaping green.
- Better if at the green histogram.
B. Bearish
1. Trendlines Boll Ichi Crypto by Gammaprod
- The candles below the purple cloud.
- Lagging span (red line) below the candles.
- then open buy near yellow line (the first option) / white line (the second option) (always confirm the position with two other indicators below).
2. Stoch RSI Divs Zone Crypto by Gammaprod
- Pink or purple background.
- The lines are shaping pink.
- Better if the line on the top (at a range 80).
3. MACD Volume Crypto by Gammaprod
- Pink or purple background.
- The lines are shaped or shaping green.
- Better if at the pink histogram.
C. Consolidation
1. Trendlines Boll Ichi Crypto by Gammaprod
- The candles on the cloud (green or purple).
- Lagging span (red line) on the candles.
- then open buy near the white or blue line (always confirm the position with two other indicators below).
2. Stoch RSI Divs Zone Crypto by Gammaprod
- Mix background specially on a timeframe 15m or more.
- The line move fast up and down.
- Better if on the bottom or the top of the lines (at a range 20 or 80).
3. MACD Volume Crypto by Gammaprod
- Changing the background.
- The line is near the middle line.
- Have small Histogram.
>> The secret ingridient is comparing the timeframe :
The example scalping (Timeframe 1m, 5m and 15m)
- TF 1m is for making an open position.
- TF 5m is for making a judgement of the trend market.
- TF 15m is to confirm that judgement from TF 5m, be careful if it not similar then it used to be a consolidation or the beginning of the reversal.
There's a lot a way to open the position than above information that i gave it to you, but consider there are a limit char on this column, I hope it will help your trading and make a more profit on it.

KEForce‴ | Kaizen Evolution Force‴What does he do?
This indicator gives buy or sell signals, based on the retracement of the short and medium period moving averages.
What is it composed of?
The middle line is the axis also known as the pullback region. When price is in a strong trend, you'll se a regular bouncing (pullback) up to the 20 level line a downtrend, as well as a regular pullback down to the -20 level line on an uptrend. There is also a 40 overbought and -40 oversold regions in which a reversal is most likely to occur.
Depending on the timeframe you trade, you can change the value of this levels as you wish.
How does it work?
For example: if a price is in an uptrend...
1st: if the price pullsback to the small (9) or medium (21) moving average then
2nd: see if the indicator will pullback close to the 0 level or the -20 levelcheck. If it does
3rd: see if there is no diverncey between the price and indicator. If not
4th: put a buy position at the maximum of the buying candle and wait for the price breakout this signal line
5th: the surf the profit.

MACD Scalper AnalysisThis is a scalper analysis movement designed around MACD and 200 EMA
The rules are simple:
For long we check if the close of the candle is above the ema200 and we have a crossover between macd and signal
Once this happens we analyse the next candle, if its close higher than open , we can consider it a win and if its close lower than open we consider a lose.
For short we check if the close of the candle is below the ema200 and we have a crossunder between macd and signal
Once this happens we analyse the next candle, if its close higher than open , we can consider it a loss and if its close lower than open we consider a win.
Once we have all of this we analyse the average percentage movement and establish if the specific asset or timeframe is worthy for us.
At the same time it can give a good idea if we can go with a divergence strategy, like for example we have a short entry, but we will actually go long and viceversa.
If you have any questions let me know !

Glow Node VolumeThis volume indicator overlays bullish and bearish bars so you can see exactly who's winning the fight
also includes an information box that reads the markets trend to tell you whether it's safe to enter and trade in which direction.
Display Info Box
This box is used to advise whether it's safe to take a trade and tell you what direction (Short / Long).
It analyses the market to find the trend, Then when there is a safe time to take a trade it will advise in the direction the market is trending.
Green / Red Dots
The dots on the top of the indicator give you a quick and easy way to see who's winning the fight buyers or sellers as an average over the last couple bars

Dynamic ADX - [The Pine Guru]Dynamic ADX by The Pine Guru
What is the Dynamic ADX?
The Dynamic ADX is an indicator created using the regular ADX, Line, and additional ADX Moving Average. This MA allows the script to calculate the ADX differently to the original ADX, providing greater input and accessibility to the user. As the ADX is a volatility indicator, it is communicates to trend strength in the markets. The Dynamic ADX displays these trending Periods through user controlled visualizers like Fills, Background Color, and Bar Color.
How do I use the Dynamic ADX?
This indicator has 4 different "versions" or "conditions" in which it displays trend strength. These are achieved by checking and unchecking ADX, ADX MA and Line. Different combinations of these 3 inputs will result in a change of true condition that the script outputs.
Dynamic ADX Achieved by checking the ADX and ADX MA, results in an ADX similar to an MA Crossover, with the ADX being over the MA indicating a true or strong trend condition.
Regular ADX Achieved by Checking the ADX and Line. Results in the regular calculation of the ADX.
Mixture Achieved by Checking all three sections, which results in the calculation a normal ADX as well as the MA. Provides and extra condition or confluence into the ADX.
MA and Line Achieved by checking the ADX MA and Line. Results in a similar calculation to an original ADX but with a smoother MA.
Recommendations
This indicator will work typically in all markets with high volume and volatility. It is recommended that it is used as a confluence in a trading system, and not as an outright indicator. As always do your own testing before live use with this indicator. Do your own Research and refinements.
Please Leave a like if you enjoy this Indicator

Stochastic Moving AverageHi all,
This Strategy script combines the power of EMAs along with the Stochastic Oscillator in a trend following / continuation manner, along with some cool functionalities.
I designed this script especially for trading altcoins, but it works just as good on Bitcoin itself and on some Forex pairs.
______ SIGNALS ______
The script has 4 mandatory conditions to unlock a trading signal. Find these conditions for a long trade below (works the exact other way round for shorts)
- Fast EMA must be higher than Slow EMA
- Stochastic K% line must be in oversold territory
- Stochastic K% line must cross over Stochastic D% line
- Price as to close between slow EMA and fast EMA
Once all the conditions are true, a trade will start at the opening of the next
______ SETTINGS ______
- Trade Setup:
Here you can choose to trade only longs or shorts and change your Risk:Reward.
You can also decide to adjust your volume per position according to your risk tolerance. With “% of Equity” your stop loss will always be equal to a fixed percentage of your initial capital (will “compound” overtime) and with “$ Amount” your stop loss will always be 'x' amount of the base currency (ex: USD, will not compound)
Stop Loss:
The ATR is used to create a stop loss that matches current volatility. The multiplier corresponds to how many times the ATR stop losses and take profits will be away from closing price.
- Stochastic:
Here you can find the usual K% & D% length and overbought (OB) and oversold (OS) levels.
The “Stochastic OB/OS lookback” increase the tolerance towards OB/OS territories. It allows to look 'x' bars back for a value of the Stochastic K line to be overbought or oversold when detecting an entry signal.
The “All must be OB/OS” refers to the previous “Stochastic OB/OS lookback” parameter. If this option is ticked, instead of needing only 1 OB/OS value within the lookback period to get a valid signal, now, all bars looked back must be OB/OS.
The color gradient drawn between the fast and slow EMAs is a representation of the Stochastic K% line position. With default setting colors, when fast EMA > slow EMA, gradient will become solid blue when Stochastic is oversold and when slow EMA > fast EMA, gradient will become solid blue when Stochastic is overbought
- EMAs:
Just pick your favorite ones
- Reference Market:
An additional filter to be certain to stay aligned with the current a market index trend (in our case: Bitcoin). If selected reference market (and timeframe) is trading above selected EMA, this strategy will only take long trades (vice-versa for shorts) Because, let’s face it… even if this filter isn’t bulletproof, you know for sure that when Bitcoin tanks, there won’t be many Alts going north simultaneously. Once again, this is a trend following strategy.
A few tips for increased performance: fast EMA and D% Line can be real fast… 😉
As always, my scripts evolve greatly with your ideas and suggestions, keep them coming! I will gladly incorporate more functionalities as I go.
All my script are tradable when published but remain work in progress, looking for further improvements.
Hope you like it!

Glow-Node AlertsGlow Node Multi Pair Alerts
This indicator allows you to set a single alert in trading view while being alerted of Glow Node auto pilot signals from up to 32 forex pairs.
How to Use
Simply open the indicator on screen.
By default the indicator will have all forex pairs unselected.
Open the settings and toggle the forex pair you would like to set an alert for in the current timeframe.
(Alert signals are optimised using our glow node auto pilot feature. These alerts cant be used with custom settings due to the pair switching.)
Set an alert in trading view and select the drop down.
Select Glow Node Multi alerts and your good to go......
Supported Pairs:
XAUUSD
XAGUSD
AUDCAD
AUDCHF
AUDJPY
AUDNZD
AUDUSD
CADCHF
CADJPY
CHFJPY
EURAUD
EURCAD
EURCHF
EURGBP
EURJPY
EURNZD
EURUSD
GBPAUD
GBPCAD
GBPCHF
GBPJPY
GBPNZD
GBPUSD
NZDCAD
NZDCHF
NZDJPY
USDCAD
USDCHF
USDJPY
BTCUSD
ETHUSD
LTCUSD

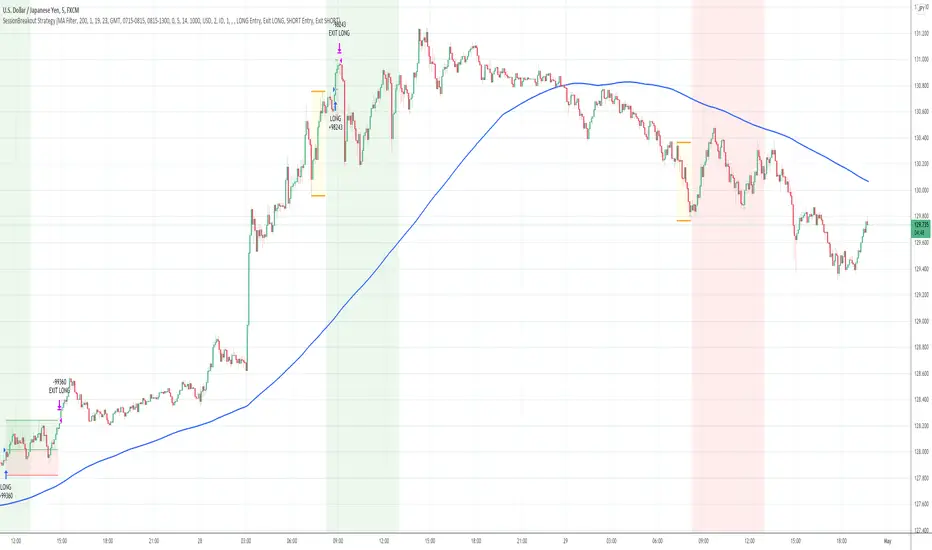
Session Breakout Strategy [Kintsugi Trading]What is Session Breakout Strategy?
This premium indicator was inspired by my desire to find and place high probability forex trades in any market, direction, or time of day.
Why Forex?
The Forex markets operate 24 hours, 5.5 days a week
Access to meaningful leverage
Ability to easily trade long or short
High liquidity
How to use it!
----- First, start by choosing a Range Session and Trade Session. -----
- Range Session = Period of time you believe will be predictive of future price action. I like to overlay 'FX Market Sessions' by boitoki to target timeframes in which forex market sessions overlap. This period is indicative of buyers and sellers battling it out in an effort to choose a direction.
- Trade Session = Period of time you believe the price will act on the information gathered from the range session.
----- Next, we filter the Range Session by information that will help further predict price movement in the Trade Session. -----
Our tools are:
Moving Average Filter
Average RSI Filter
RSI Decision Level
None
Each parameter is customizable.
----- Next, we set our risk. -----
Enter the "stop pip size' you desire.
Enter the 'target profit pip size' you desire.
We can set out ($) dollar risk-per-trade in the inputs. The script does not know your actual account balance, so if you want to risk $100/trade you would enter '$10,000' in the account balance section and '1' in the Risk Per Trade% section.
For example, an '8' stop and an '8' tp would indicate a 1:1 risk-reward. *Note - although you may generate a higher win percent with a less favorable RR, it is rarely worth it.
----- Finally, we backtest our ideas. -----
After using the 'Strategy Tester' tab to thoroughly backtest your predictions you are ready to take it to the next level - Automated Trading!
This was my whole reason for creating the script. If you work a full-time job, live in a time zone that is hard to trade, or just don't have the patience, this will be a game-changer for you as it was for me.
Auto-Trading
When it comes to auto-trading this strategy I have included two options in the script that utilize the alert messages generated by TradingView.
*Note: Please trade on a demo account until you feel comfortable enough to use real money, and then please stick to 1%-2% of your total account value in risk per trade.*
AutoView
PineConnector
Good luck with your trading!
Glow-NodeThis indicator uses multiple different indicators in confluence to identify the direction of the trend, pullback zones, accurate entry points and even exit points to give you a simpler trading experience!
Colour Changing Candles
Our first focus was to identify the direction of the trend so we created an indicator to do just that. Instead of having lots of indicators covering your screen we have set the candles to change colour when the trend changes direction! This means you can focus on taking buy trades when the candles are blue and sell trades when the candles are purple.
Glow Cloud
Our unique cloud works as a support and resistance zone, as well as giving you additional confirmation of the direction of the trend. When the price is above the cloud we’re in a buying market and when the price is below the cloud we’re in a selling market. We can also use breakouts and retests of the cloud to find good trade ideas.
Integrated Volume Indicators
Our volume indicators are working hard in the background to give us a better understanding of the market bias. Although you cannot see the indicators, they are used in confluence with the rest of the features to give us more accurate signals. You can also see whether the volume indicates bullish or bearish momentum using the confirmation table.
Main Signals
Our main signals work best between the 15m-4h timeframes. This feature will send you trading signals based on a few different strategies including MA crossovers. Glow Node will only send the signal when all of the confirmations align, giving you an extremely accurate trade set up. The confirmations consist of the market being in an uptrend, bullish volume, above the cloud and then a cross over signal with our secret tool for a buy trade and vice versa for a sell trade.
Scalping Signals
We know how much you all love scalping! When you drop to a 5 minute timeframe or lower, the main signals disappear and you will only be able to see the scalping signals. The scalping signals are triggered when the market pulls back to the cloud and rejects it meaning you can catch all the pullbacks and continuation as you trade with the trend! We’re honestly extremely excited about this feature!
Confirmation Table
Our confirmation table will tell you if all of the features above are in confluence with each other giving you great trading opportunities. It will also show you what direction the market is trending on higher timeframes. This means you can trade with a higher timeframe trend without having to change your screen. You also don’t have to put lots of effort into adding more confirmations if you miss a signal you can use your own strategy and the confirmations from this table to create your own trade ideas.
Stop Loss Indicators
Stop losses are always a topic of conversation when it comes to trading, do you place your stop loss below the previous low? Previous candle? Below a moving average? There’s so much confusion when it comes to where to put your stop loss so we added 2 different stop loss features which you can decide between. We are always optimising our stop loss settings with the current market conditions so that you can take less losing trades and focus more on winners!

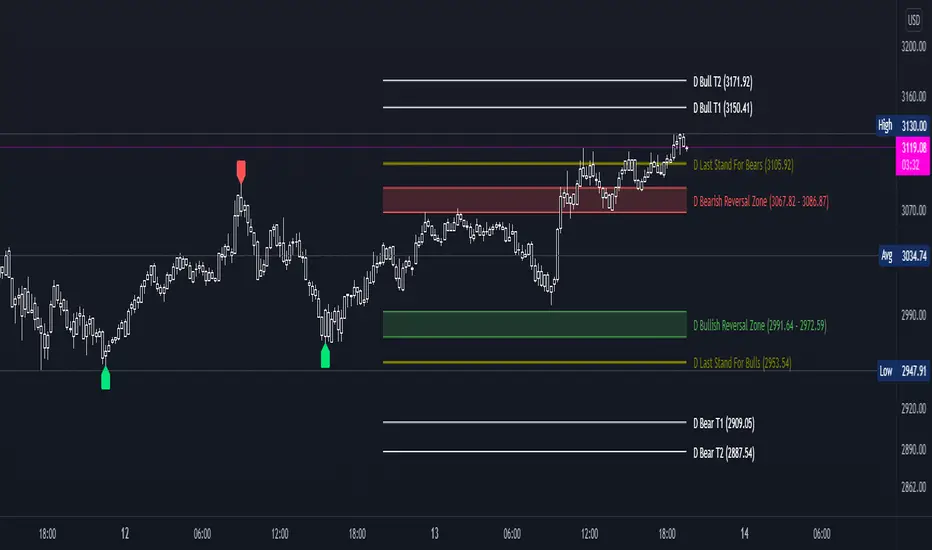
DDG PivotsDDG Pivots is an indicator that autonomously plots current reversal zones, areas of possible pivotal points for intraday trading, price targets, and true lows/highs.
This indicator will identify FINAL pivots (H/L) accurately, plotting either a green or red label to identify true lows/highs.
Once you are able to determine possible reversal areas and pivotal points, you will have a better idea on the current trend and whether these areas are respected/denied, after you can identify the correct trend, this indicator will then help by projecting predicted price targets on screen.
From entry to exit, this indicator helps ease your stress trading.
STOP STARING HOPELESSLY AT YOUR SCREEN, THIS INDICATOR HAS PUSH ALERTS FOR EACH OF THESE VITAL LEVLS.
*Turn on PUSH NOTIFICATIONS to alert you when these vital areas are touched*
Triple SWMA + EMA Crossover Color Candle+ ADX Color Candle V2! IMPORTANT !
To better see the color of the bars I suggest you deactivate the Borders option in the chart settings / Symbol, LIKE THIS:
════════════════════════════════════════════════════════════════════════════════════════════════════════════════════
The indicator is the same as the previous version, with the only difference that now the indicator is composed of an addition of secondary candles colored according to the EMA cross, while the main candles based on the ADX, the SWMA are inserted into secondary candles
════════════════════════════════════════════════════════════════════════════════════════════════════════════════════
1) SWMA
There are 3 SWMA , with the possibility of modifying the Source and the length of each one, also each SWMA can be removed or can all of them be removed with the ON / OFF option in Inputs-STYLE. (ALL SWMA?)
════════════════════════════════════════════════════════════════════════════════════════════════════════════════════
2) EMA Fast and Slow, Cross
There are two EMAs, fast and slow, both with the possibility of changing the source and length, in the chart settings it is possible to change the color of EMA Long and EMA Short:
EMA Long = Ema Fast > Ema Slow
EMA Short = Ema Slow > Ema Fast
Ema cross has a style choice option, the possible choices are:
NONE = nothing
ALL = all choices
LINE = ema200 colored based on Ema Long-Short
BAR COLOR = color candles based on Ema Long-Short
PLOTSHAPE = signals based on Ema Long-Short
LINE + BAR COLOR = line + bar color
BAR COLOR + PLOTSHAPE = bar color + plotshape
════════════════════════════════════════════════════════════════════════════════════════════════════════════════════
3) ADX Candle
The candles are colored according to 4 inputs:
Color 1 ( Silver ) = ADX < 20
Color 2 (Black) = ADX cross-ADX Index (adx+adx 14 period back) / 2
Color 3 (Lime) = ADX > 0 and DI delta (DI plus - DI minus) > 0
Color 4 (Red) = ADX > 0 and DI delta (DI plus - DI minus) < 0
all colors are editable and if you don't want to have ADX Candle on the chart, just remove the ON / OFF option in Inputs-STYLE. (BAR COLOR ADX )

Triple SWMA + EMA Crossover Color Candle+ ADX Color CandleIMPORTANT
The indicator allows you to view the Color Bars only if it is in the foreground, to do this just put the indicator before the description of the symbol, LIKE THIS:
════════════════════════════════════════════════════════════════════════════════════════════════════════════════════════════════
This indicator is composed of:
1) Tiple SWMA
There are 3 SWMA, with the possibility of modifying the Source and the length of each one, also each SWMA can be removed or can all of them be removed with the ON / OFF option in Inputs-STYLE. (ALL SWMA?)
════════════════════════════════════════════════════════════════════════════════════════════════════════════════════════════════
2) EMA Fast and Slow, Cross
There are two EMAs, fast and slow, both with the possibility of changing the source and length, in the chart settings it is possible to change the color of EMA Long and EMA Short
EMA Long = Ema Fast > Ema Slow
EMA Short = Ema Slow > Ema Fast
Ema cross has a style choice option, the possible choices are:
ALL = all choices
LINE = ema200 colored based on Ema Long-Short
BAR COLOR = color candles based on Ema Long-Short
PLOTSHAPE = signals based on Ema Long-Short
LINE + BAR COLOR = line + bar color
BAR COLOR + PLOTSHAPE = bar color + plotshape
if you don't want to have EMA Fast and Slow, Cross on the chart, just remove the ON / OFF option in Inputs-STYLE. (EMA style)
════════════════════════════════════════════════════════════════════════════════════════════════════════════════════════════════
3) ADX Candle
The candles are colored according to 4 inputs:
Color 1 (Silver) = ADX < 20
Color 2 (Black) = ADX cross-ADX Index (adx+adx 14 period back) / 2
Color 3 (Lime) = ADX > 0 and DI delta (DI plus - DI minus) > 0
Colo 4 (Red) = ADX > 0 and DI delta (DI plus - DI minus) < 0
all colors are editable and if you don't want to have ADX Candle on the chart, just remove the ON / OFF option in Inputs-STYLE. (BAR COLOR ADX)

All Forex Sessions in One Script OnlyDraws all Forex Sessions:
*it works only with forex*
These Sessions can show Daily Highs and Lows:
- Pre-London / London
- Pre-New York / New York
It's possible to hide Highs and Lows having full background for these sessions
Daily Session Breaks
- Mondays use a different color
- Asian Boxes every day
- All Sessions Ranges/Colors are editable
-All elements (pre-London/London/Pre-New York/New York/Asian Boxes/Session Breaks) can be switched off independently

[UPRIGHT Trading] Trend Direction Force Index (TDFI)The Trend Direction Force Index, TDFI or TDF Index, is a staple in the Forex community, but is excellent on most asset (i.e. stock) trading.
Developed by Pyotr Wojdyo for metastock trading platform originally, but now on several other.
The idea of the TDFI is that there is enough trend directional force to enter the trade.
How it works:
When the signal is above the high threshold, the trader can go long.
When the signal is below the low threshold, the trader can go short.
It's usually used as confirmation along with another indicator.
Features:
Fully customizable
Built-in color changing
Alerts!
If you like this, you will definitely like what else I've published.
Like, follow, support, etc.
Enjoy.
Cheers,
Mike
(UPRIGHT Trading)

Trend Trading with Currency Strength MeterThis is a trend trading strategy designed mainly for forex made of two big components:
First we have the currency meter, which is made of taking TSI of different INDEXes such as EUR, USD, GBP, JPY, NZD, AUD , CHF and CAD.
Once we establish which one is the weakest and most powerful, we pair them together and we go on that chart.
Lastly we check with the EMA 200 to confirm our direction.
We can see in this example for the USDJPY chart, that USD is the strongest, JPY is the weakest and ema confirm our bullish trend.
For timeframe in general I recommend big timeframes, 1-4h+ , and as a mentality a swing trading mentality, we can stay in trade for days/weeks.
For exit in general I recommend to exit when either one of the pairs losses/gain power or when the EMA is crossing with current candle
If you have any questions, let me know !

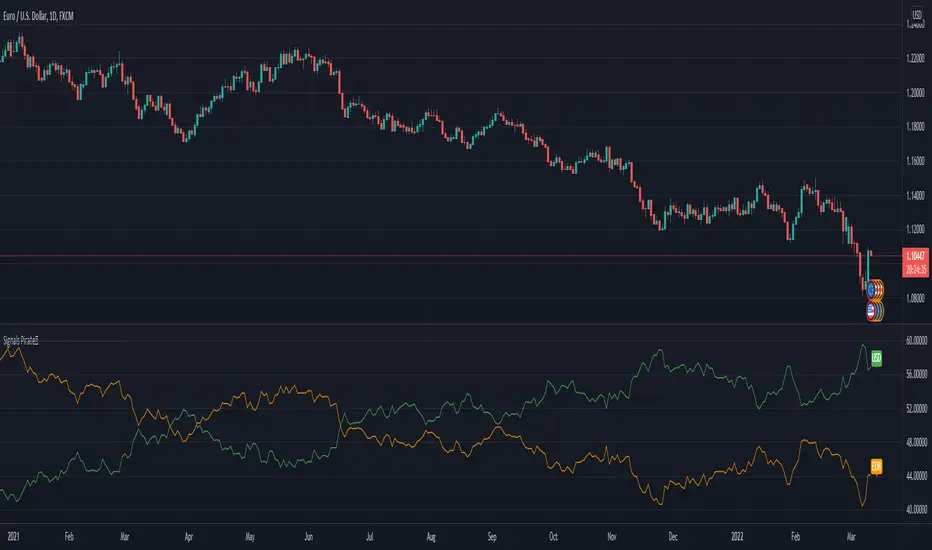
Signals Pirate™ Currency Strength IndicatorSignalsPirate™ Currency Strength package was created to take your Forex trading to the next level. With a simple yet intuitive display of the underlying strength of all major currencies it’s a great tool to add to your arsenal, or even as your sole trading strategy component!
The only input required to fine tune the underlying logic is the ‘Length’ variable, this can be adjusted to alter the look back period for strength determination. This metric is calculated using a combination of strength indicators such as the RSI, Stochastic, ADX and more applied to the underlying currency index, such as the DXY for the USD. When the Currency Strength value increasing for any given currency, it’s a great indication that there is great underlying strength as the currency becomes more valuable in comparison to other currencies; and vice versa as the value decreases.
The default settings are the best settings we’ve found so far but you can change them to build your own unique trading strategy. We’d recommend experimenting with values to find the best results for the asset you are trading, and your own personal trading and investing style.
Direction for use:
1. Use on any asset (preferably Forex) and time frame.
2. Fine tune the Length input and customise the visuals.
3. Watch for divergences between strong and weak currencies as the strength value increases/decreases.
4. Consider longing currencies that are showing overwhelming strength vs currencies that are showing weakness, and do the opposite for short trades. For example, if the USD is massively increasing in strength and the EUR is decreasing, shorting EURUSD may be a trade to watch.
5. Be aware of the strength values changing, closing trades as the divergences decrease is sensible.
As mentioned previously, this is a strength system that dynamically operates to function with superior accuracy regardless of what currency you’re trading. But with the level of customisation available, this can easily be fine tuned to accommodate scalping, reversal trading, or even long term investing.
We hope you love this Forex and Currency Strength tool, and it takes your trading and investing to the next level. Please let us know if you have any questions or queries, or if you have any suggestions for improvements etc. We love your feedback and are constantly striving to continuously improve!
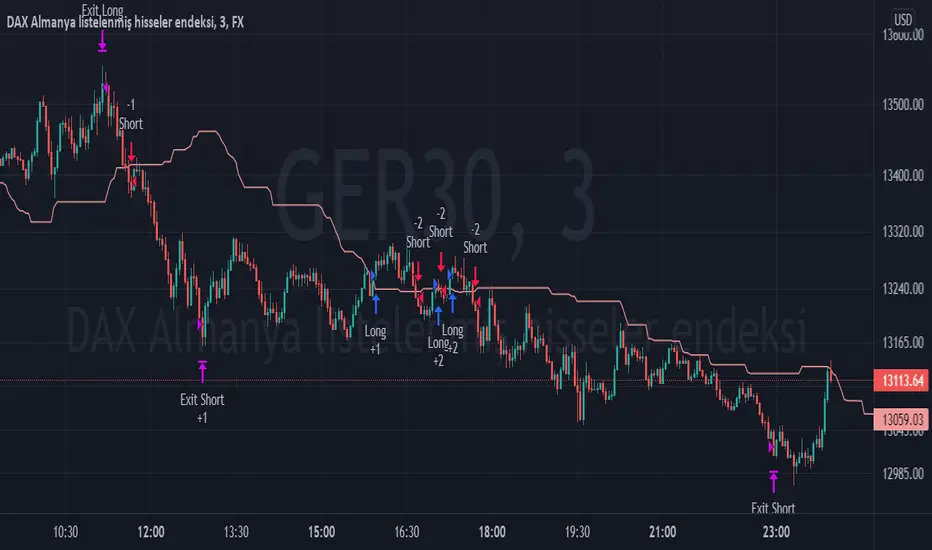
TPS - FX TradeI based my strategy on the Lagging Span 2 line in the Ichimoku Cloud. I actually designed the strategy for the DAX Germany index 3 Minutes period, but you can use it on any instrument you want. I would like to point out some points that you should pay attention to when optimizing the strategy for the instrument you want to use.
Position Take Profit and Stop Loss levels are tick calculations. These values will differ for each instrument. If you are trading in Forex, the values you will write here should be starting from the numbers after the comma in the instrument value. For example, if you want to take profit at "200" points in DAX, you must write "20000" in the Long or Short Take Profit Score field, this applies to the Stop Loss Points, but if you want to take profit or stop loss at 200 points in UKOIL, you must write "200" in the entry part.