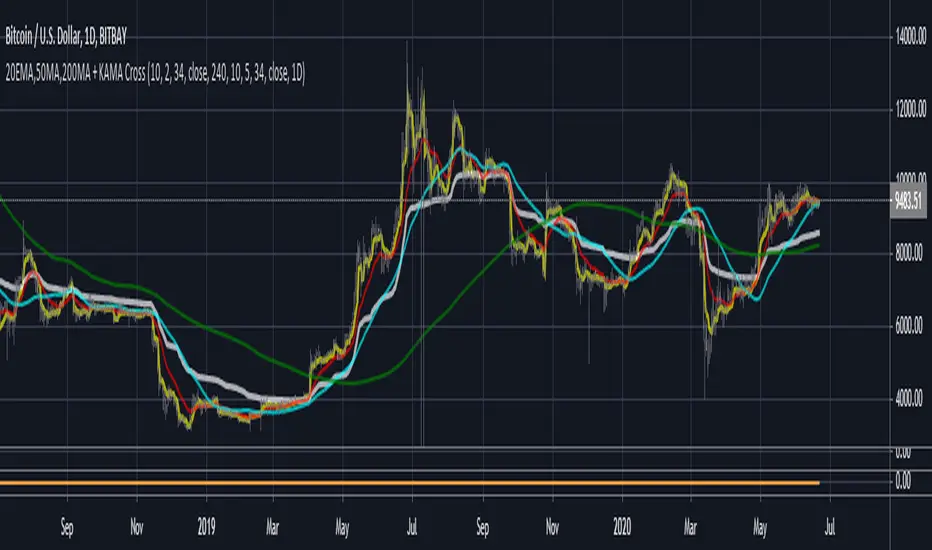
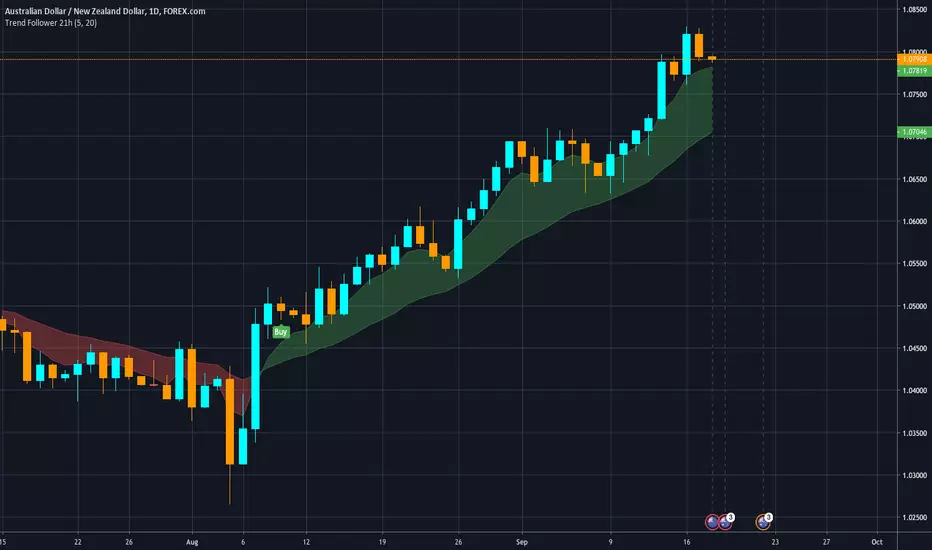
3MA'S + KAMA Trend (20EMA,50MA,200MA + KAMA Trend)This indicator, combines the traditional FOREX moving averages (20EMA, 50ma, 200ma) into a single indicator with
an adaptive moving average (AMA) taken from a user defined timeframe to show trend direction (by default, it plots
the daily 10/2/34 KAMA overlayed on any timeframe chart.
An AMA moves slowly when markets are sideways but swiftly during periods of volatility as a result it reacts much fast than
traditional options for moving average trends.
If the price is above the KAMA, trend is up. Below the KAMA, trend is down.
外匯
Basic Forex TerminalHello,
This script is a simple Forex terminal.
It serves the same purpose as Heatmaps.
You can also set the period to look back manually in the menu.
Major indicators are taken into account.
In this way, an idea can be obtained about all major and minor currencies.
Best regards.

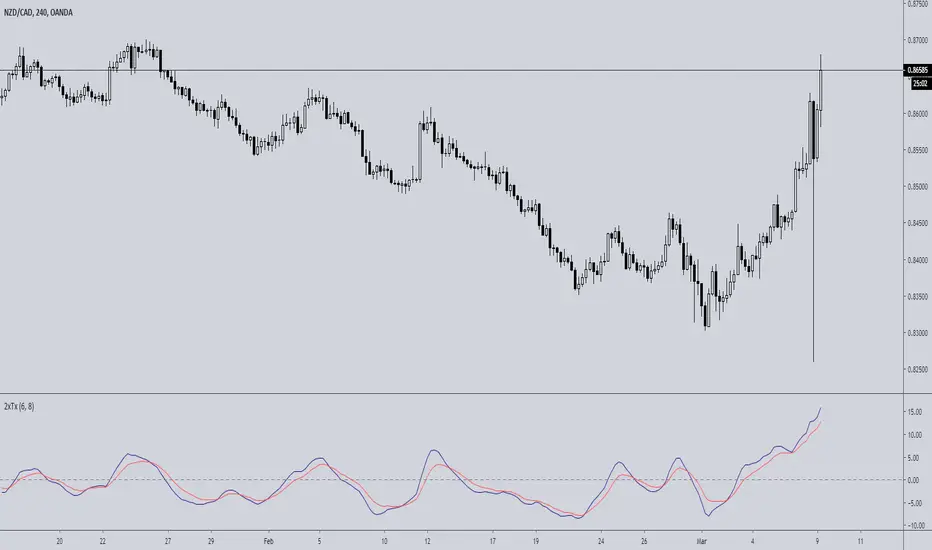
Double TRIX CrossoverTRIX is a great indicator to use on zero cross setups.... know what's even better? TRIX CROSS setups!!!
Faster in-and-out on trends, safer entry and exit signals in chop or consolidation. Base setup is 6 & 8 TRIX for longer time frames such as 4hr or 8hr; ideal or FX, Crypto, or volatile instruments. I haven't experimented with using this on lower time charts and adjusting the trix settings; if you do, drop a comment.
On Balance Volume with CrossOBV indicator with a few key changes that can turn it into a filter or trading indicator as-is.
Volume calculation given a look-back to help clarify trends without smoothing lag
Change the source (HLC3 indicates a little faster in backtesting)
Smooth the signal if desired
Moving average (MA) added for crossover indication in trend change
MA can be either EMA or HMA**
** My personal use:
EMA for trend filtering trades: Trade long signals if OBV is above the MA, trade short signals if OBV is below the MA.
HMA for scalping and chop: Normally set the HMA to 20 or 15 and trade the crosses. Works on most time frames and generates a lot of noise. 5 min and 15 min seems best for me in day trading
Example of trend trading using only the OBV-C and no other indicators, stops, or trailing stops:
This could obviously be improved using stops, trailing stops, or other indicators to filter when to enter & exit trades or mitigate loss.
Example of trading using the HMA and lower time frames with Elder's Force Index (EFI) used as a filter. Trade with both cross at or very near the same time. Winning trades in green:

Best Volatility Calculator (Multi Instruments)Hello traders
A bit of context
Definition: Volatility is defined as the close of current candle - close of the previous N candle
This is an alternative version of my Best Volatility Calculator
The other version is displayed on a panel below. This one overlays on the chart using the "overlay=true" setting
This indicator shows the average volatility, of last N Periods, for the selected time frames and for 2 selected instruments.
You can select up to 2 timeframes with this version
Presented as Currency, Pip, percentage labels in a panel below.
Will calculate in real-time only for the current instrument on the chart.
The indicator is coded to not be repainting
Example
In the indicator screenshot, I used a lookback period of 1.
That compares the current candle close versus the previous one for the daily and weekly timeframe
Showing how the results look like using FOREX instruments (where using the PIPS labels make more sense than with cryptocurrency assets)
Best regards
Dave

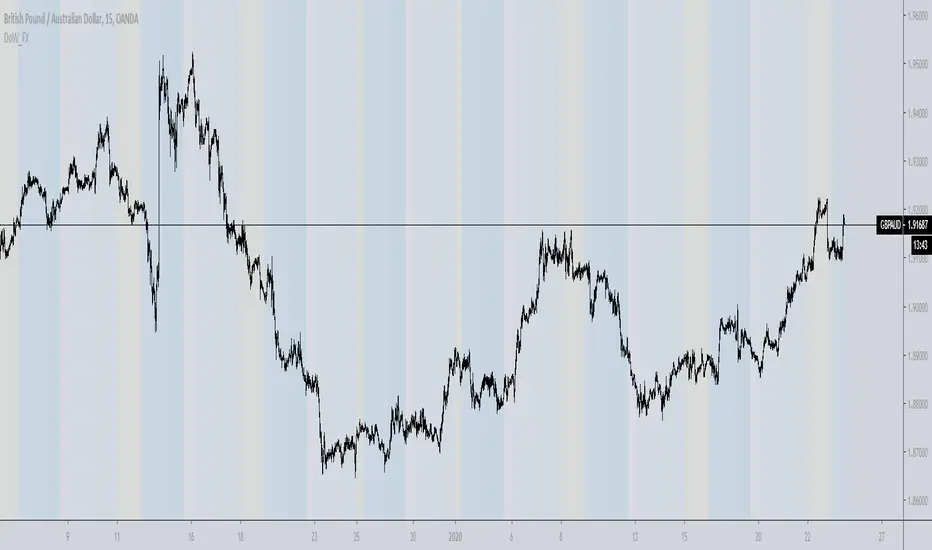
Day of week, Forex FixCalendar to work on instruments that trade a 24 hour day like crypto and forex, also does not display if you are above an intraday time. Main tweak was to end the trading day at 0000 (midnight) instead of 1700 (5pm) NYC time.
This update is geared towards Forex traders, which is why I chose to highlight Wednesday in yellow since that is commonly thought of as a midweek reversal point.
@airscape built a good calendar indicator based on the work of @ChrisMoody, this is really an update to their work and directed towards FX and Crypto
airscape:
ChrisMoody:
Future development:
Toggle for light and dark themes
Adjustment/offset for DLST and local vs/ server time
Additional color bands to denote Asian/London/NYC sessions?
Text label for days instead of color option?
Clean up the code and simplify

BEST Supertrend CCIHello traders
Today I present you a Supertrend not based on candle close but based on a CCI (Commodity Channel Index)
How does it work?
Bull event: CCI crossing over the 0 line
Bear event: CCI crossing below the 0 line
When the event is triggered, the script will plot the Supertrend as follow
UP Trend = High + ATR * Factor
DOWN Trend = Low - ATR * Factor
This is an alternative of the classical Supertrend based on candle close being above/beyond the previous Supertrend level.
Hope you'll enjoy it and it will improve your trading making you a better trader
Dave

Trendy Bar Trend ColorTrendy Bar Trend Color
Inspired by trend candlestick charts on other trading platforms. Changes bar colors to stay in trend much like Heikin Ashi candles without the ATR price distortion. This is done by comparing the HL2 and/or Open-Close values of current candlestick to the prior candlestick.

ZoneBand (@Mido_yuiya)Bollinger band is converted to EMA , and support and resistance bands are made into regions

Mirror TSI-MACD by Trader JayI was playing around with the TSI-MACD and surprisingly it works quite well as a mirror.
There are 2 ways this can be used
1. Enter long when Blue line crosses up the Red
2. Exit long when Green line crosses the blue
or
1. Enter long when Blue line crosses up the Red
2. Exit long when Blue line crosses back down below the Red

Syminfo.TypeHello traders
Earlier this week I discovered a new built-in variable called syminfo.type
What is it for?
This variable returns the type of the current symbol. Possible values are cfd, stock, futures, indices, forex, crypto, fund.
Cool bro but... should we care?
Well... we all should. Imagine you have a generic script and you want a different configuration whether you're trading FOREX or Crypto .
I designed a dummy example in that script that will preset the inputs according to the asset type from the chart.
Here I want 12/26/9 for forex and 20/50/50 for crypto - 30/60/90 otherwise
Quick caveat
It seems that for any crypto asset, syminfo.type returns "bitcoin". TradingView will fix it at some point but wanted to give you the heads-up regardless
Enjoy and all the BEST ^^
--
Dave

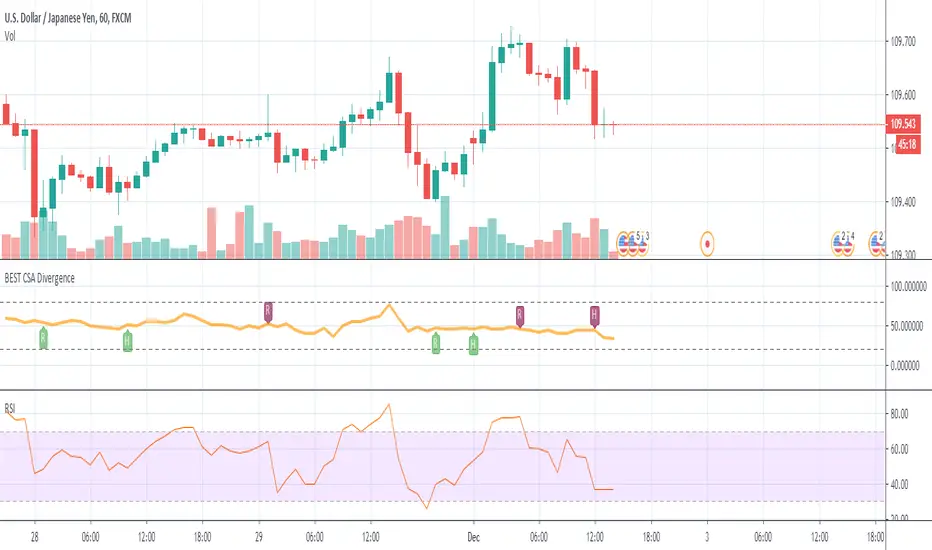
BEST Currency Strength Indicator DivergenceHello traders
Hope you had a great Thanksgiving
Now it's my turn to give and all I ask in return is you to be thankful (did I get the "Thanksgiving" thing right?)
The Currency Strength Indicator plots an average of the selected FX pairs in the indicator.
Someone asked me if I could develop an alternative of that script adding a divergence component.
The script evaluates the divergences between the average of the selected RSI(FOREX pairs) and the RSI(FOREX pair) displayed on the chart.
This version includes new features such as:
- the RSI length can now be selected
- we can select the 6 pairs used for the divergence calculations
All the BEST my aspiring traders and quants
See you tomorrow for another script
Dave
Mirror MACD by Trader JayThis is my take on the metatrader indicator, the mirror macd. Works pretty good on Forex, haven't tested on anything else
Enter long after the Blue Line Cross Up the Red Line and EXIT after the Green line Cross Up the Red Line (above the Blue Line).
For the opposite position : ENTER SELL after the Red Line Cross Down.

Session P4L MTFCorrected indicator for better support of smaller time frames. version 3.0 with better interface. thank you

Session P4L SNIPERSsession separator only for the operation of the academy. by its time margin. added the asian range for a power of three

DAY separator P4L FOREX
day separator for better orientation of neutralizations in the graph. with the possibility of choosing day and color to show in the graph

InfoPanel Divergence IndicatorThis panel spots divergences of some well knonw indicators. It may be usefull because you have all indicators in one panel only.
Also, you can check on chart which indicator gives better results of each pair on stock or index or crypto.
TO DO: to add custom indicators.
thanks to: RicardoSantos for his script of panel coding
Tradingview scripts
Other members of TV community (I cannot remember the source and inspiration of all snipets)
Please use comment section for any feedback.

Tenkan Kijun Cross AlertTenkan Kijun cross alert, best used alongside a Volume indicator to help aid with finding those trend continuation patterns.
I prefer to use the Chaikin Money Flow, when it indicates and holds above the 0 line then you will bias Longs, and when below then you will Bias shorts
If you like this then please donate
BTC: 1LRbUgrkvFLQ5Mt7C62EJRD9aMvhDNT22K
ETH: 0xa509b89bccb788234278eFE63470c10946E26F3c
LTC: LV7MUr6arvCffS5N6pbTWgav5S3Yi1Eejp

AntiRekt Trend OscillatorWhen the indicator value is above the horizon line the trend is up, below the trend is down. Watch out for ranging markets.

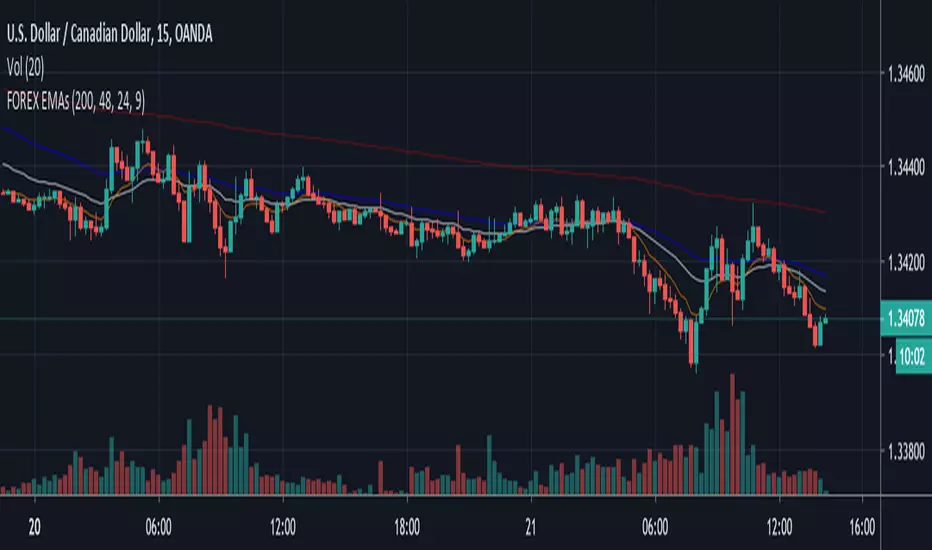
FOREX EMAsPretty simple here - this is the base EMAs I suggest most traders use in the FOREX market for swings and scalp trading. Works well on 5m, 15m, 1H, 4H, and daily trading if you design an edge to interpret the relationship these averages of price are telling you.
The 9EMA is not as valuable on the 1HR timeframe.